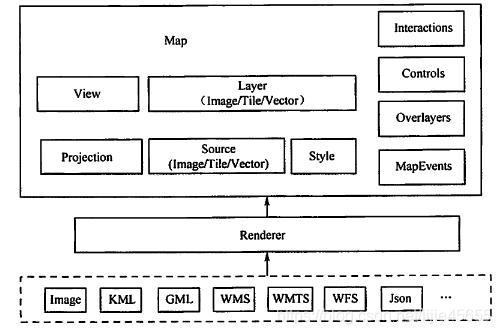
Openlayers core
How Openlayers implements interactive drawing
-
Create vector layers and vector data sources - Create canvas
-
Create a brush
-
Activate brush
How to load the sky map, set the center point and display level
const TianDiMap_cva = new ol.layer.Tile({
title:"天地图矢量注记图层",
source:new ol.source.XYZ({
url:'http://t0.tianditu.com/DataServer?T=cva_w&x={x}&y={y}&l={z}&tk=' + '8a5c2b00e94b49659861e064c37f778d',
wrapX:false
})
})
const map = new ol.Map({
target:'map_container',
layers:[TianDiMap_vec,TianDiMap_cva], view:new ol.View({
projection:'EPSG:4326',
center:[0,0],
zoom:1
})
})
How to implement layer switching
const layers = map.getLayers().getArray();
map.addLayer();
map.removeLayer();
map.getLayers().item(index).setVisible(boolean) //实现图层的显示和隐藏
How Openlayer queries features
Define geojson data locally
var data = {
type: "FeatureCollection",
features: [
{
type: "Feature",
geometry: {
type: "Point", coordinates: [114, 30]
},
properties:{
id:1001,
name:"武汉"
}
},{
type:"Feature",
geometry:{
type:"LineString", coordinates:[
[114,30],
[120,30]
]
}
}
]
}
const style = new ol.style.Style({
//填充⾊
fill: new ol.style.Fill({
color: 'rgba(255, 255, 255, 0.2)' }),
//边线颜⾊
stroke: new ol.style.Stroke({
color: '#ffcc33',
width: 2
}),
//形状
image: new ol.style.Circle({
radius: 8,
fill: new ol.style.Fill({
color: '#ffcc3367'
}),
stroke: new ol.style.Stroke({ color: '#333',
width: 2
})
})
})
var source = new ol.source.Vector({
/* 将geojson数据设置给实例数据源 */
features: new ol.format.GeoJSON().readFeatures(data) })
var layer = new ol.layer.Vector({
source,
style
})
map.addLayer(layer);
给要素定义样式
var data = {
type: "FeatureCollection",
features: [
{
type: "Feature",
geometry: {
type: "Point",
coordinates: [114, 30]
}
}
]
}
const style = new ol.style.Style({
//填充⾊
fill: new ol.style.Fill({
color: 'rgba(255, 255, 255, 0.2)'
}),
//边线颜⾊
stroke: new ol.style.Stroke({
color: '#ffcc33',
width: 2
}),
//形状
image: new ol.style.Circle({
radius: 8,
fill: new ol.style.Fill({
color: '#ffcc3367'
}),
stroke: new ol.style.Stroke({
color: '#333',
width: 2
})
})
})
var features = new ol.format.GeoJSON().readFeatures(data) //++ features[0].setStyle(style)//++
var source = new ol.source.Vector({
/* 将geojson数据设置给实例数据源 */
features
})
var layer = new ol.layer.Vector({
source
})
map.addLayer(layer);
Load data from geojson file
{
"type": "FeatureCollection",
"features": [
{
"type": "Feature",
"geometry": {
"type": "Point",
"coordinates": [114, 30] }
}
]
}
const source = new ol.source.Vector({ url: './data/map.geojson', format: new ol.format.GeoJSON()
})
const layer = new ol.layer.Vector({ source
})
map.addLayer(layer)
Must be loaded as a service, otherwise an error will be reported
Load network data
const source = new ol.source.Vector({
url: 'https://geo.datav.aliyun.com/areas_v3/bound/geojson?code=420100', format: new ol.format.GeoJSON()
})
const layer = new ol.layer.Vector({
source
})
map.addLayer(layer)
openlayer adds a layer to the specified location
const layers = map.getLayers();
layers.insertAt(index,layerName);
openlayer coordinate conversion
var gcs4490 = ol.proj.transform([605906.540647357,2723639.37418766], new ol .proj.Projection({code:'EPSG:4548'}),new ol.proj.Projection({code:'EPSG:449 0'}));