Article directory
Preface
Based on the above project file , this article describes how to use the fpga embedded logic analyzer. The embedded logic analyzer is a very important tool in the fpga development and debugging process. This tool can help us observe some internal signals. Some changes in it then help us debug to find the problem.
1. Method 1 - Use IP core to create ILA debugging environment
1. Create ILA ip core
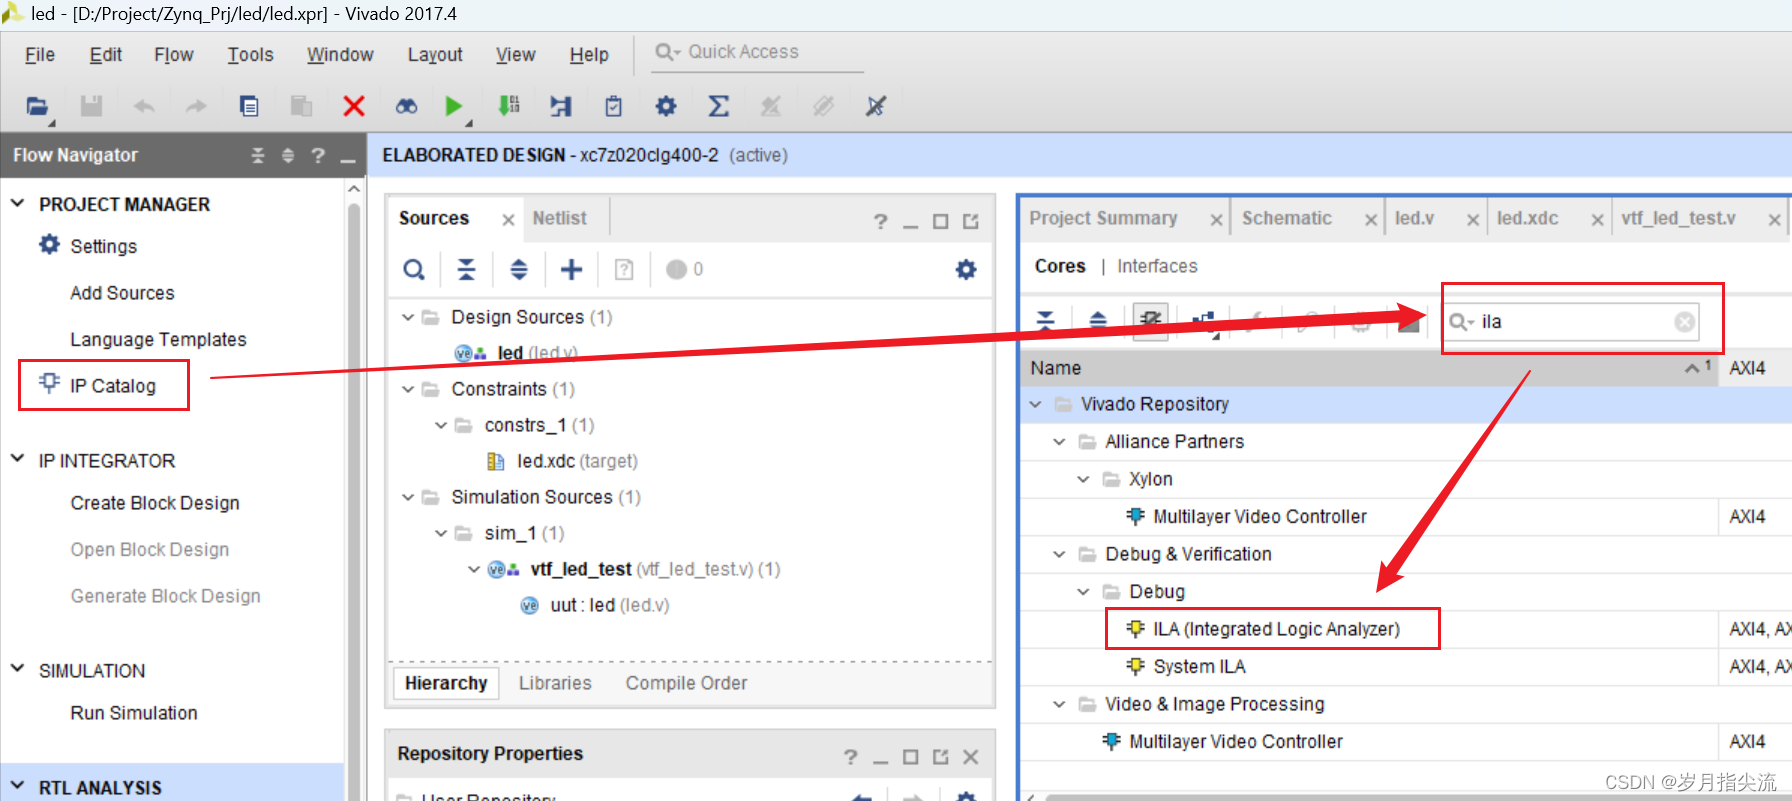
①. Click on the PROJECT MANAGER bar on the left -> IP Catalog or Window -> IP Catalog under the menu bar. Then search for ILA under the IP Catalog window that appears on the right. Double-click to select ILA under Debug for IP configuration. The steps are as shown in the figure below
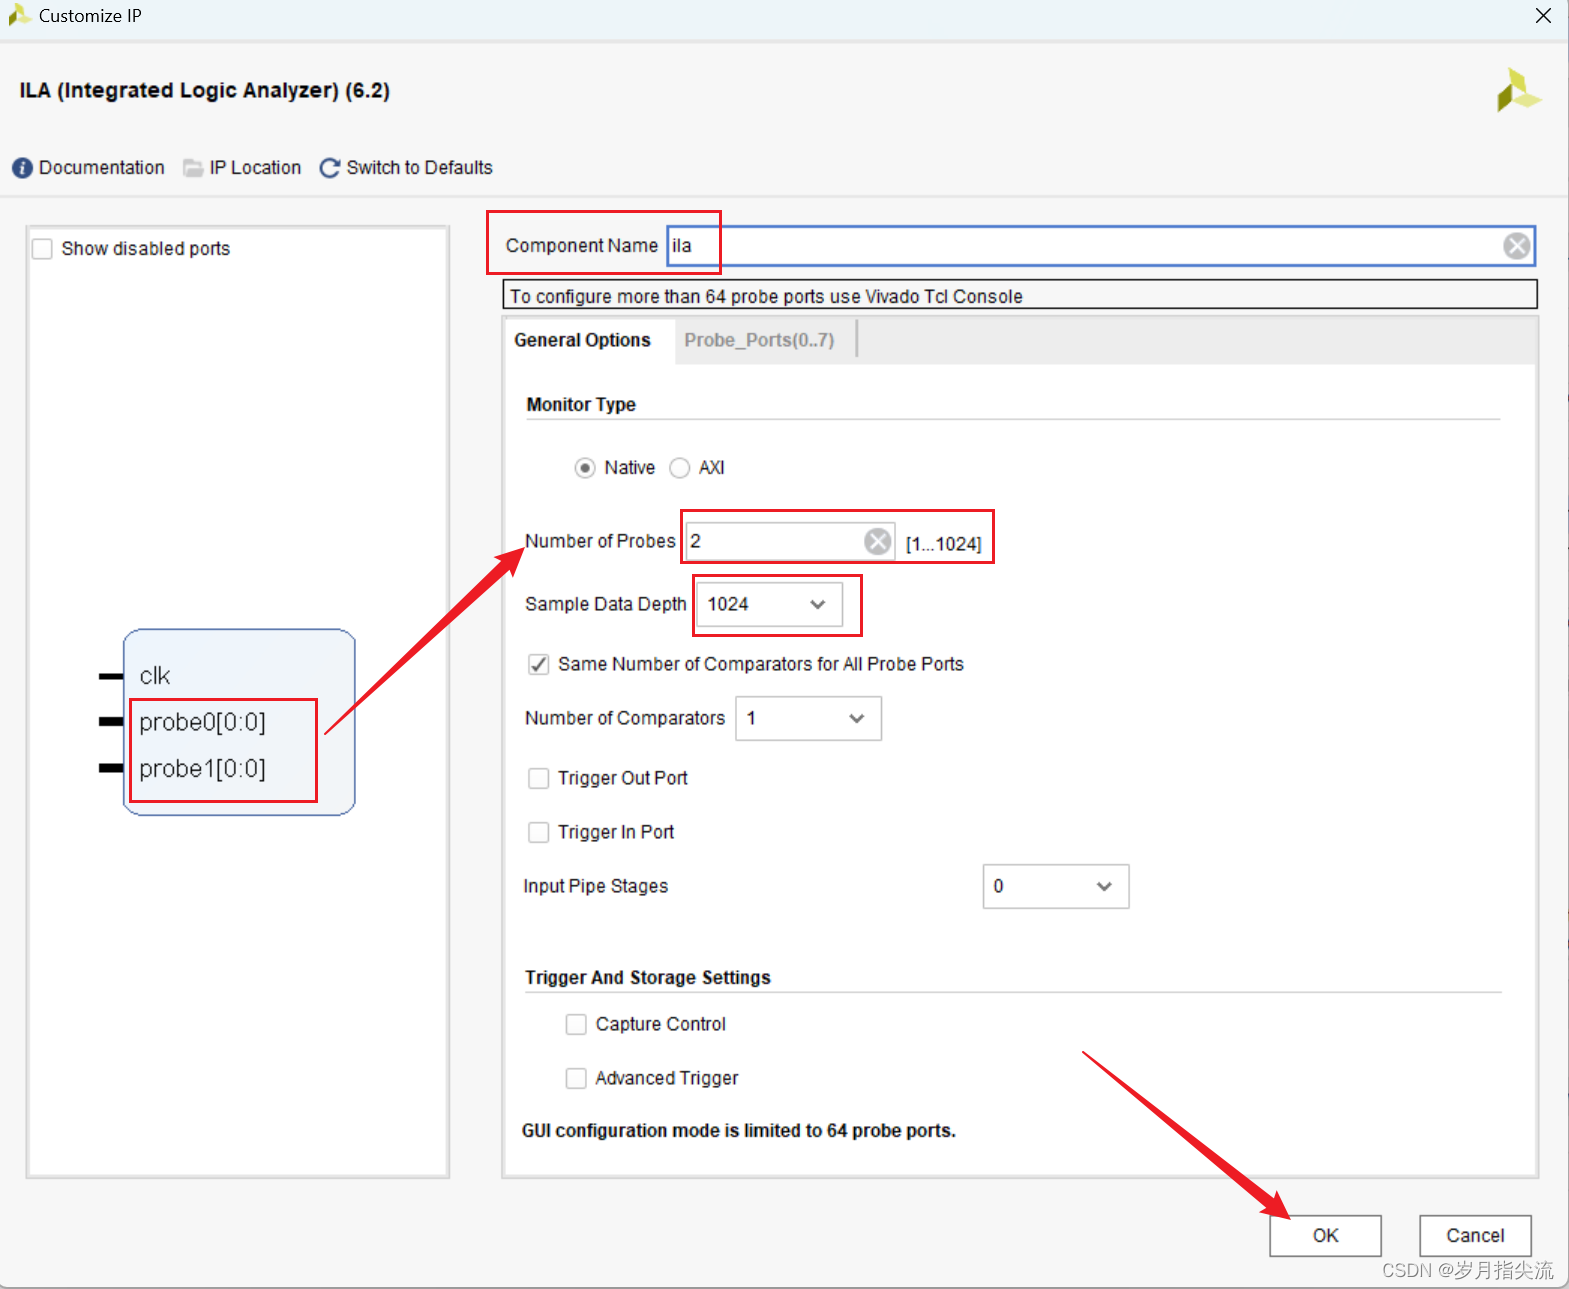
② , General Options parameter settings
- Component Name: Set the name of the generated IP Core, here it is set to ila
- Number of Probes: Setting the number of probes. There are 2 signals to be observed (one is the counter and the other is the LED light), so the number of probes is set to 2 here.
- Sample Data Depth: Sampling data depth. The larger the value is set, the more data will be sampled, and the more waveform data will be seen, but the more resources will eventually be occupied. It is not that the larger the setting, the better. This can be set appropriately according to actual needs. We can choose to set 1024 here.
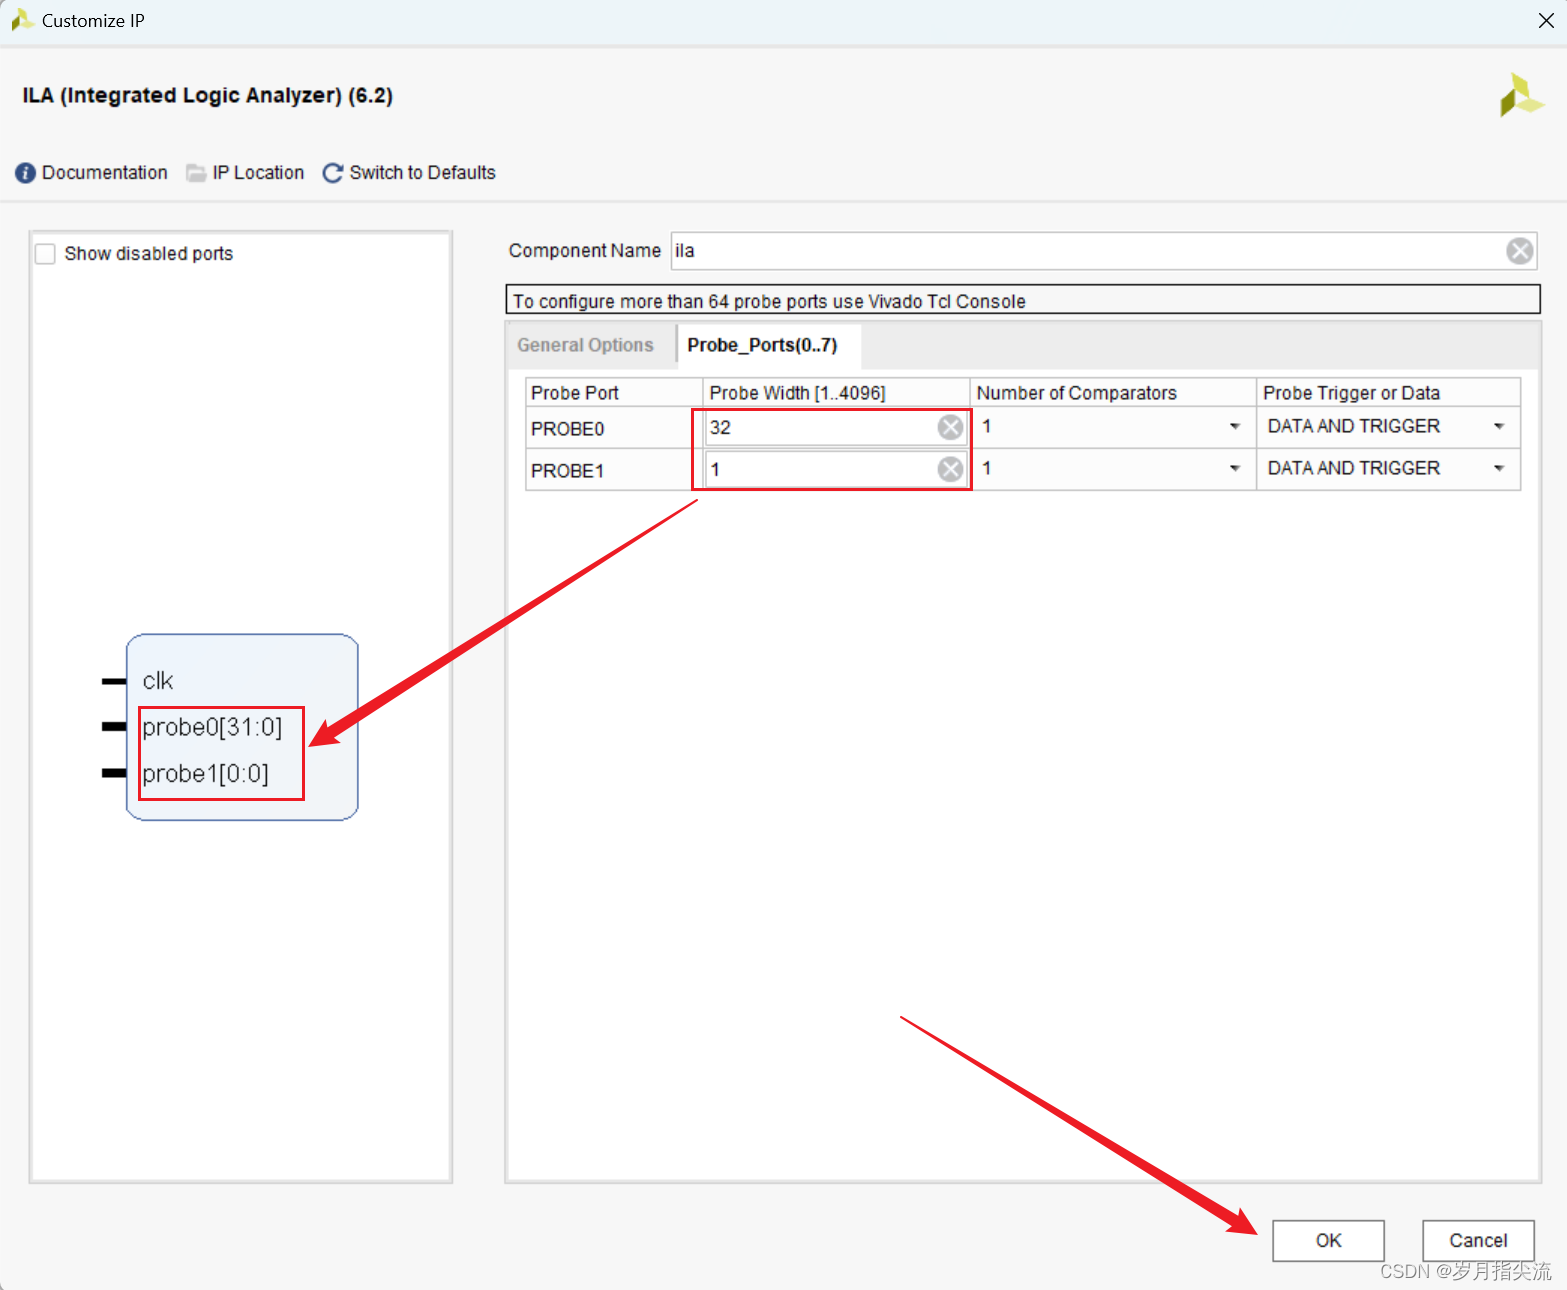
③. Probe_Ports(0…7) parameter setting
Probe Width: the bit width setting of the probe data signal. We need to observe a 32-bit counter and a 1-bit LED light signal online, so here the PROBE0 bit width is set to 32, the PROBE1 bit width is set to 1, and you can see that the graphics device pins on the left also change accordingly. Click OK.
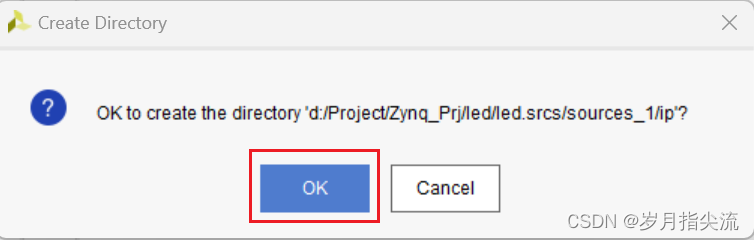
④. A popup will pop up to see if you can create an IP in one of our paths.
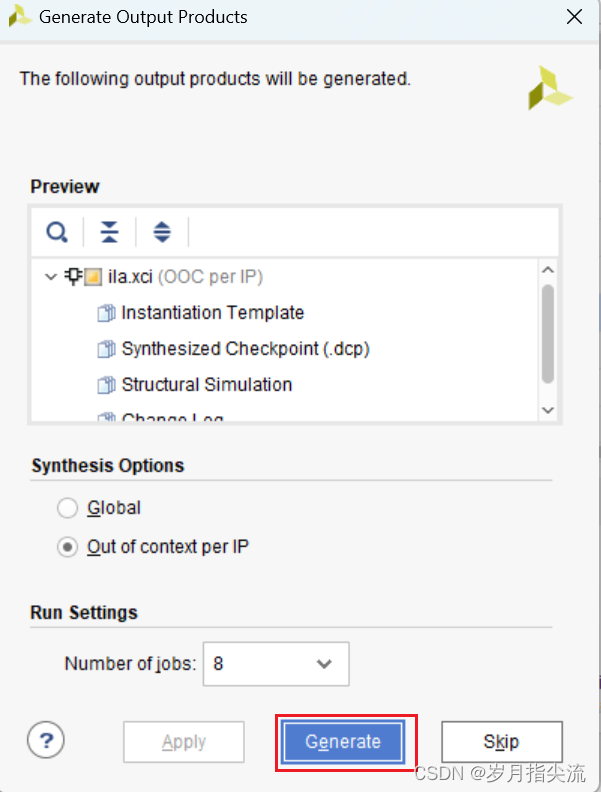
⑤. Click Generate to generate the IP core.
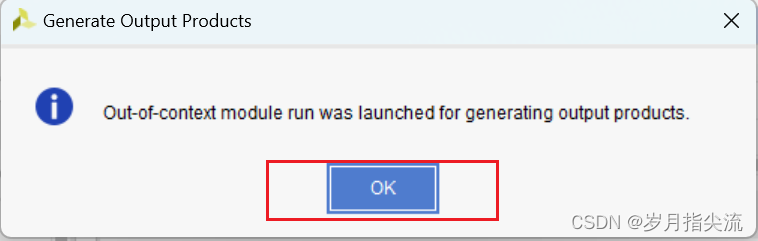
⑥. Click OK
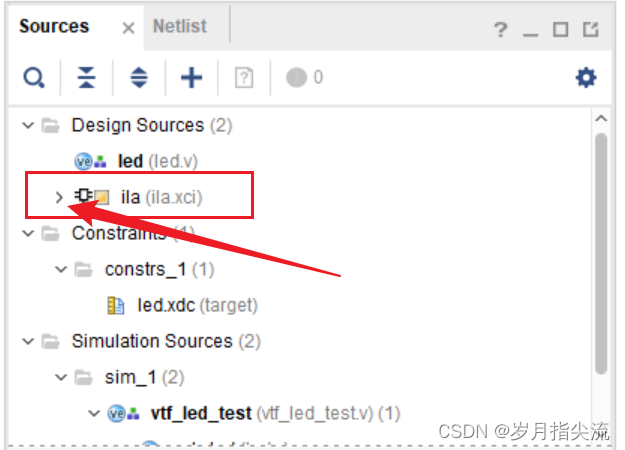
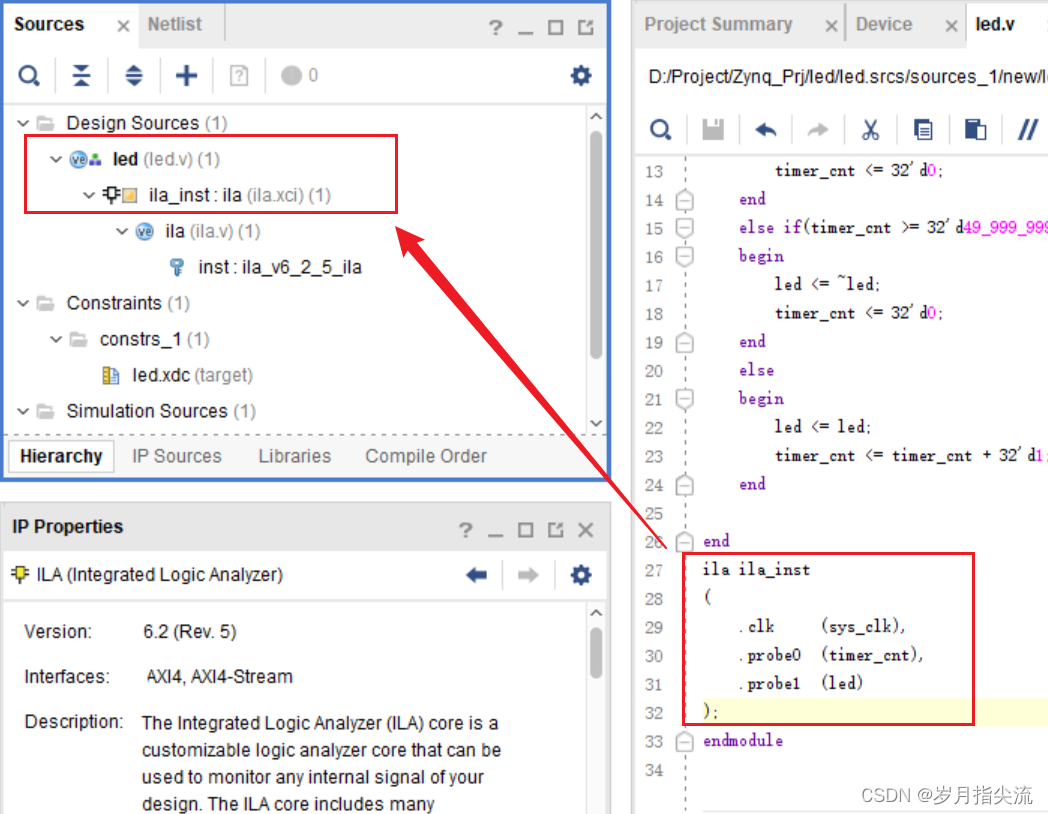
⑦. At this time, you can see the newly added ila.xci file in Design Sources. Click the ">" on the left to expand its hierarchical relationship.
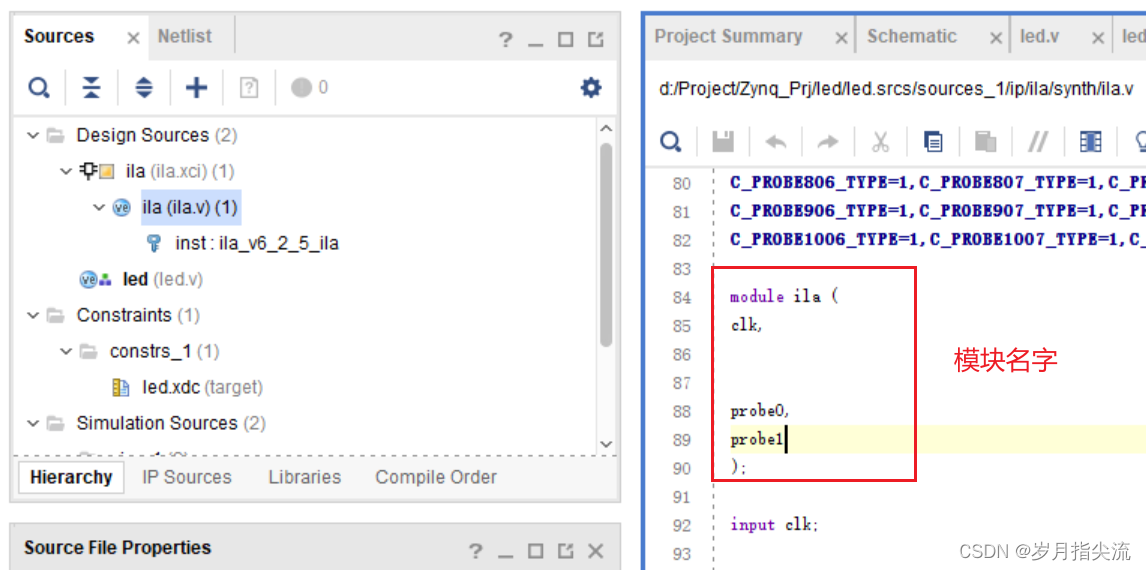
⑧. After expansion, we can see the top-level .v file. Open the ila.v file and we can see the ila module name.
2. Instantiate
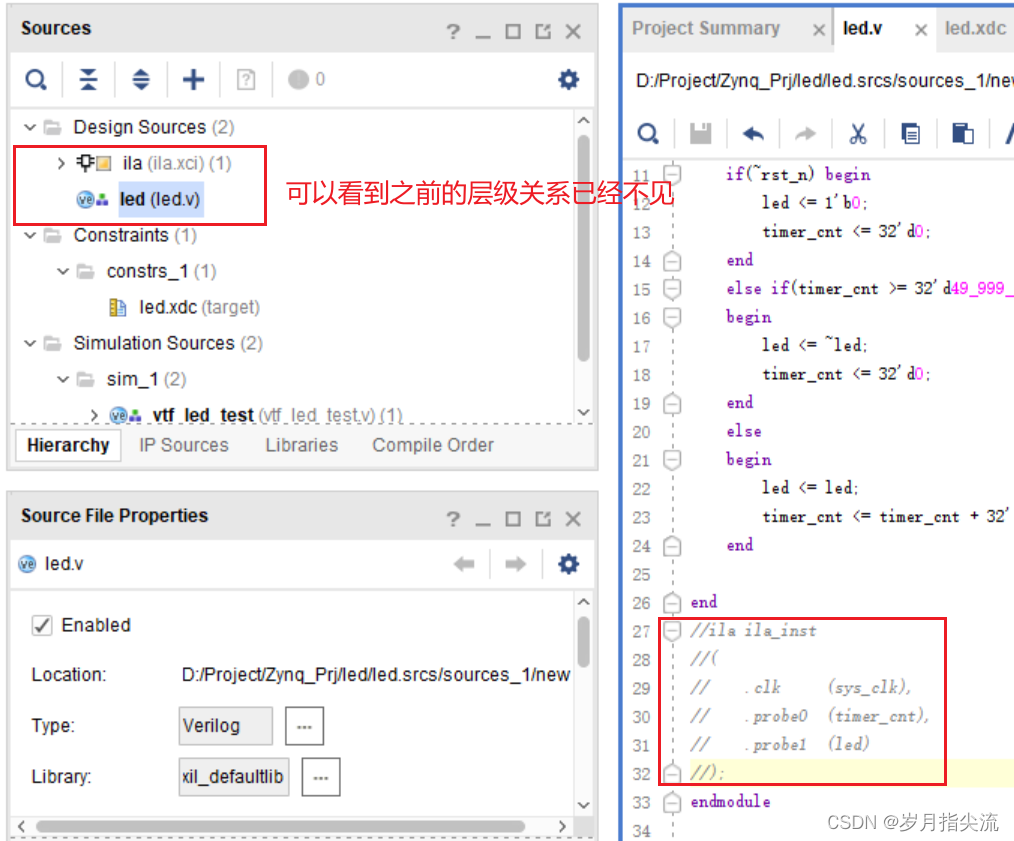
①. The next step we have to do is to instantiate. Add the following code before endmodule in the led.v file. After clicking save, you can see the new hierarchical relationship. LED includes ila, as shown in the figure below.
ila ila_inst
(
    .clk     (sys_clk),
    .probe0  (timer_cnt),
    .probe1  (led)
);
3. Generate bitstream file
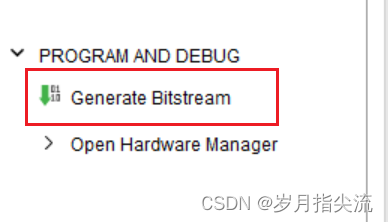
①. Click Generate Bitstream
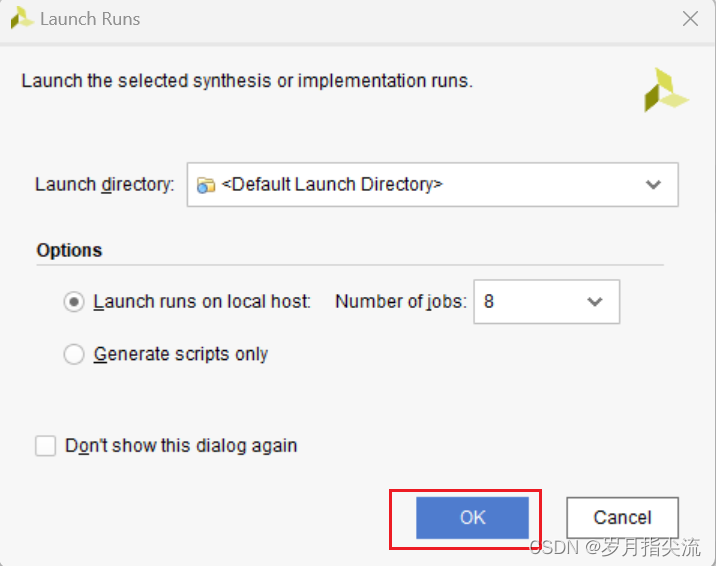
②. In the pop-up dialog box, you can select the number of tasks. This is related to the number of CPU cores. Generally, the larger the number, the faster the compilation. Click "OK"
4. Download the program
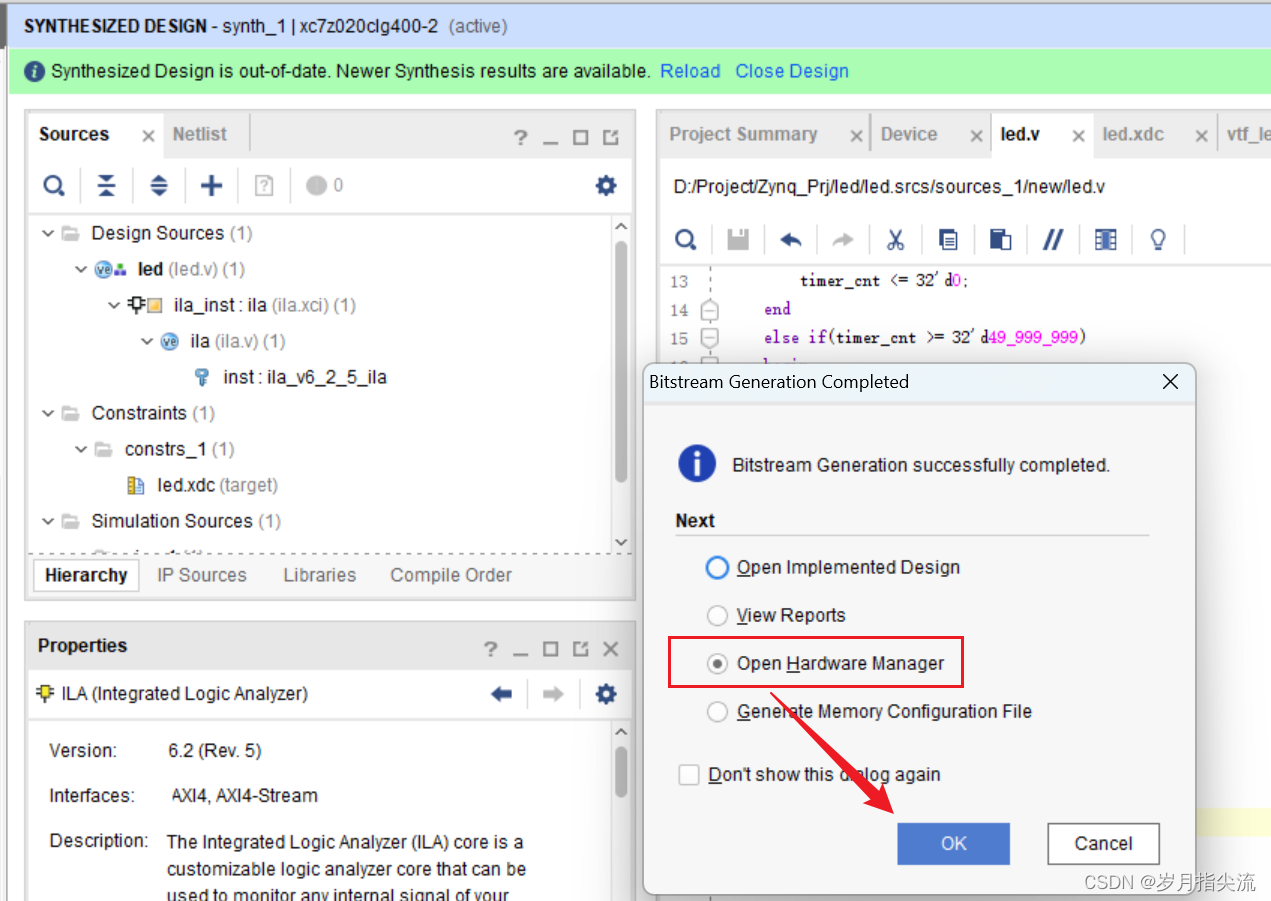
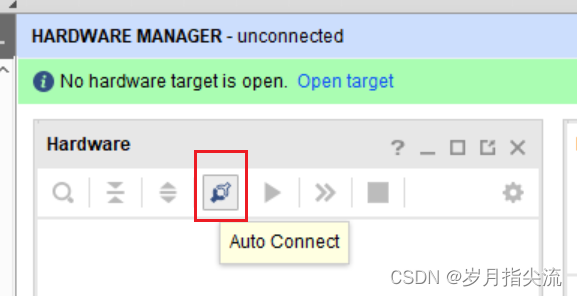
①. Click Open Hardware Manager
②. Click Auto Connect
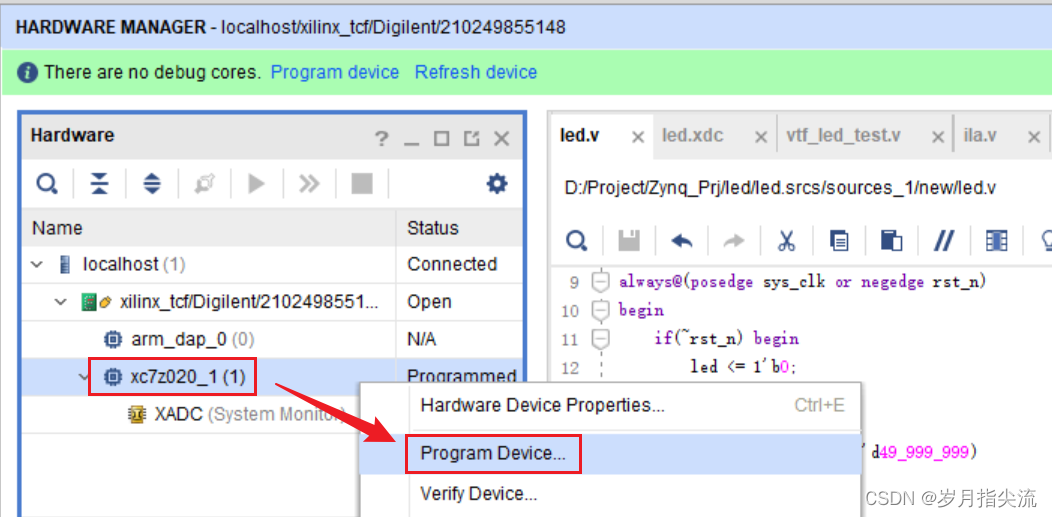
③. Right-click xc7z020_1 -> Program Device
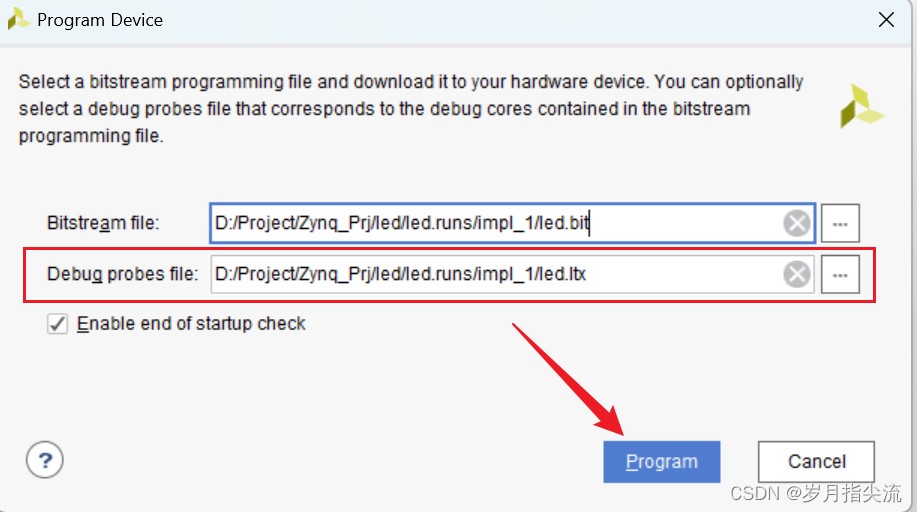
④. You can find that there is an additional led.ltx file here. This is a description file. The content of the description is what signals our logic analyzer and Connect, then click Program
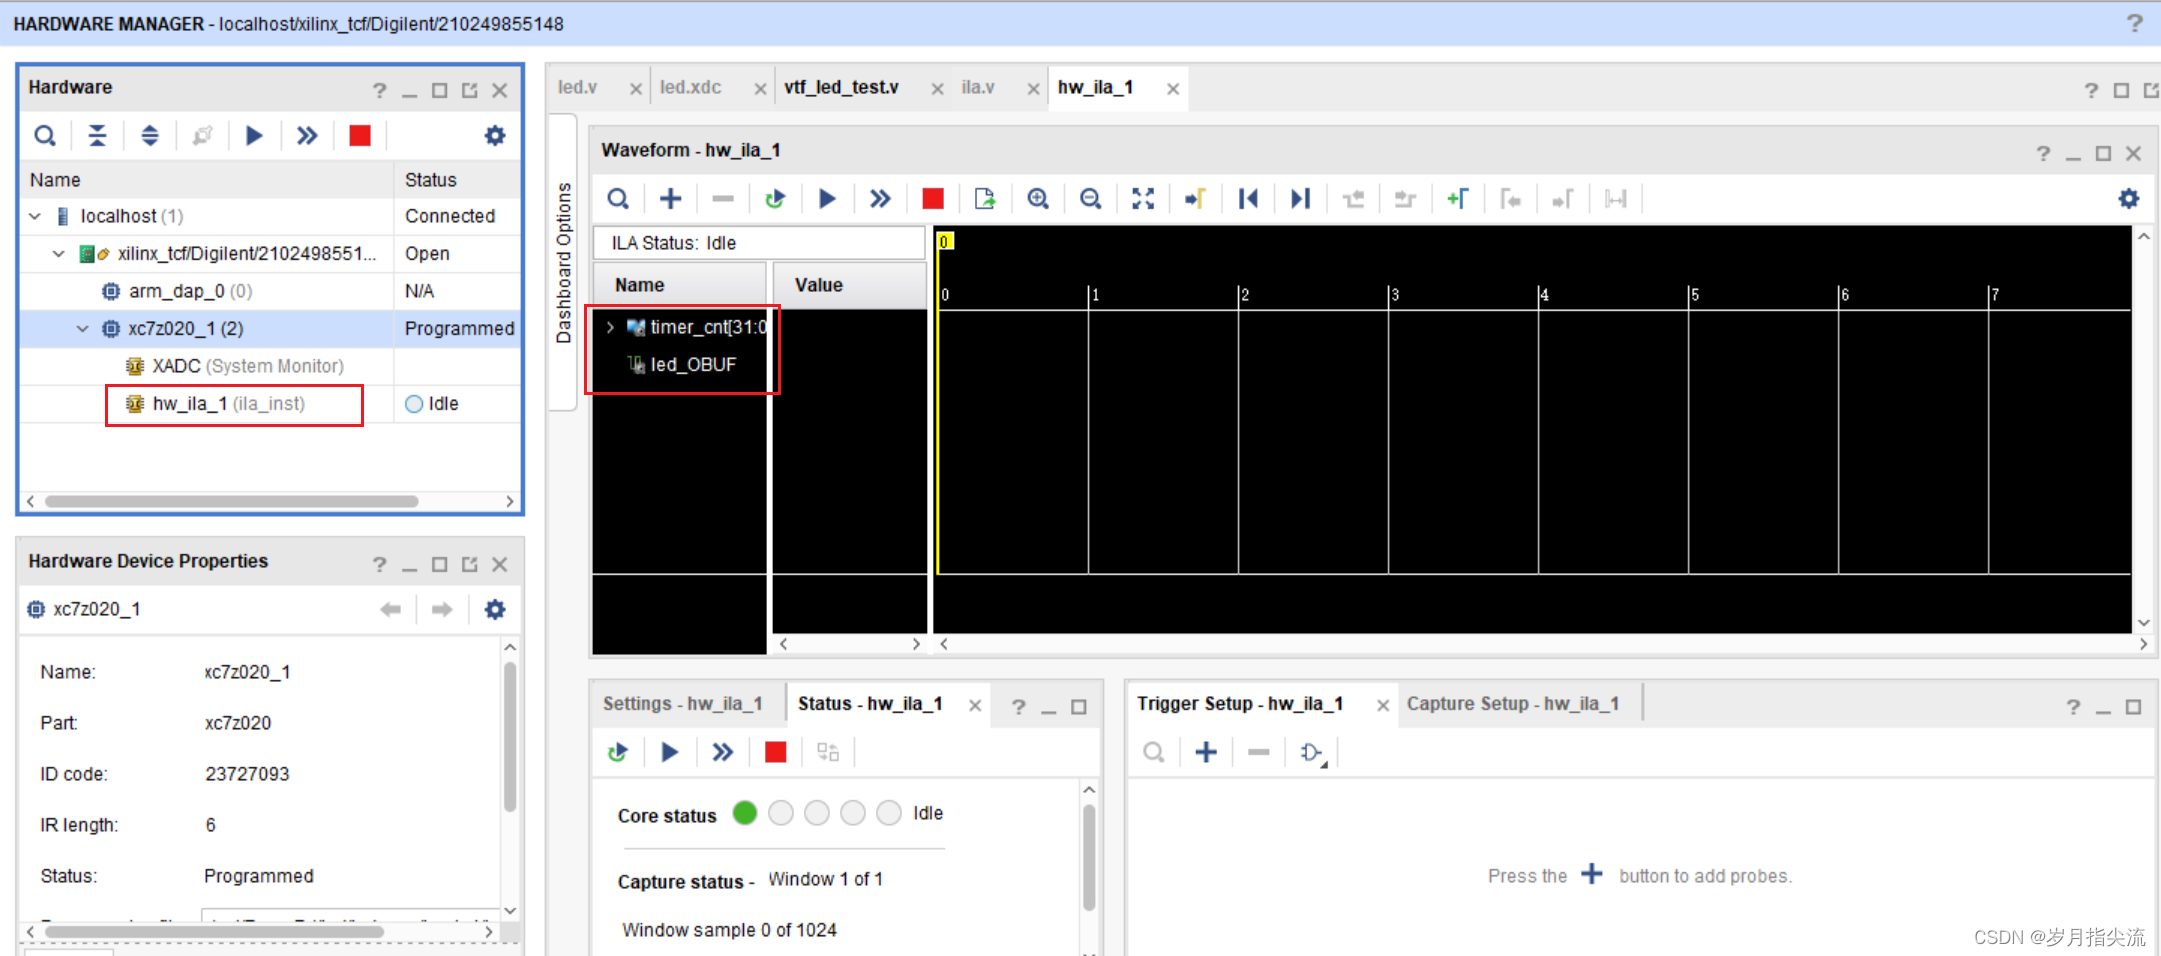
⑤. After clicking Program, you can see an interface like this
5. Carry out online debugging
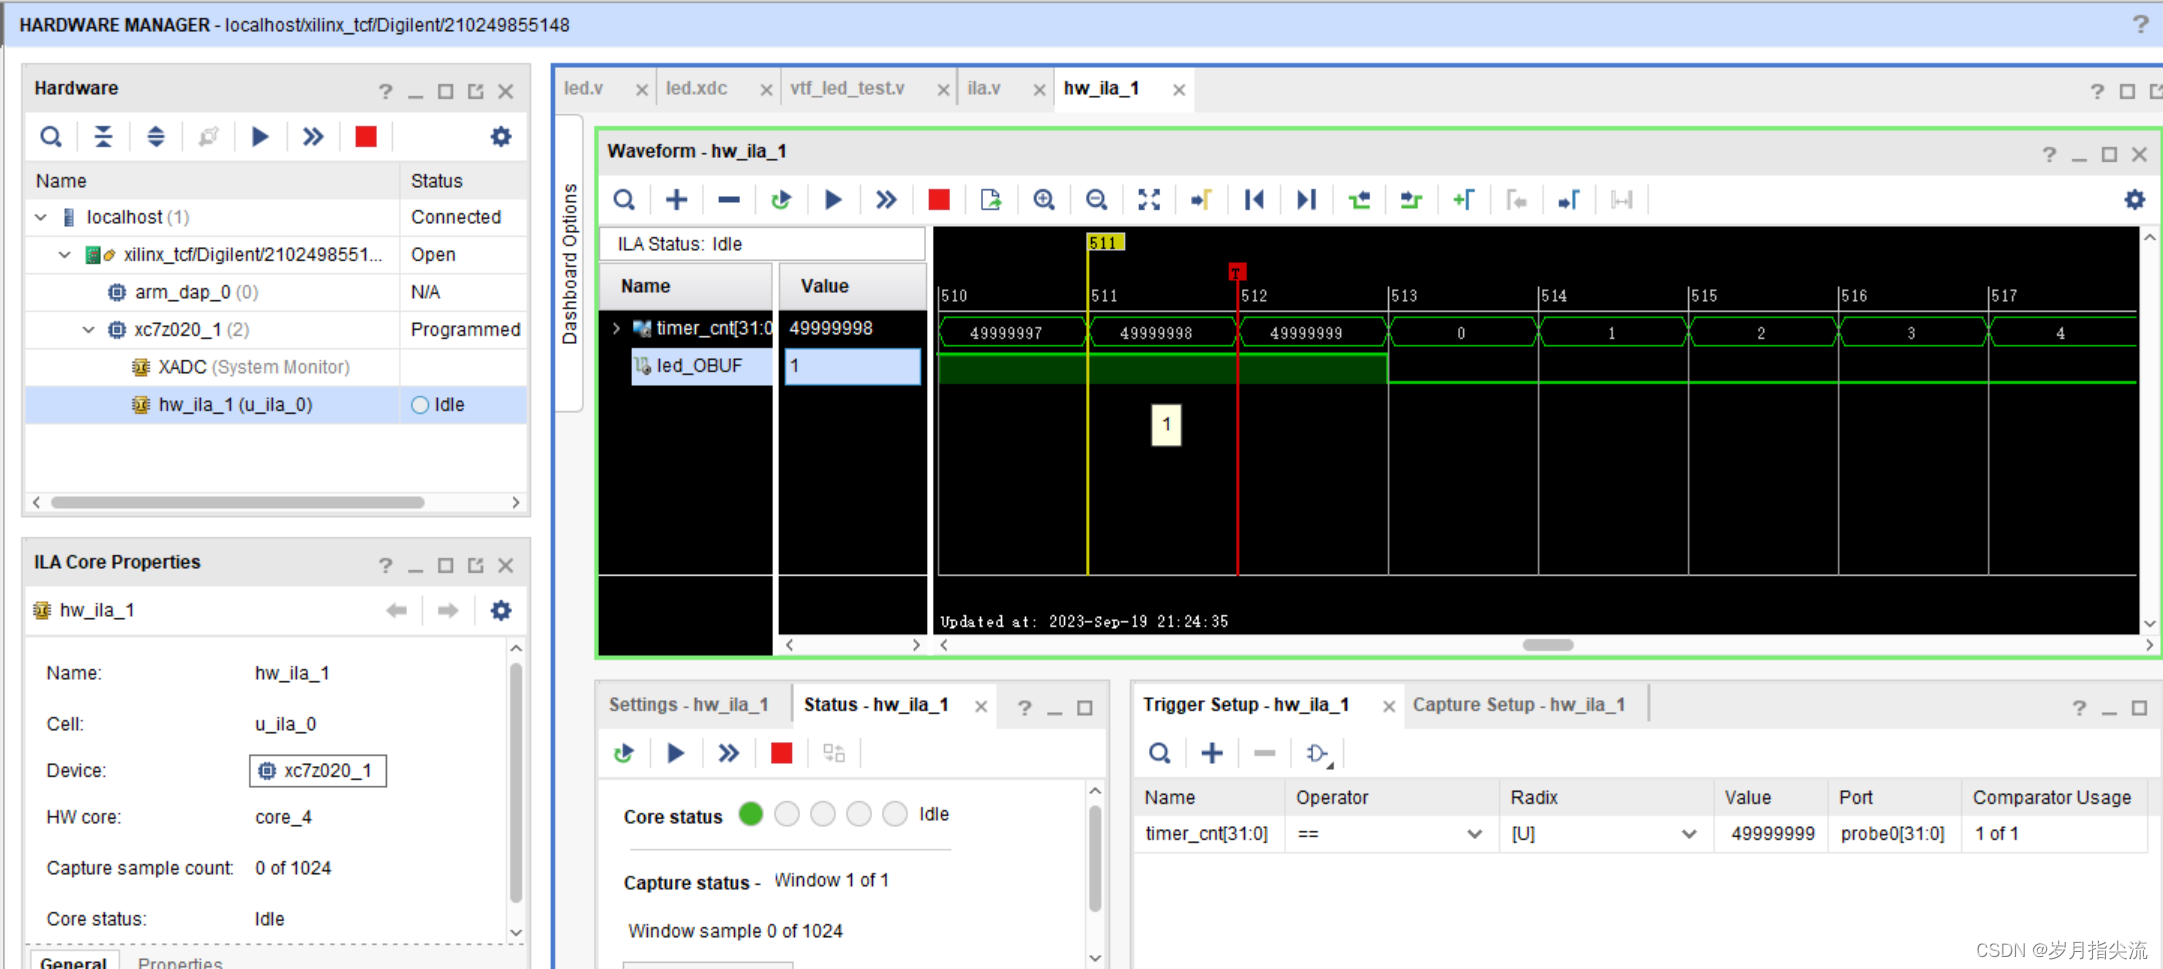
①. Click Run trigger for this ILA core and display the counter in decimal format. Use c+rl + mouse wheel to adjust the interface. You can see the following figure: These data are real data. Different from simulation,
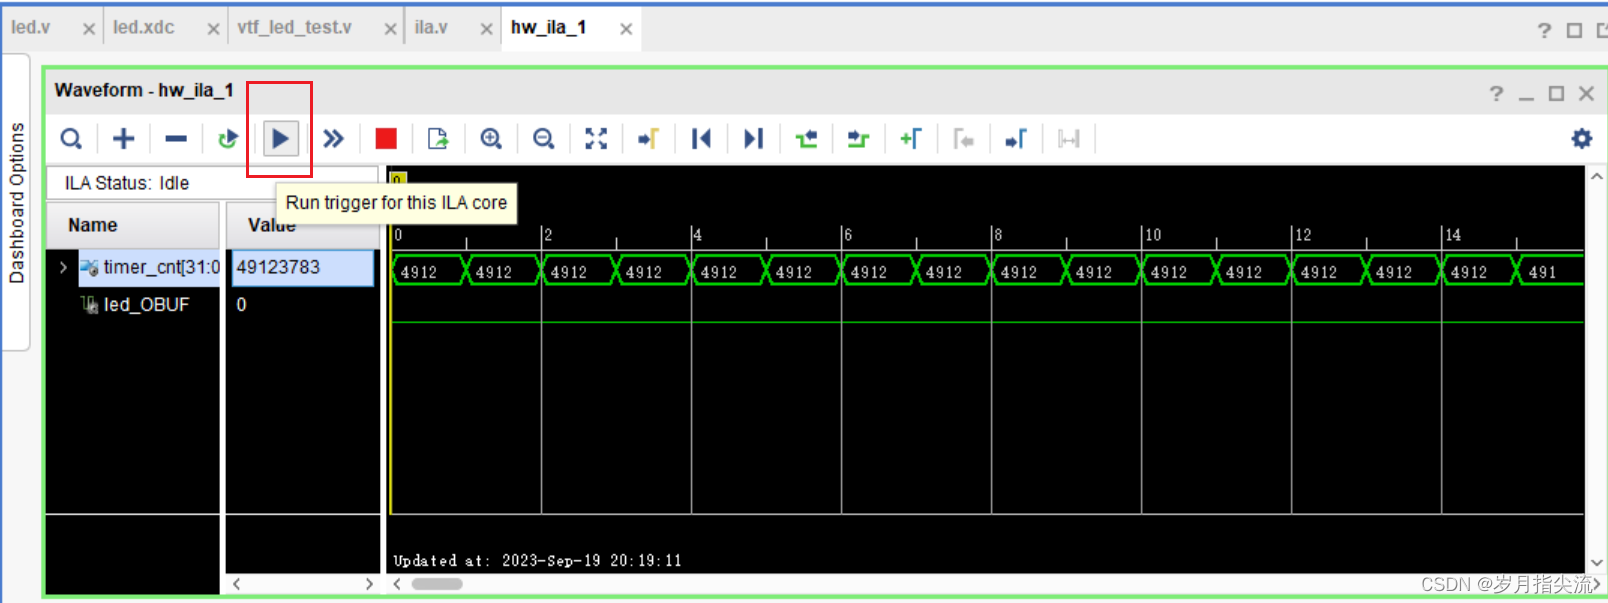
we Currently it is running on the board, and you can see the actual running situation
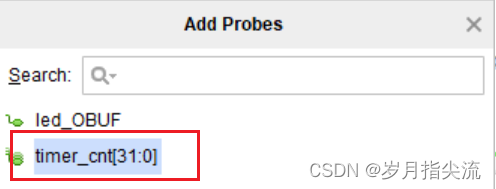
②. Make a trigger Use a
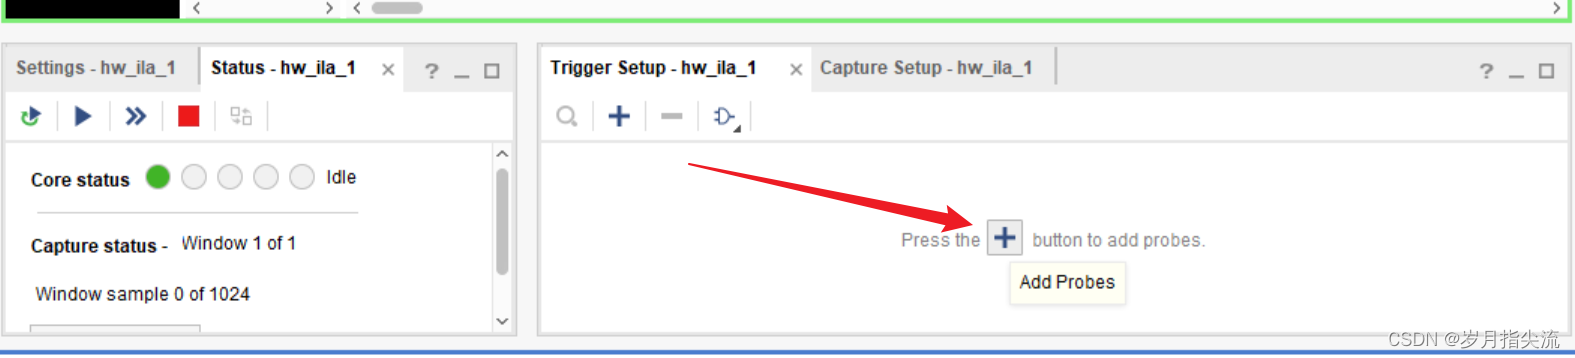
counter to make a trigger
Make a trigger based on the maximum value of the counter
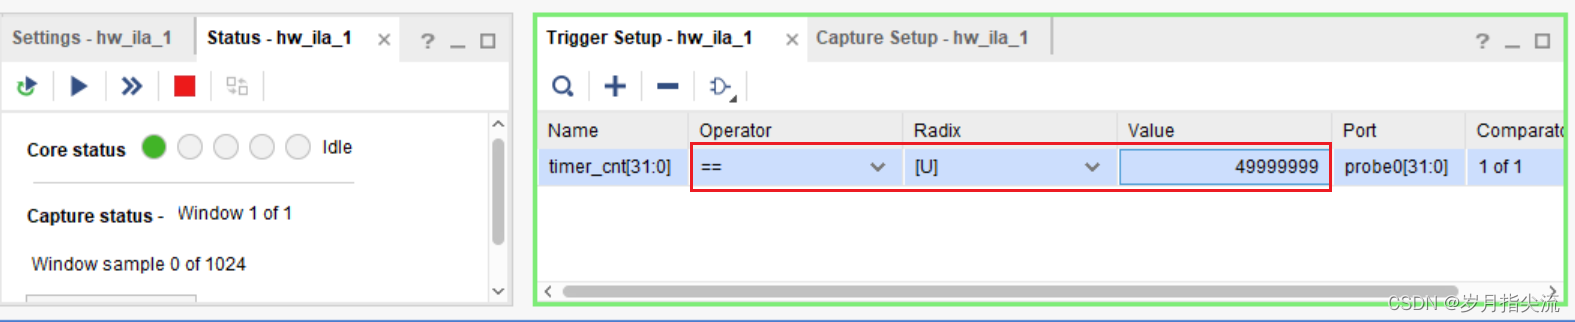
③, and then click Run trigger for this ILA core, you can see the trigger situation, and the LED changes from 0 to 1.
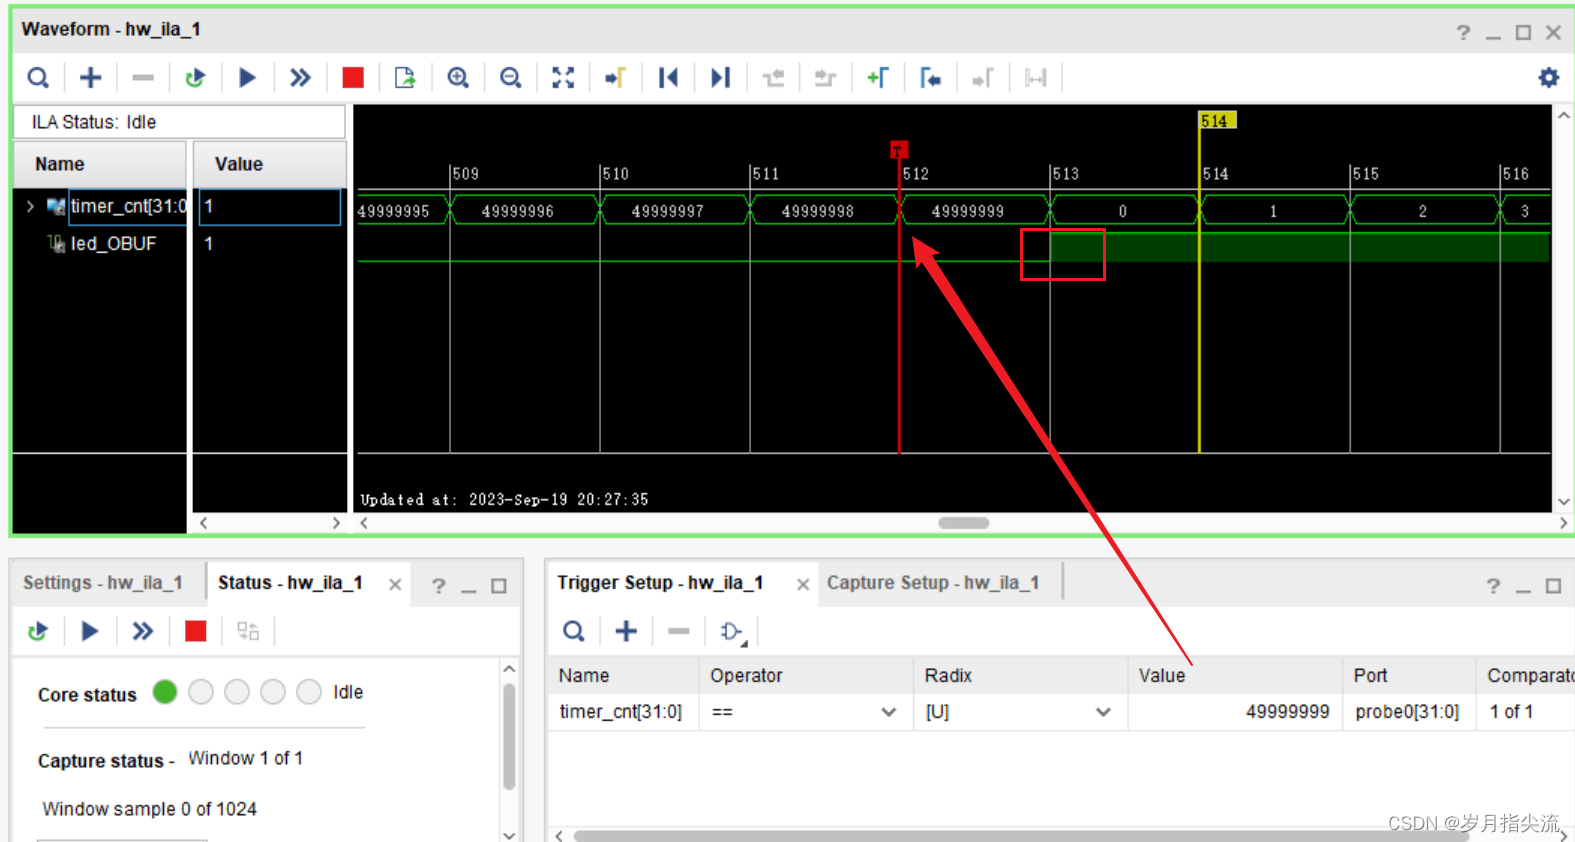
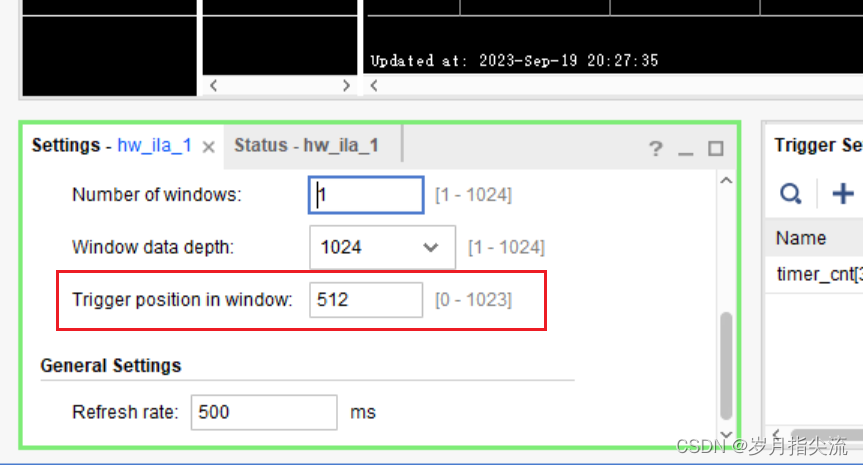
In addition, in order to facilitate us to observe the waveform, when we want to see more data behind Some can adjust the value of Trigger poisition in window a little smaller. If you look at the previous data, you can increase the value of Trigger poisition in window ④. You can also try the loop
trigger mode. First click Toggle auto re-trigger mode for this ILA core and then click Run trigger for this ILA core
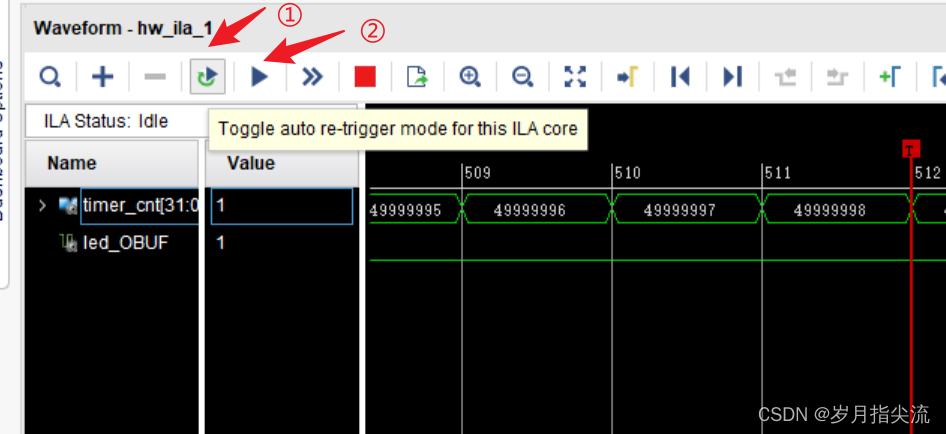
, you can see that loop triggering is performed, and hw_ila_1 on the left shows the status of the logic analyzer, including idle status, waiting for trigger status, and trigger success status.
2. Method 2 - Create ILA using Debug tag
1. Debug mark related signals
①. First, block the ila instantiation code added in the above led.v.
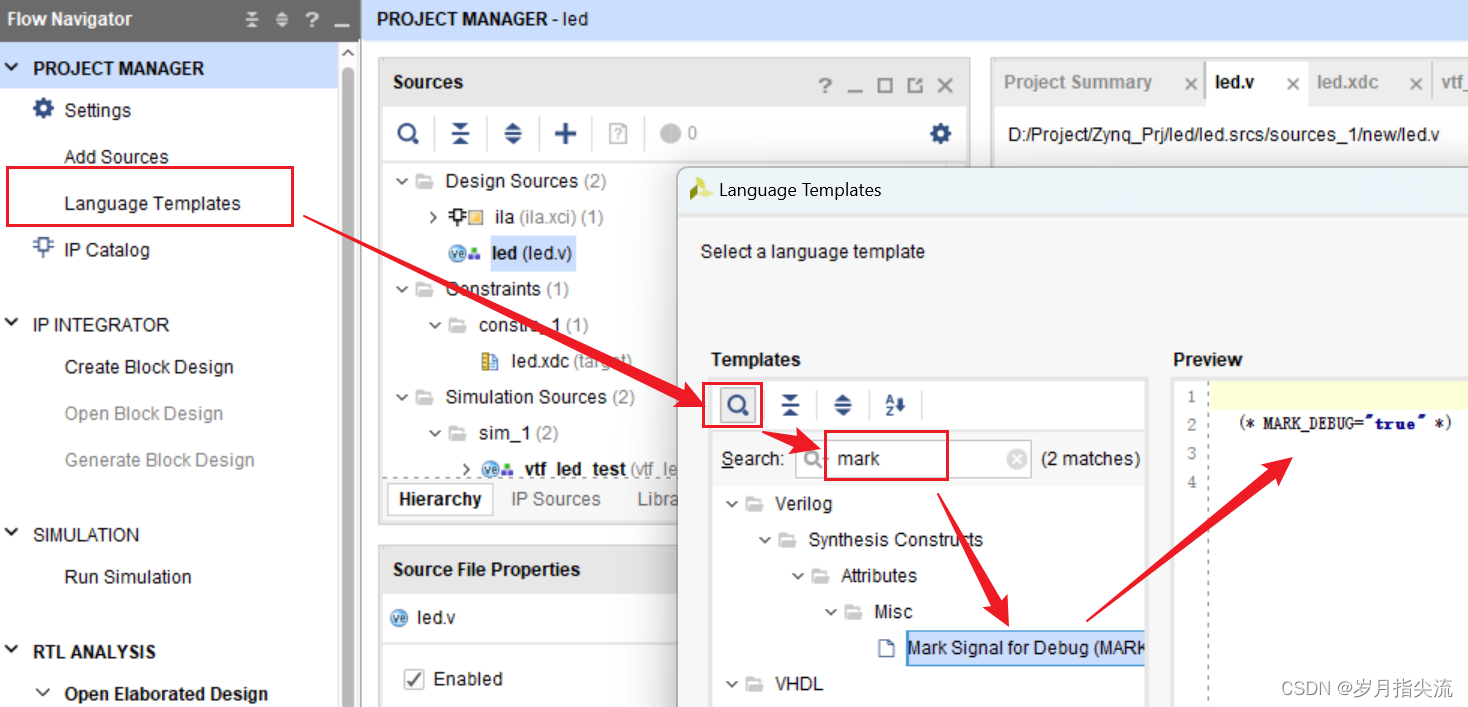
②. Click Language Templates, click Search in the pop-up window, enter mark and Mark Signal for Debug (MARK_DEBUG) will appear. Click Mark Signal for Debug (MARK_DEBUG). Copy what is shown in Preview (* MARK_DEBUG="true" *)
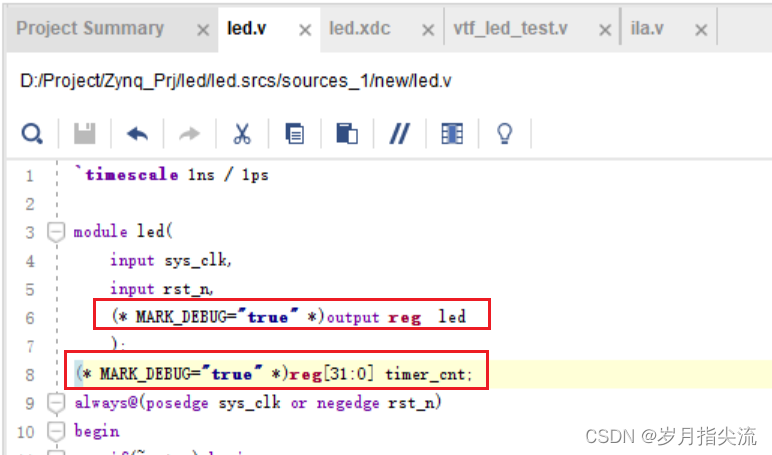
③. Paste it into led.v, paste it as shown below, and save it
2. Comprehensive operation
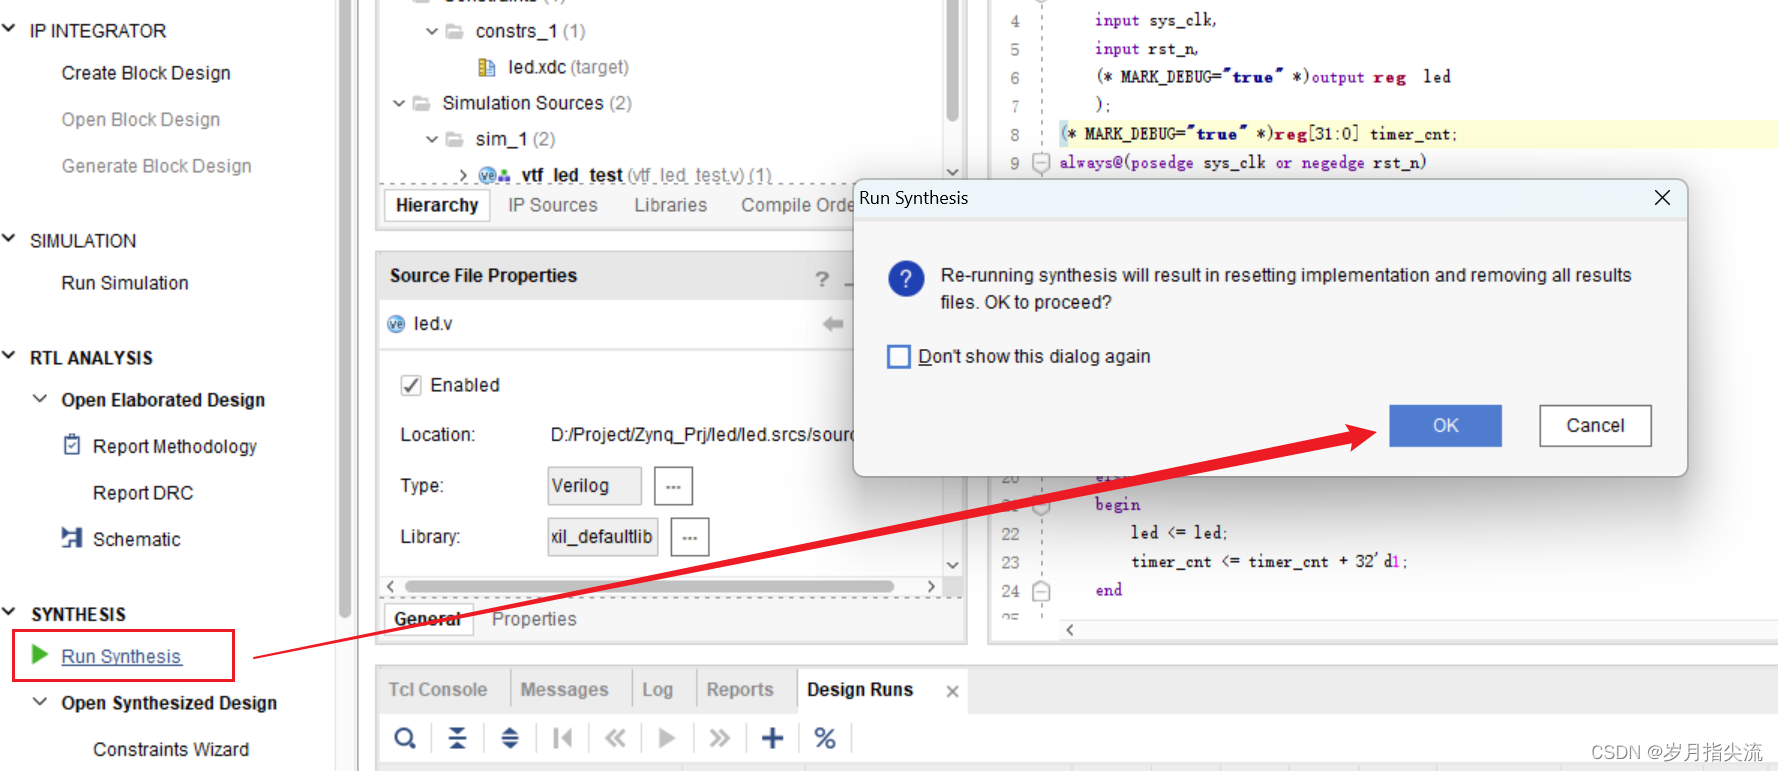
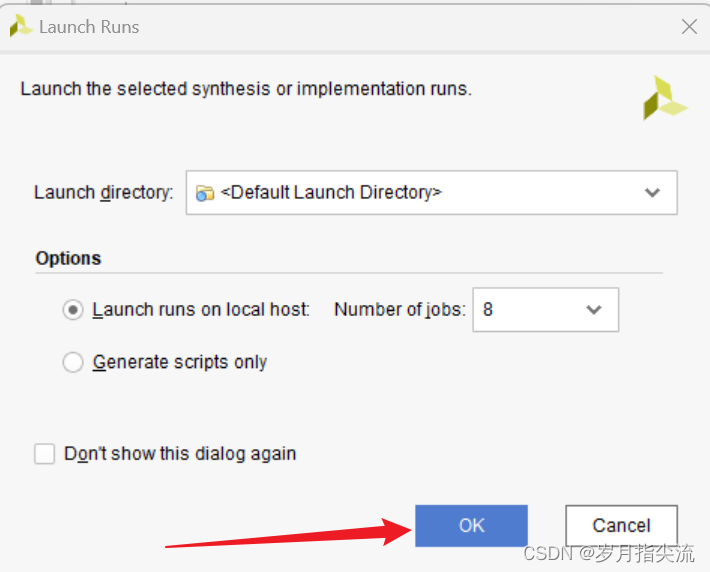
①. Click Run Synthesis, and click OK in the pop-up window.
②. Click "OK"
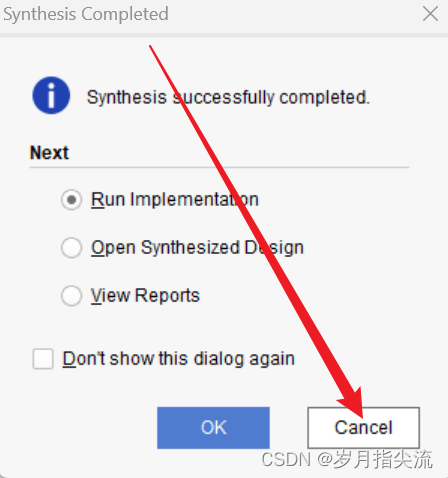
③. When the synthesis is completed, click Cancel
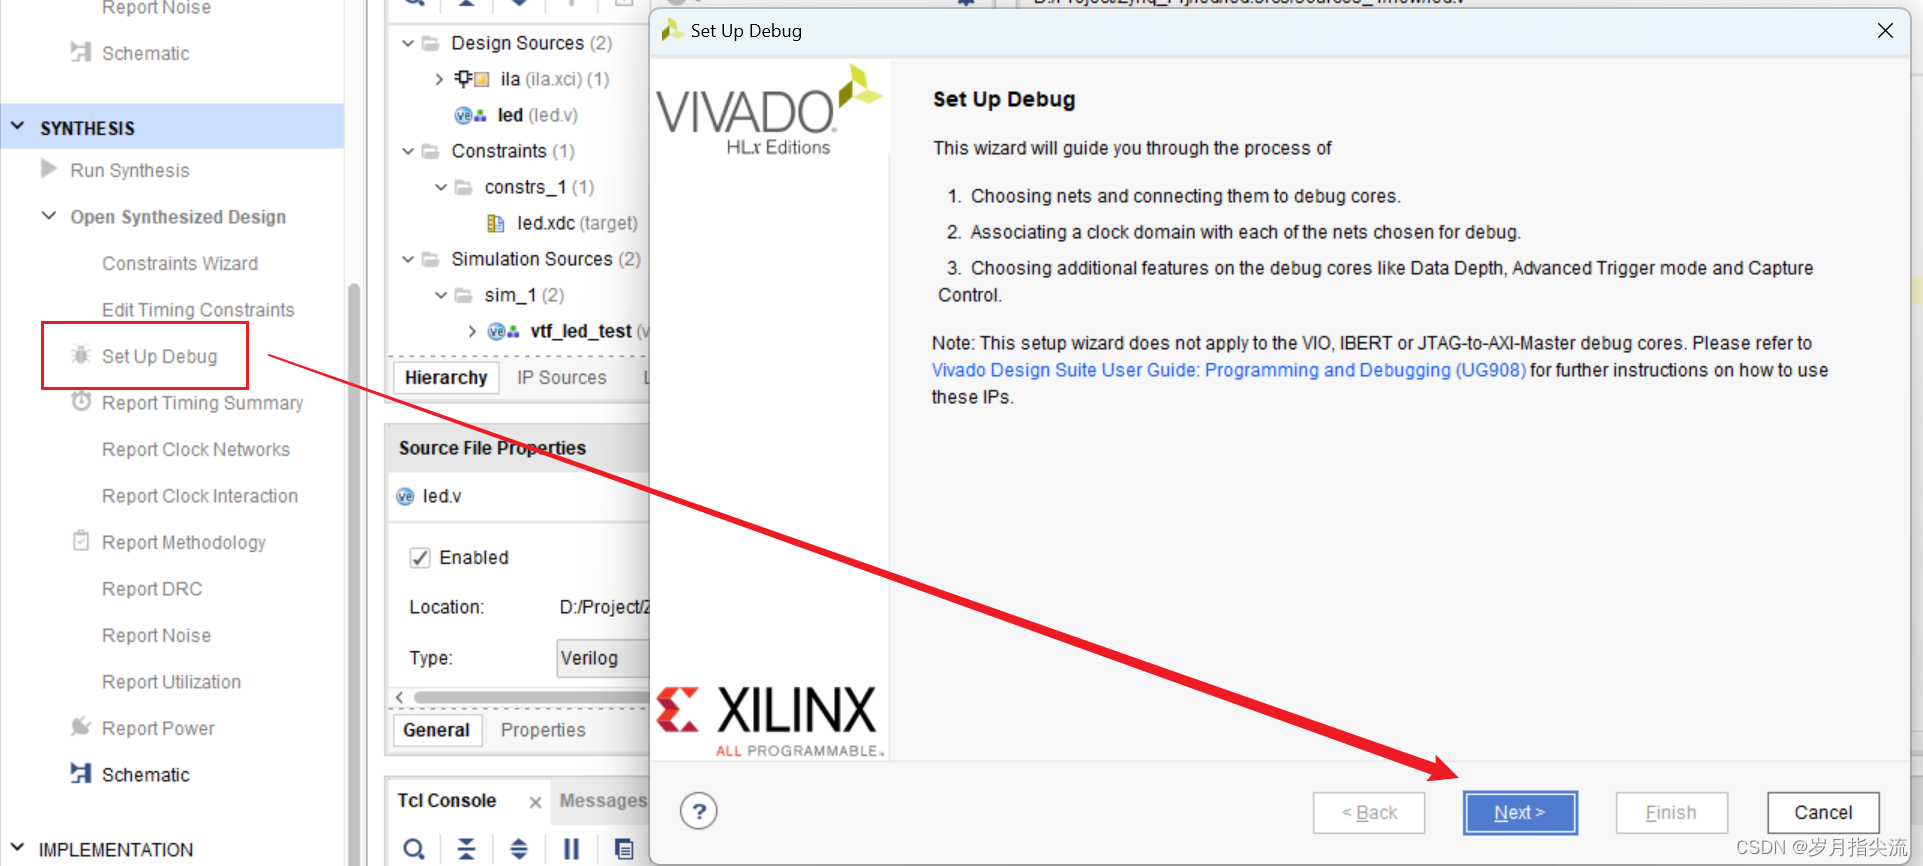
3. Set Up Debug
①. Click Set Up Debug, and select Next in the pop-up window.
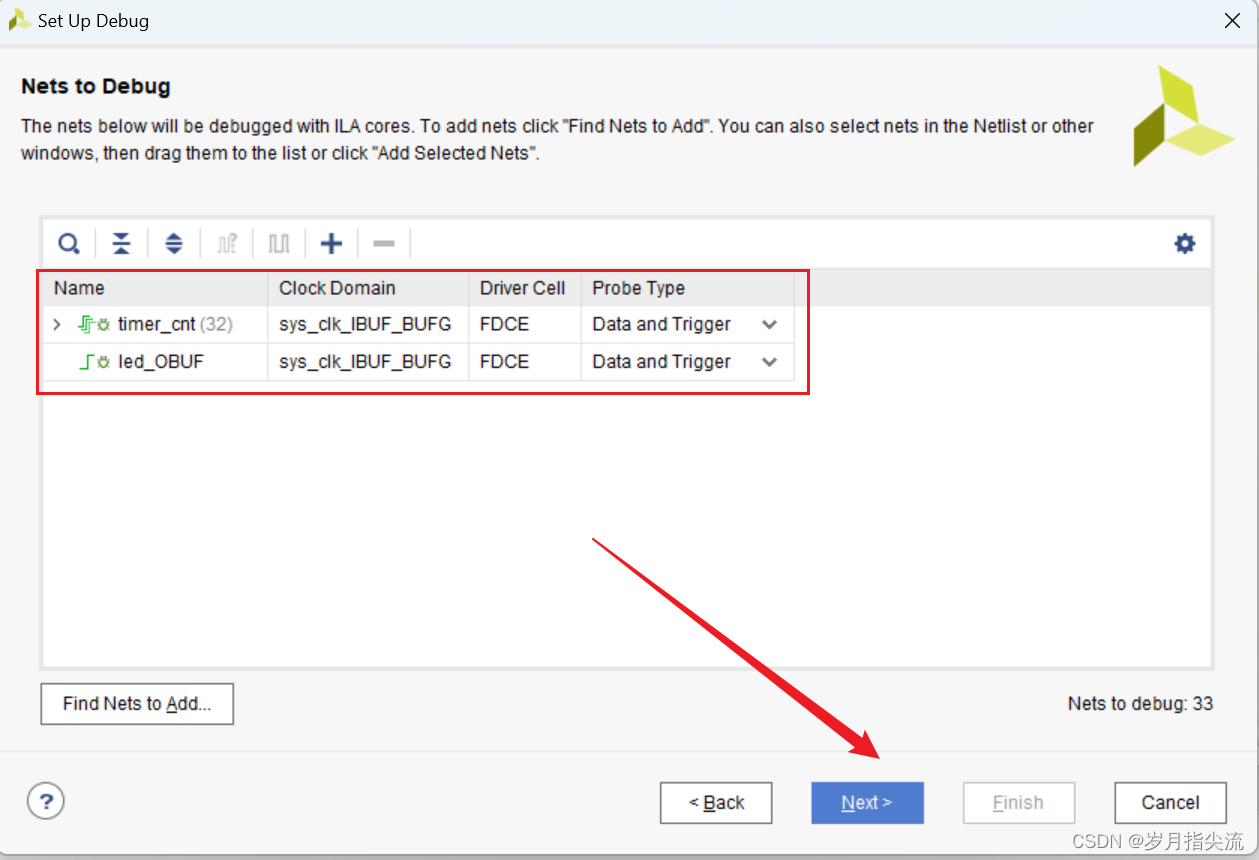
②. Here we can see the debugging information added in our source file, and then click Next. ③
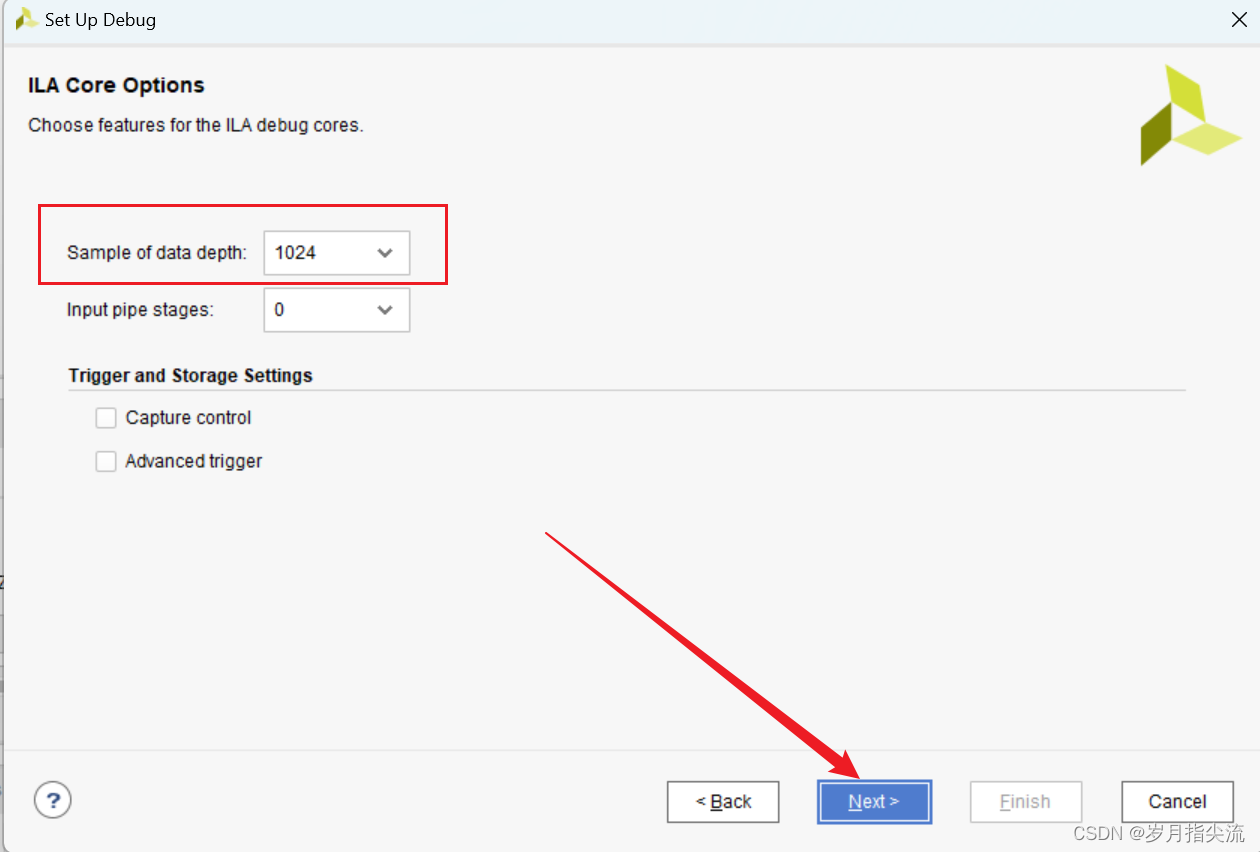
. The following is also to set the sampling data depth. We keep the default and click Next
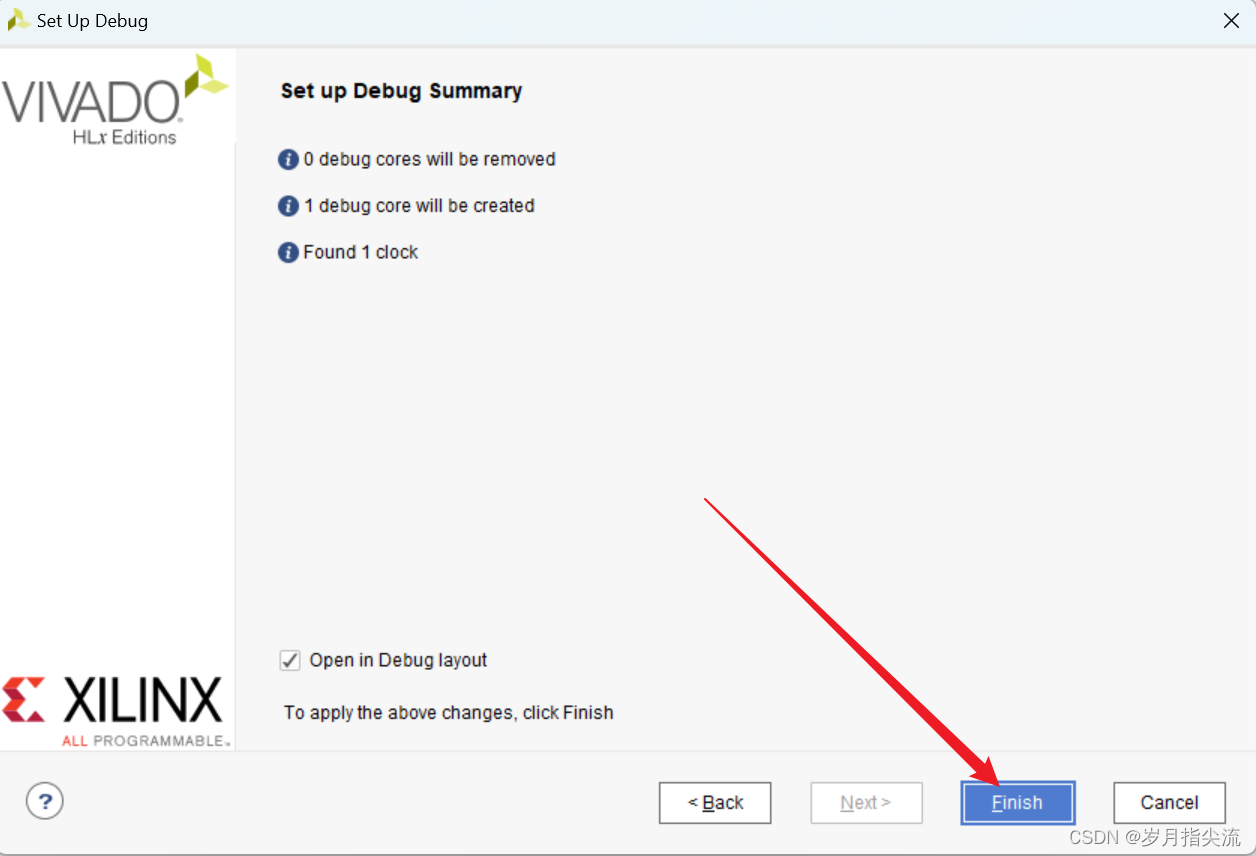
④ , click Finish
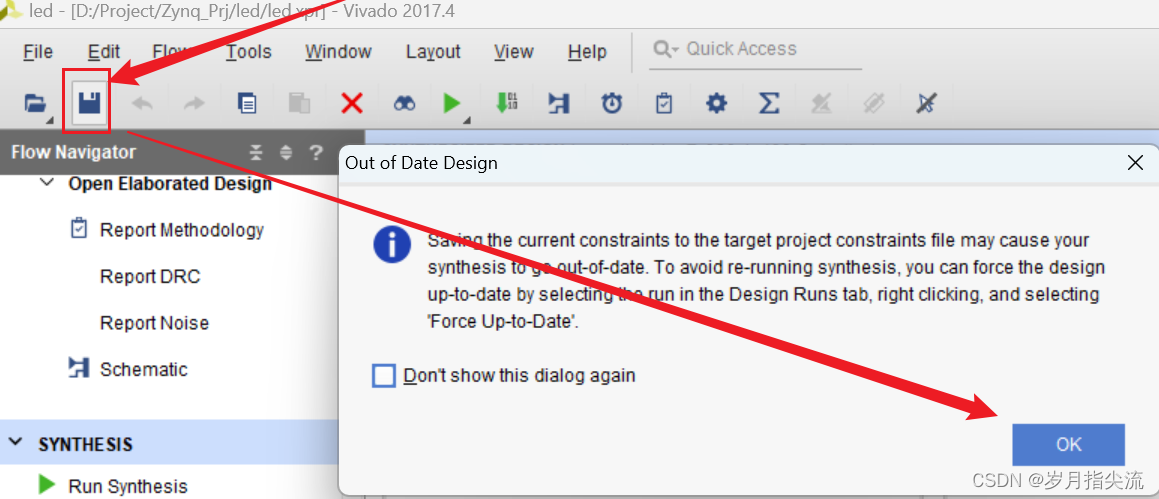
⑤, save the settings, click OK in the pop-up window
⑥, let's take a look at the
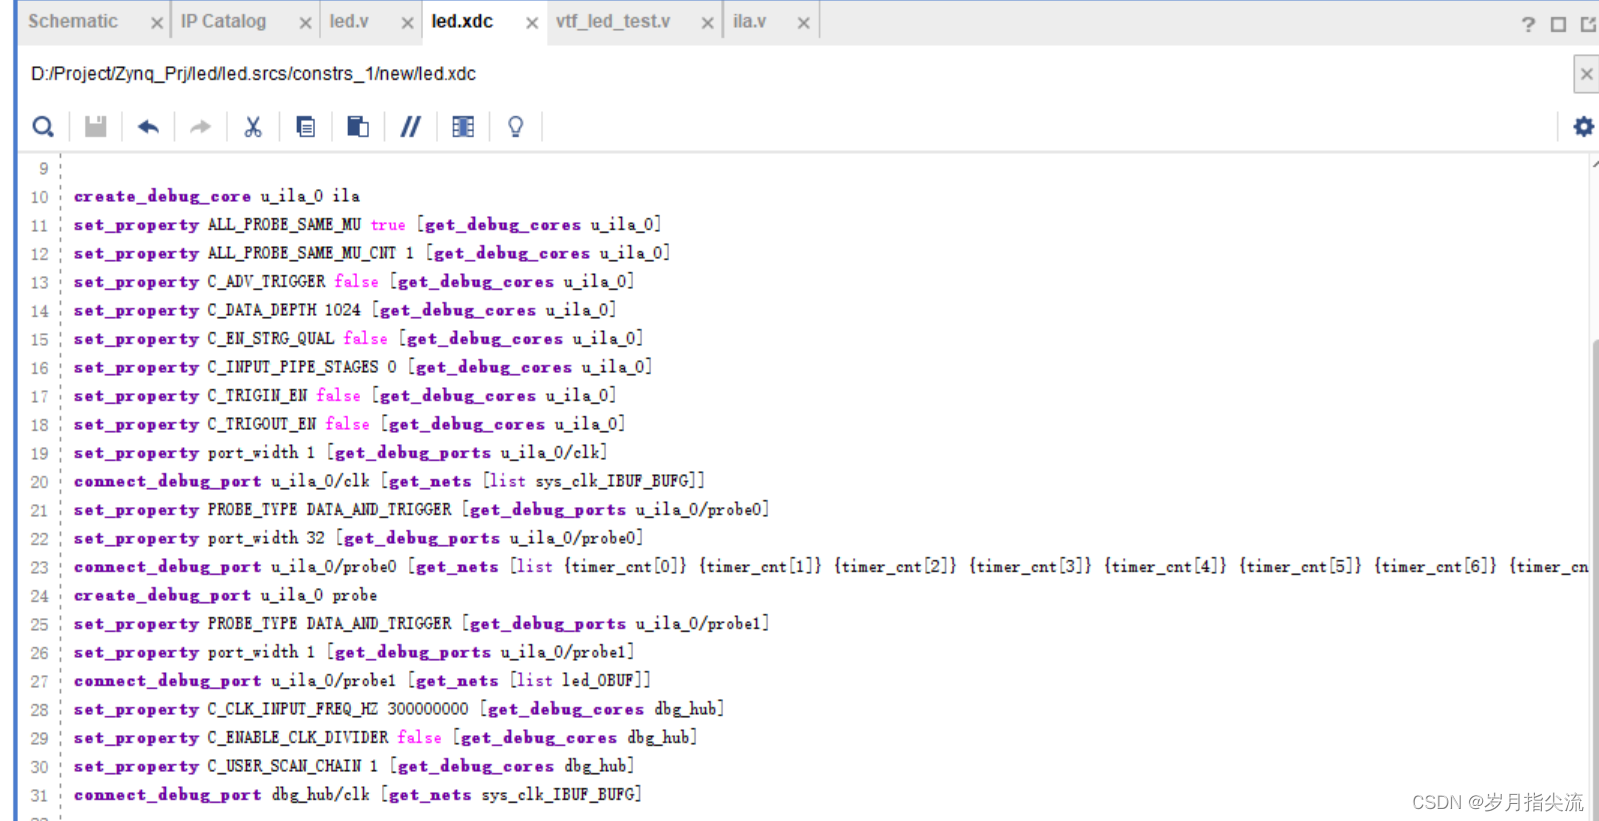
led. Some of the signals inside are connected together.
4. Generate bit file
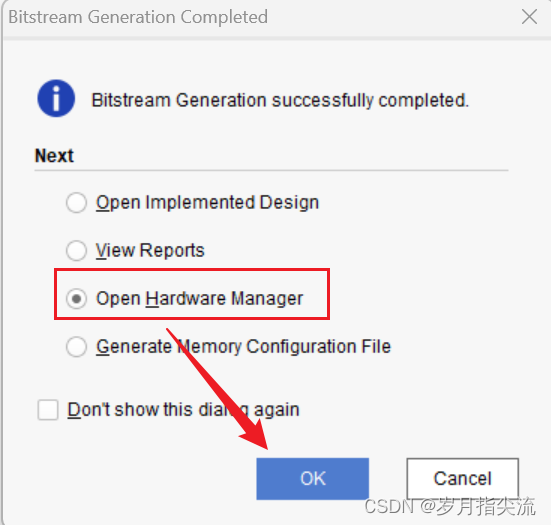
①. Click Generate Bitstream and click Yes in the pop-up window.

②. Select Open Hardware Manager and click OK.
5. Download program
Same as the first method
6. Carry out online debugging
Same as the first method, the operation and interface are exactly the same
3. Obtain resources by yourself
LED project based on vivado 2017.04 version
My qq: 2442391036, welcome to communicate!