Debugging ability is the basis for a programmer's survival, but many beginners ignore debugging. Today we will discuss JS debugging skills. This article will list in detail various practical debugging skills related to JS.
If you are a beginner to JS, this article will be of great help to you. Why debug? A program is a collection of functions, and the running of the program is the execution process of the functions. Through JS debugging, we can more intuitively track the execution order of functions and changes in each parameter during program running. This way we can quickly locate the problem.
- What is JS debugging? When the program is running, we will always encounter various bugs, and the process of locating the problem by tracking the running sequence of the code is called JS debugging.
First we need to know how to enter the debugging interface. Here we take Google as an example. Through F12 and right-click inspection, you can enter the debugging interface by finding Sources. The specific interface is shown as follows:
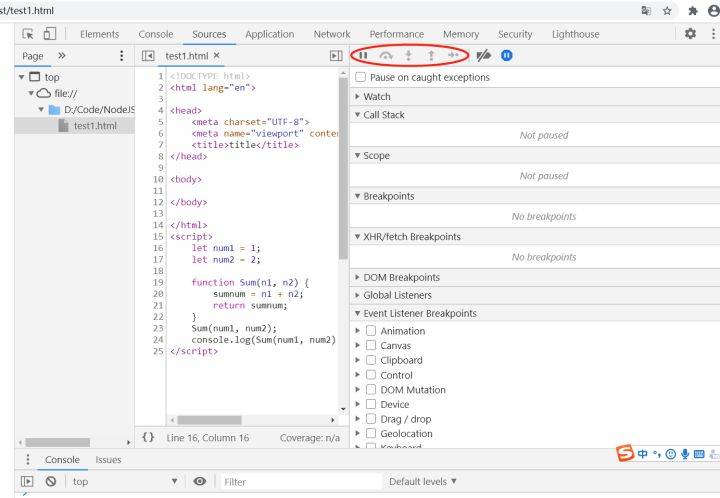
The red box marks the keys we commonly use for debugging. Below we will describe the function of each button in detail in actual application scenarios.
- Single-step debugging is first of all ordinary debugging, also called single-step debugging. After F12 finds Sources, find the file you want to run in the folder on the left, then click the pause script execution button and refresh the page (F5) to enter single-step debugging

Clicking Step over next function call means debugging the program step by step. Each time you click, a line of code will be executed downwards in the order of code execution.

- If you have tried single-step debugging in function debugging, you will find that single-step debugging cannot actually meet our need to find bugs, because single-step debugging cannot enter the function body, and we cannot track changes in variables within the function body. So let’s learn about the third button next, the step into next function call button

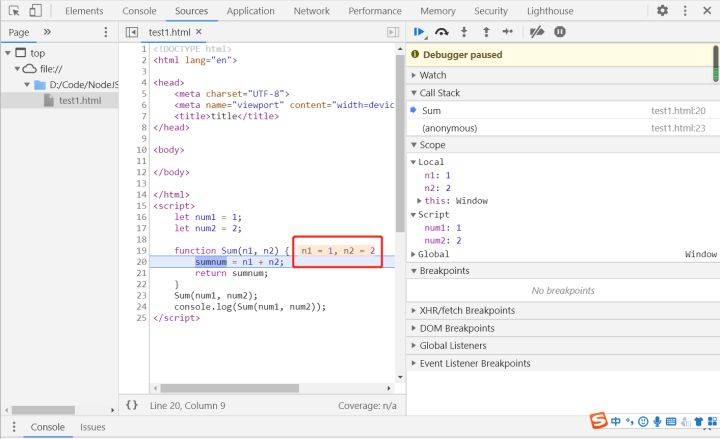
Using the Step into button, we can enter the function body. During single-step debugging, when the function is called, click Step into to enter the function body.

After entering the function body, continue to click the Step over button to perform single-step debugging within the function body. As shown in the figure, the changes in variables within the function body are clear at a glance.
But when we have tracked the desired variable changes, there is a lot of content in the function body, and it is a waste of time to single-step debugging until the end of the function. Here you can use the fourth button we learned today, step out of current function call to jump out of the current function body and jump to the code position where you entered the function body before.

- Breakpoint debugging has a large amount of code in actual projects, and using single-step debugging is a waste of time. And sometimes we want to locate whether there is an error in the code in a certain place, so there is no need to debug all the code. So we can use breakpoint debugging, so what is breakpoint debugging?
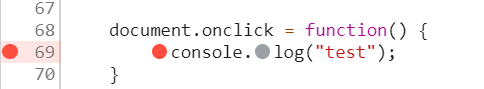
First, at the code where you want to locate the problem, break the point, which is where the code stops executing. Click on the red box as shown in the picture to hit a breakpoint on that line. (The breakpoint icon is slightly different due to different Google versions)
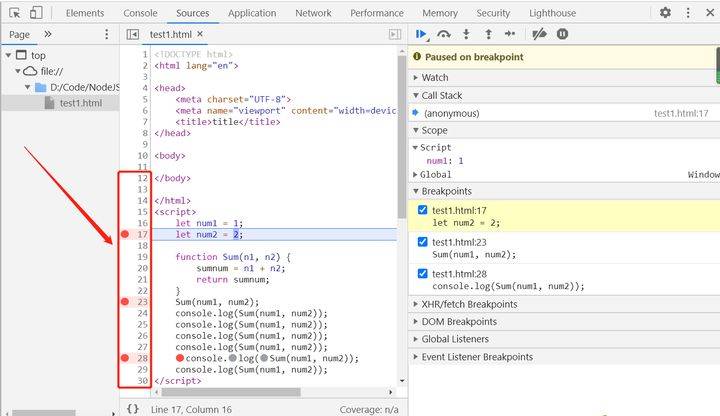
Then refresh the page (F5) to enter the breakpoint debugging page. Click the Resume script execution button to adjust to the next breakpoint. (Note: When the breakpoint is adjusted, this line of code has a blue background, indicating that this line of code is about to be executed but has not been executed)

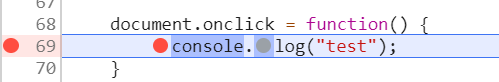
- Event debugging first of all we need to clarify the concept of synchronization and asynchronousness. When the code is executed, the synchronous code that runs from top to bottom is the synchronous code, and one type of asynchronous code requires events to trigger. Therefore, in code debugging, the function in the event body needs to pass the behavior of the event after the break point to enter the function body. For example, the following code: Refreshing after the break point actually has no effect.
The event must be touched to trigger debugging