Pandas window function rolling and expanding
1. rolling mobile window
rolling() is a moving window function that can be used with aggregate functions such as mean, count, sum, median, std, etc. For ease of use, Pandas defines special method aggregation methods for moving functions, such as rolling_mean(), rolling_count(), rolling_sum(), etc.
Its syntax format is as follows:
rolling(window, min_periods=None, center=False, win_type=None, on=None, axis=0, closed=None)
(1) Parameters:
- window: Indicates the size of the time window, and has two forms:
1) Use the value int to indicate the number of observations, that is, the number of data forward;
2) You can also use the offset type, which is more complicated and uses more scenarios Less, no introduction here; - min_periods: The minimum number of observations contained in each window, and the result of the window smaller than this value is NA. Value can be int, default None. In the case of offset, the default is 1;
- center: set the label of the window to center, Boolean, default False, right
- win_type: The type of window. Various functions for intercepting windows. String type, default is None;
- on: optional parameter. For a dataframe, specifies the columns over which to calculate the tumbling window. The value is the column name.
- axis: The default is 0, that is, calculate the column
- closed: defines the opening and closing of the interval, and supports int type window. For the offset type, the default is left open and right closed, that is, the default is right. It can be specified as left, both, etc. according to the situation.
(2) Use case:
# -*- coding: utf-8 -*-
import pandas as pd
import numpy as np

seed = 8
s = pd.Series(range(seed), index=pd.date_range('2023-01-01', periods=seed, freq='1D'))
print(s)

print(s.rolling(window=3).sum())
print(s.rolling(window=3, min_periods=1).sum())
print(s.rolling(window='3D').sum())
The result is as follows:
2023-01-01    0
2023-01-02    1
2023-01-03    2
2023-01-04    3
2023-01-05    4
2023-01-06    5
2023-01-07    6
2023-01-08    7
Freq: D, dtype: int64
2023-01-01     NaN
2023-01-02     NaN
2023-01-03     3.0
2023-01-04     6.0
2023-01-05     9.0
2023-01-06    12.0
2023-01-07    15.0
2023-01-08    18.0
Freq: D, dtype: float64
2023-01-01     0.0
2023-01-02     1.0
2023-01-03     3.0
2023-01-04     6.0
2023-01-05     9.0
2023-01-06    12.0
2023-01-07    15.0
2023-01-08    18.0
Freq: D, dtype: float64
2023-01-01     0.0
2023-01-02     1.0
2023-01-03     3.0
2023-01-04     6.0
2023-01-05     9.0
2023-01-06    12.0
2023-01-07    15.0
2023-01-08    18.0
Freq: D, dtype: float64
print(s.rolling(window=3).sum())
window width is 3, there is no data for two days before January 1st, it is a null value, so the results on the 1st and 2nd are NaN
2023-01-01     NaN
2023-01-02     NaN
2023-01-03     3.0
print(s.rolling(window=3, min_periods=1).sum())
In order to solve the above problem, use min_periods, if there is no data, the minimum window is 1, so there are data on the 1st and 2nd.
2023-01-01     0.0
2023-01-02     1.0
2023-01-03     3.0
print(s.rolling(window='3D').sum())
The index is the date, and the index date is 3 days as the window width, which has the same effect as using the min_periods=1 parameter.
(3) Usage expansion
In addition to sum(), the rolling() function also supports many functions, such as:
count() the number of non-null observations
mean() the average value of values
median() the arithmetic median of values
min() minimum value
max() maximum
std( ) Bessel corrected sample standard deviation
var() unbiased variance
skew() sample skewness (third moment)
kurt() sample kurtosis (fourth moment)
quantile() sample quantile (percentile value)
cov() unbiased covariance (binary)
corr() correlation (binary)
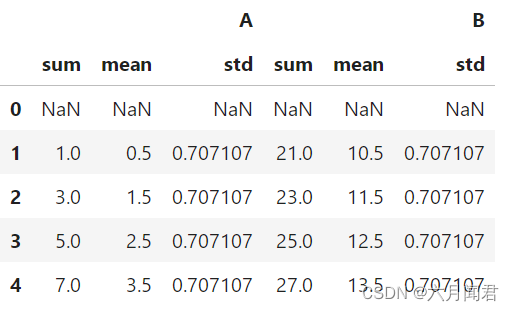
Can also be used with the agg aggregate function
df = pd.DataFrame({"A": range(5), "B": range(10, 15)})

df.rolling(window=2).agg([np.sum, np.mean, np.std])
The result is as follows:
2, expanding extended window function
expanding() expands the window function. Expansion refers to starting from the first element of the sequence and calculating the aggregate value of the elements backward one by one.
(1) Parameters:
The parameters of the expanding() function are used in the same way as the parameters of the rolling() function; there is no window parameter . The window size is not fixed, and the cumulative calculation is realized, that is, continuous expansion.
The rolling() function is a fixed window size for sliding calculations, and the expanding() function only sets the minimum number of observations.
The expanding() function, similar to the cumulative summation of the cumsum() function, has the advantage that more clustering calculations can be performed;
(2) Use case:
seed =21
df = pd.DataFrame({'a':np.random.randint(20,500,seed),'b':np.random.randint(20,100,seed)}, index=pd.date_range('2020-01-01', periods=seed, freq='1D'))
df.index.name='testdate'

print(df)
print(df.expanding(min_periods=7).max())
print(df.expanding(min_periods=7).min())
The minimum window is 7 days, so the maximum and minimum values, 1st to 6th, are all NaN.
The window is continuously extended from 7 days to all dataframe records.
column a:
2020-01-01 492,
until the last day, exceeding the maximum value of the first day, and the max value changed to
2020-01-21 499.0
The same is true for the maximum value of column b.
The result is as follows:
              a   b
testdate
2020-01-01  492  80
2020-01-02  399  73
2020-01-03  309  58
2020-01-04   66  38
2020-01-05  318  20
2020-01-06  488  29
2020-01-07  328  33
2020-01-08  347  25
2020-01-09  240  47
2020-01-10   80  71
2020-01-11  265  54
2020-01-12   33  65
2020-01-13  396  61
2020-01-14   71  54
2020-01-15   39  49
2020-01-16  189  48
2020-01-17   79  67
2020-01-18  303  62
2020-01-19  482  98
2020-01-20  208  27
2020-01-21  499  43
                a     b
testdate
2020-01-01    NaN   NaN
2020-01-02    NaN   NaN
2020-01-03    NaN   NaN
2020-01-04    NaN   NaN
2020-01-05    NaN   NaN
2020-01-06    NaN   NaN
2020-01-07  492.0  80.0
2020-01-08  492.0  80.0
2020-01-09  492.0  80.0
2020-01-10  492.0  80.0
2020-01-11  492.0  80.0
2020-01-12  492.0  80.0
2020-01-13  492.0  80.0
2020-01-14  492.0  80.0
2020-01-15  492.0  80.0
2020-01-16  492.0  80.0
2020-01-17  492.0  80.0
2020-01-18  492.0  80.0
2020-01-19  492.0  98.0
2020-01-20  492.0  98.0
2020-01-21  499.0  98.0
               a     b
testdate
2020-01-01   NaN   NaN
2020-01-02   NaN   NaN
2020-01-03   NaN   NaN
2020-01-04   NaN   NaN
2020-01-05   NaN   NaN
2020-01-06   NaN   NaN
2020-01-07  66.0  20.0
2020-01-08  66.0  20.0
2020-01-09  66.0  20.0
2020-01-10  66.0  20.0
2020-01-11  66.0  20.0
2020-01-12  33.0  20.0
2020-01-13  33.0  20.0
2020-01-14  33.0  20.0
2020-01-15  33.0  20.0
2020-01-16  33.0  20.0
2020-01-17  33.0  20.0
2020-01-18  33.0  20.0
2020-01-19  33.0  20.0
2020-01-20  33.0  20.0
2020-01-21  33.0  20.0
(3) Usage expansion:
df = pd.DataFrame(
    np.random.rand(6, 4),
    index=pd.date_range("2022-01-01", periods=6),
    columns=["A", "B", "C", "D"],
)
print(df)
print (df.expanding(min_periods=3).mean())

print('mini window 3 mean result:')
print(df.iloc[0:3].mean())

print('last mean result')
print(df['A'].mean(),df['B'].mean(),df['C'].mean(),df['D'].mean())
The average value of 3 days, equivalent to df.iloc[0:3].mean().
6-day mean, with df['A'].mean(), df['B'].mean(), df['C'].mean(), df['D'].mean() Equivalent, or df.mean() equivalent.
The result is as follows:
                   A         B         C         D
2022-01-01  0.697834  0.100287  0.652869  0.207896
2022-01-02  0.495769  0.010228  0.033768  0.311194
2022-01-03  0.404906  0.814433  0.447700  0.369165
2022-01-04  0.148014  0.980413  0.869525  0.760739
2022-01-05  0.925820  0.322119  0.363028  0.927978
2022-01-06  0.988882  0.997867  0.419070  0.276822
                   A         B         C         D
2022-01-01       NaN       NaN       NaN       NaN
2022-01-02       NaN       NaN       NaN       NaN
2022-01-03  0.532836  0.308316  0.378112  0.296085
2022-01-04  0.436631  0.476340  0.500966  0.412248
2022-01-05  0.534469  0.445496  0.473378  0.515394
2022-01-06  0.610204  0.537558  0.464327  0.475632
mini window 3 mean result:
A    0.532836
B    0.308316
C    0.378112
D    0.296085
dtype: float64
last mean result
0.6102041426142952 0.5375578633503776 0.4643265893696882 0.47563227350705956
Understand the meaning of the extended window again:
it means to calculate the average of at least 3 numbers, the calculation method is
A2=(A0+A1+A2)/3,
A3=(A0+A1+A2+A3)/4
A4=(A0+ A1+A2+A3+A4)/5
A5 A6 and so on.
df = pd.DataFrame({'a':range(5)})
print(df)
print(df.rolling(window=len(df), min_periods=1).mean())
print(df.expanding(min_periods=1).mean())
When the parameter window=len(df) of the rolling() function, the effect is the same as that of the expanding() function. The result is as follows:
     a
0  0
1  1
2  2
3  3
4  4
     a
0  0.0
1  0.5
2  1.0
3  1.5
4  2.0
     a
0  0.0
1  0.5
2  1.0
3  1.5
4  2.0