- In NumPy and pandas, an axis is an argument that specifies the dimensions of an array or data frame. Understanding axes is key to understanding how to operate in a particular direction in a data structure.
In NumPy, the axes of an array can be thought of as the dimensions of the array. For example, for a two-dimensional array, the first axis (axis=0) represents rows and the second axis (axis=1) represents columns. For a three-dimensional array, the first axis represents height, the second axis represents rows, the third axis represents columns, and so on. Axes correspond to your dimensions
In pandas, the concept of an axis is similar. DataFrame objects have two axes: the row axis (axis=0) and the column axis (axis=1). In a Series object, there is only one axis, the row axis.
Understanding the concept of axes is very important for data manipulation and calculations. Many functions and methods accept an axis parameter when executed, which specifies which direction to operate. For example, to calculate the sum, average, maximum, etc. of an array, you can perform operations along a specific dimension by specifying the axis parameter .
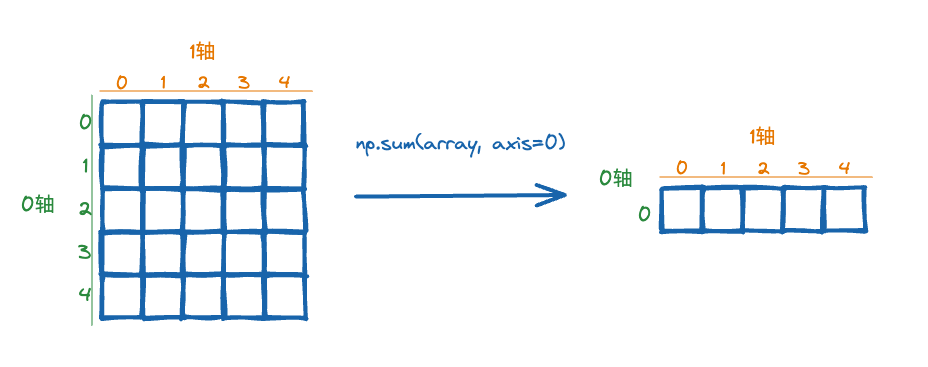
The 0-axis is like a very long straightedge. We draw the row index , which is the 0-axis coordinate represented by the green number .
When we execute np.sum(array, axis=0), we actually add up all the numbers on the 0 axis.
Here are some common axis manipulation examples:
np.sum(array, axis=0): Computes the sum of each column of an array along the row axis.np.mean(array, axis=1): Calculates the average of each column of the array along the row axis.df.sum(axis=0): Computes the sum of each column in a data frame along the row axis.df.mean(axis=1): Computes the mean of each column in a data frame along the row axis.
By understanding the concept of axis, we can better understand and apply various data manipulation and calculation methods in NumPy and pandas.
sample code
The following is some sample code showing how to operate with axis parameters in NumPy and pandas, and give the corresponding running results.
NumPy example:
import numpy as np

# 创建一个二维数组
array = np.array([[1, 2, 3],
                  [4, 5, 6],
                  [7, 8, 9],
                  [10, 11, 12]])

# 沿着行轴计算和
row_sum = np.sum(array, axis=0)
print(row_sum)
print(array.shape)
operation result:
[22 26 30]
(4, 3)
pandas example:
import pandas as pd

# 创建一个数据框
data = {

    'A': [1, 2, 3],
        'B': [4, 5, 6],
        'C': [7, 8, 9]}
df = pd.DataFrame(data)

# 打印输出
print(df.head())

# 沿着列轴计算平均值
col_mean = df.mean(axis=1)
print(col_mean)
operation result:
   A  B  C
0  1  4  7
1  2  5  8
2  3  6  9

0    4.0
1    5.0
2    6.0
Of the examples above, the first example shows how to use NumPy to sum a two-dimensional array along the row axis, resulting in a one-dimensional array containing the sums of each column. The second example shows how to use pandas to calculate the mean of each row in a data frame along the column axis, resulting in a 1D Series object containing the mean value of each row.
Good luck! ~