Voting (voting mechanism) is divided into soft voting and hard voting. Its principle adopts the idea that the minority obeys the majority. This method can be used to solve classification problems.
Hard voting: vote directly for multiple models, and the class with the most votes is the final predicted class.
Soft voting: The same principle as hard voting, it adds the function of setting weights, which can set different weights for different models, and then distinguish the different importance of models.
Soft voting example
The following takes the iris dataset as an example to illustrate the soft voting strategy for model fusion. code show as below:
import numpy as np
import matplotlib.pyplot as plt
import matplotlib.gridspec as gridspec
import itertools
from sklearn.linear_model import LogisticRegression
from sklearn.svm import SVC
from sklearn.ensemble import RandomForestClassifier
# 主要使用 pip install mlxtend 安装 mlxtendfrom mlxtend.classifier import EnsembleVoteClassifier
from mlxtend.data import iris_data
from mlxtend.plotting import plot_decision_regions
%matplotlib inline
# Initializing Classifiers,定义几个分类器
clf1 = LogisticRegression(random_state=20, solver='lbfgs', multi_class='auto')
clf2 = RandomForestClassifier(random_state=20, n_estimators=100)
clf3 = SVC(random_state=200, probability=True, gamma='auto')
eclf = EnsembleVoteClassifier(clfs=[clf1, clf2, clf3], weights=[2,1,1], voting='soft')# Loading some example data,加载数据
X, y = iris_data()
X = X[:,[0,2]]# Plotting Decision Regions
gs = gridspec.GridSpec(1,4)
fig = plt.figure(figsize=(16,4))for clf, lab, grd inzip([clf1, clf2, clf3, eclf],['Logistic Regression','Random Forest','RBF kernel SVM','Ensemble'],
itertools.product([0,1], repeat=2)):
clf.fit(X, y)
ax = plt.subplot(gs[0, grd[0]*2+ grd[1]])
fig = plot_decision_regions(X=X, y=y, clf=clf, legend=2)
plt.title(lab)
plt.show()
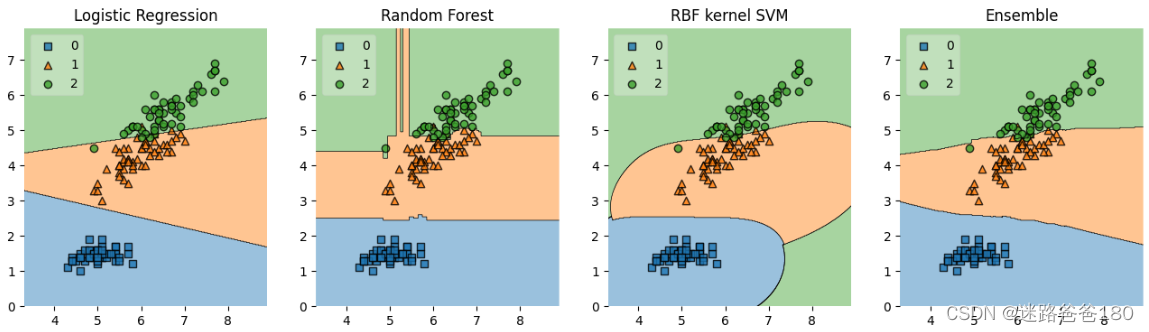
The running result is a visual display of the classification prediction of the data set when using logistic regression, random forest, SVM model and model fusion: