Principalmente a través de python, el submódulo Contour de la librería opencv para analizar la imagen en escala de grises y dibujar la línea de contorno
Documentación de referencia: https://docs.opencv.org/
instalar opencv
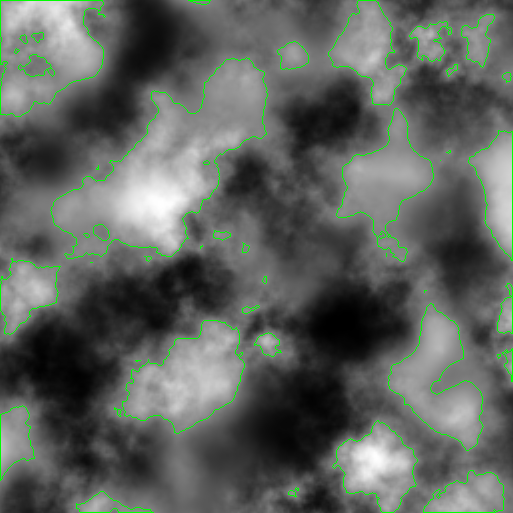
pip install opencv-pythonAnalice archivos de mapa de bits, colores de capas y dibuje contornos
import cv2 as cv
img=cv.imread("terrain.png")
gray=cv.cvtColor(img,cv.COLOR_RGBA2GRAY,0)
ret,thresh=cv.threshold(gray,127,255,cv.THRESH_BINARY)
contours,heirarchy=cv.findContours(thresh,cv.RETR_CCOMP,cv.CHAIN_APPROX_SIMPLE)
cv.drawContours(img,contours,-1,(0,255,0),1)
cv.imshow('aaa',img)
if cv.waitKey(0):
    cv.destroyAllWindows()
Instale la biblioteca de colores para calcular la diferencia de color.
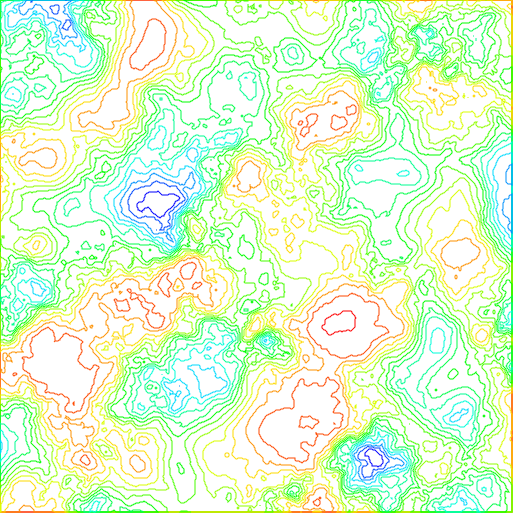
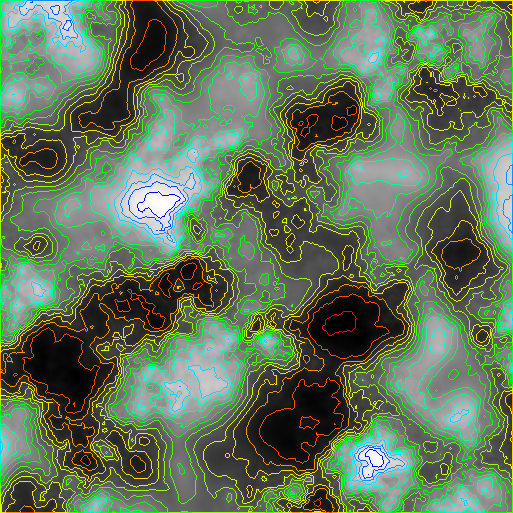
pip install colourDivida el mapa de altura en 15 segmentos (255/17) y use diferentes colores para cada segmento, de menor a mayor, de rojo a azul, y dibuje líneas de contorno
import cv2 as cv
from colour import Color
img=cv.imread("terrain.png")
gray=cv.cvtColor(img,cv.COLOR_RGBA2GRAY,0)
colors=list(Color("red").range_to(Color("blue"),int(255/17)))
for i in range(0,len(colors)):
    ret,thresh=cv.threshold(gray,i*255/len(colors),255,cv.THRESH_BINARY)
    contours,heirarchy=cv.findContours(thresh,cv.RETR_CCOMP,cv.CHAIN_APPROX_SIMPLE)
    cv.drawContours(img,contours,-1,(colors[i].blue*255,colors[i].green*255,colors[i].red*255),1)
cv.imshow('aaa',img)
if cv.waitKey(0):
    cv.destroyAllWindows()
Dado que los contornos aquí son matrices y los elementos son datos de puntos, también puede usar la biblioteca xml para generar gráficos vectoriales svg
import cv2 as cv
from colour import Color
import xml.dom.minidom as minidom
img=cv.imread("terrain.png")
gray=cv.cvtColor(img,cv.COLOR_RGBA2GRAY,0)
colors=list(Color("red").range_to(Color("blue"),int(255/17)))
dom=minidom.getDOMImplementation().createDocument(None,'svg',None)
root=dom.documentElement
root.setAttribute('width',"1024")
root.setAttribute('height',"1024")
root.setAttribute("viewBox","0 0 1024 1024")
root.setAttribute("xmlns","http://www.w3.org/2000/svg")
root.setAttribute("xmlns:xlink","http://www.w3.org/1999/xlink")
root.setAttribute("xmlns:sodipodi","http://sodipodi.sourceforge.net/DTD/sodipodi-0.dtd")
group=dom.createElement('g')
root.appendChild(group)
for i in range(0,len(colors)):
    ret,thresh=cv.threshold(gray,i*255/len(colors),255,cv.THRESH_BINARY)
    contours,heirarchy=cv.findContours(thresh,cv.RETR_CCOMP,cv.CHAIN_APPROX_SIMPLE)
    for a in contours:
        element=dom.createElement('path')
        element.setAttribute('style',"fill:none;fill-opacity:0.512111;stroke-width:1.0;stroke:"+colors[i].hex+";stroke-opacity:1")
        s="M"
        for b in a:
            s+=" %d,%d"%(b[0][0],b[0][1])
        s+=" z"
        element.setAttribute('d',s)
        group.appendChild(element)
with open('aaa.svg','w',newline='\n',encoding='utf-8') as f:
    dom.writexml(f, addindent='\t', newl='\n',encoding='utf-8')