Some cases Matplotlib treatment of common Chinese
Where some of the art often involve processing a timing chart, the time necessary to display Chinese on x axis in an appropriate manner.
Although this problem is very small, but because of professional reasons, often display a variety of time on the x axis, for example, only show month - day - when this unconventional x-axis label, and requested that part of the picture the proportion accounted for not too big, otherwise affect the appearance. And the network processing time on the x-axis is relatively small, local write record count.
This is a record matplotlib treatment blog, but only by a certain nostalgia and only Bin ride a three-year master's career, and finally thank you very much exciting work and daily harassment by a provided material for this blog (probably again He is said to be less hypocritical ha ha ha ha dry).
key point
- Import parameters can be displayed in Chinese
plt.rcParams['font.sans-serif']=['SimHei'] #用来正常显示中文标签
plt.rcParams['axes.unicode_minus']=False #用来正常显示负号
-
by formatting the x-axis and rotated to show the appearance (OCD did you will)
ax1.xaxis.set_major_formatter(mdate.DateFormatter('%H:%M'))
plt.xticks(rotation=30)
Input data, and the results of the code
- Only part of the data input, too affect the appearance, readers need to make up the brain Ha ha ha
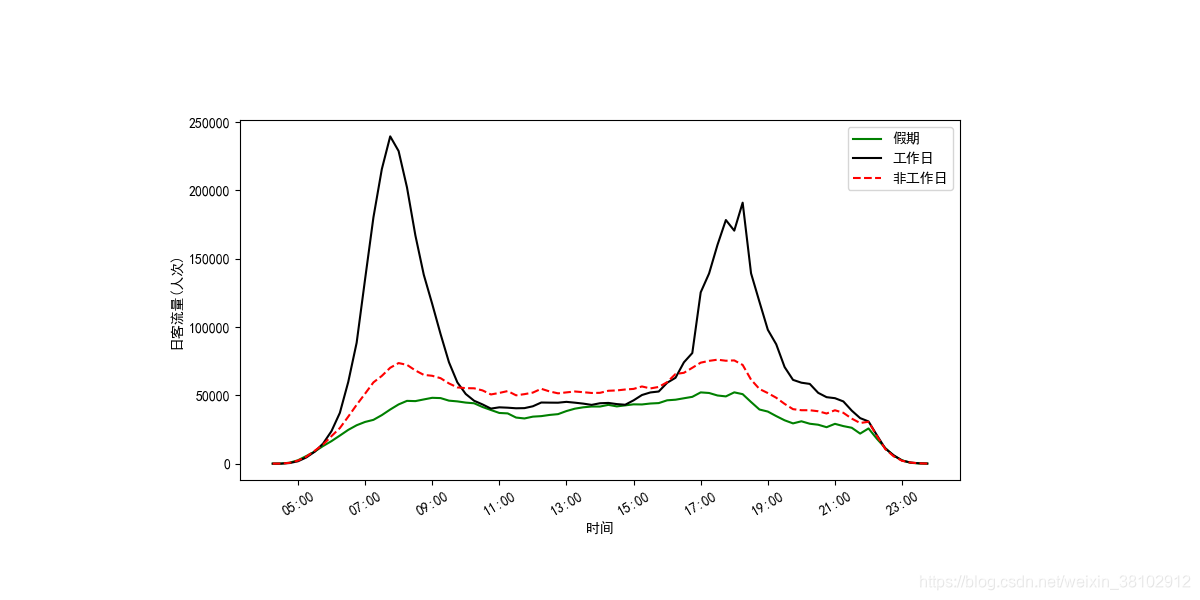
4:15,7,1,1 4:30,53,21,46 4:45,673,433,588 5:00,2449,1711,2209 5:15,5555,4522,5094 5:30,8854,8710,9431 5:45,12886,14687,13918 6:00,16459,23762,20121 6:15,20542,37169,26034 6:30,24708,59783,34398 6:45,28093,88462,43049 7:00,30505,134718,51161 7:15,32046,180216,59468 7:30,35503,215490,64192 7:45,39600,239502,70168 8:00,43334,228761,73596 8:15,45938,202122,72283 8:30,45756,167016,68193 8:45,46982,138231,64956 -
Code
import pandas as pd import numpy as np from datetime import datetime import matplotlib.dates as mdate import matplotlib.pyplot as plt plt.rcParams['font.sans-serif']=['SimHei'] #用来正常显示中文标签 plt.rcParams['axes.unicode_minus']=False #用来正常显示负号 def convert(strAim): t = strAim.split(":") h, m, s = int(t[0]),float(t[1])/60.0,float(t[2])/3600.0 return h+m+s def draw(addressIn,addressOut): df =pd.read_csv(addressIn,header = None) #print(df.head()) x = [] y1 = [] y2 = [] y3 = [] for i in range(len(df)): tx = datetime.strptime('2017-8-1 '+df.iloc[i][0], '%Y-%m-%d %H:%M') x.append(tx) y1.append(df.iloc[i][1]) y2.append(df.iloc[i][2]) y3.append(df.iloc[i][3]) fig1 = plt.figure(figsize=(12,6))#figsize=(16,8) ax1 = fig1.add_subplot(1,1,1) ax1.plot(x,y1,color='green',label='假期')#折线图 ax1.plot(x,y2,color='black',label='工作日') ax1.plot(x,y3,color='red',ls='--',label='非工作日') ax1.xaxis.set_major_formatter(mdate.DateFormatter('%H:%M')) #plt.xticks(pd.timedelta_range(start='05:00:00.000000', periods=38, freq='30T'),rotation=90) #plt.xticks(x) plt.xticks(rotation=30) #plt.ylim(0,6000000) #ax1.set_title('全天') ax1.set_xlabel('时间') ax1.set_ylabel('日客流量(人次)') plt.legend(loc='upper right') plt.subplots_adjust(left=0.2, bottom=0.2, right=0.8, top=0.8) plt.savefig('pic%s.png'%(addressOut),dpi=100) if __name__ == '__main__': draw('differDay.csv','differDay') -
The results shown