This article is about the record is how to use GOT10K toolkit to assess the tracker, and the use of python version OTB toolkit to draw the final results of Fig. Middle also encountered a lot of places do not understand the process of stumbling white record.
GOT10K toolkit evaluate the tracker on different data sets
GOT-10k Python Toolkit is a very powerful tool kit, the toolkit for tracking benchmarks set are mainly used to provide unofficial data download interface as well as for tracking of: OTB (2013/2015), VOT (2013 ~ 2018), DTB70, TColor128, NfS (30/240 fps), UAV (123 / 20L), LaSOT and TrackingNet benchmarks. (ILSVRC VID and YouTube-BoundingBox (comming soon!))
Here we will describe how to use:
1 Download and install
Recommended use
pip install --upgrade got10k
2 definitions we need to test tracker
from got10k.trackers import Tracker

class IdentityTracker(Tracker):
    def __init__(self):
        super(IdentityTracker, self).__init__(
            name='IdentityTracker',  # tracker name
            is_deterministic=True    # stochastic (False) or deterministic (True)
        )

    def init(self, image, box):
        self.box = box

    def update(self, image):
        return self.box
When they need to test package definition tracker with the tool, simply defined inside IdentityTracker class init and update function can be.
- init function: bbox initial frame is received and the initial frame among the test video sequences.
- update function: subsequent frame is received, returns the updated bbox.
3 runs on GOT10K evaluate different tracker
from got10k.experiments import ExperimentGOT10k

# ... tracker definition ...

# instantiate a tracker
tracker = IdentityTracker()

# setup experiment (validation subset)
experiment = ExperimentGOT10k(
    root_dir='data/GOT-10k',    # GOT-10k's root directory
    subset='val',               # 'train' | 'val' | 'test'
    result_dir='results',       # where to store tracking results
    report_dir='reports'        # where to store evaluation reports
)
experiment.run(tracker, visualize=True)

# report tracking performance
experiment.report([tracker.name])
If other data sets, only slightly modified:
experiments = [
        # ExperimentVOT('data/VOT2019', version=2019)
        # ExperimentGOT10k('data/GOT-10k', subset='test'),
        ExperimentOTB('data/OTB', version=2013),
        # ExperimentOTB('data/OTB', version=2015),
        # ExperimentDTB70('data/DTB70'),
        # ExperimentTColor128('data/Temple-color-128'),
        # ExperimentUAV123('data/UAV123', version='UAV123'),
        # ExperimentUAV123('data/UAV123', version='UAV20L'),
        # ExperimentNfS('data/nfs', fps=30),
        # ExperimentNfS('data/nfs', fps=240)
    ]

    # run tracking experiments and report performance
    for e in experiments:
        e.run(tracker, visualize=False)
        e.report([tracker.name])
Tracking process is implemented in all the data sets in e.run
The results obtained present result_dir, default / results / e / trackername
Results There / reports / e / trackername Report
4 Next primarily due to use OTB Kit draw the comparison between the trackers, so we'll analyze the results after ExperimentOTB.run and ExperimentOTB.report
In an example OTB2015
when e.run (tracker, visualize = False) ( where e may be any database interface got10k package inside)
ExperimentOTB.run first enters the function,
according to the
for s, (img_files, anno) in enumerate(self.dataset):
taken out, and determines whether the current test sequence have been no good results in the data set for each sequence, if not then:
boxes, times = tracker.track( img_files, anno[0, :], visualize=visualize)
Then into
got10k.trackers.__init__.pythe track function,
for f, img_file in enumerate(img_files):
to each of a sequence of iterations of each frame is taken out or fed update function init
Then our tracker (tracker their definition, inheriting from trackers down) have already been defined init function and the update function, for each sequence, the value of the bounding box out only the first frame, the first frame and the first frame the value of the bounding box into init function. The next frame will be sent to update function.
E.report focused look at the results, followed by python version of the package will mainly use this OTB
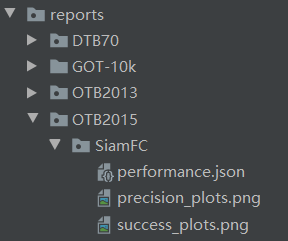
I used to compare my main test tracker SiamFC, you can see the directory directly generate three files
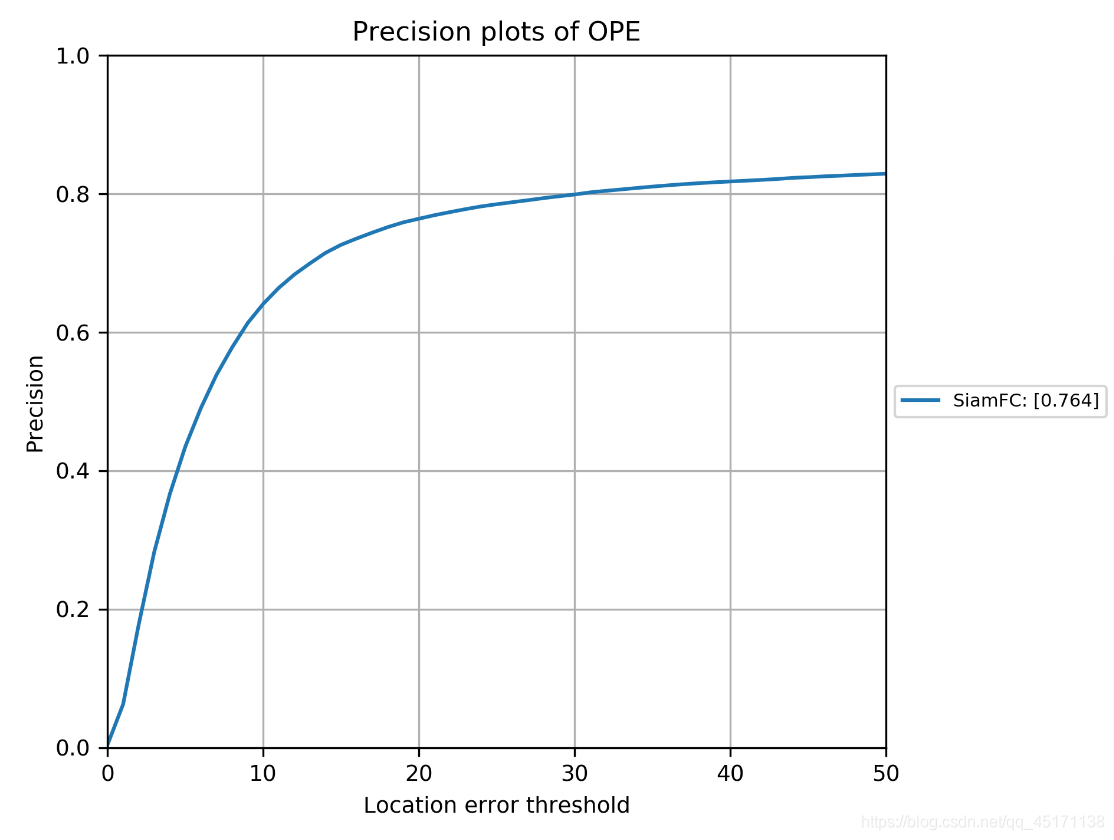
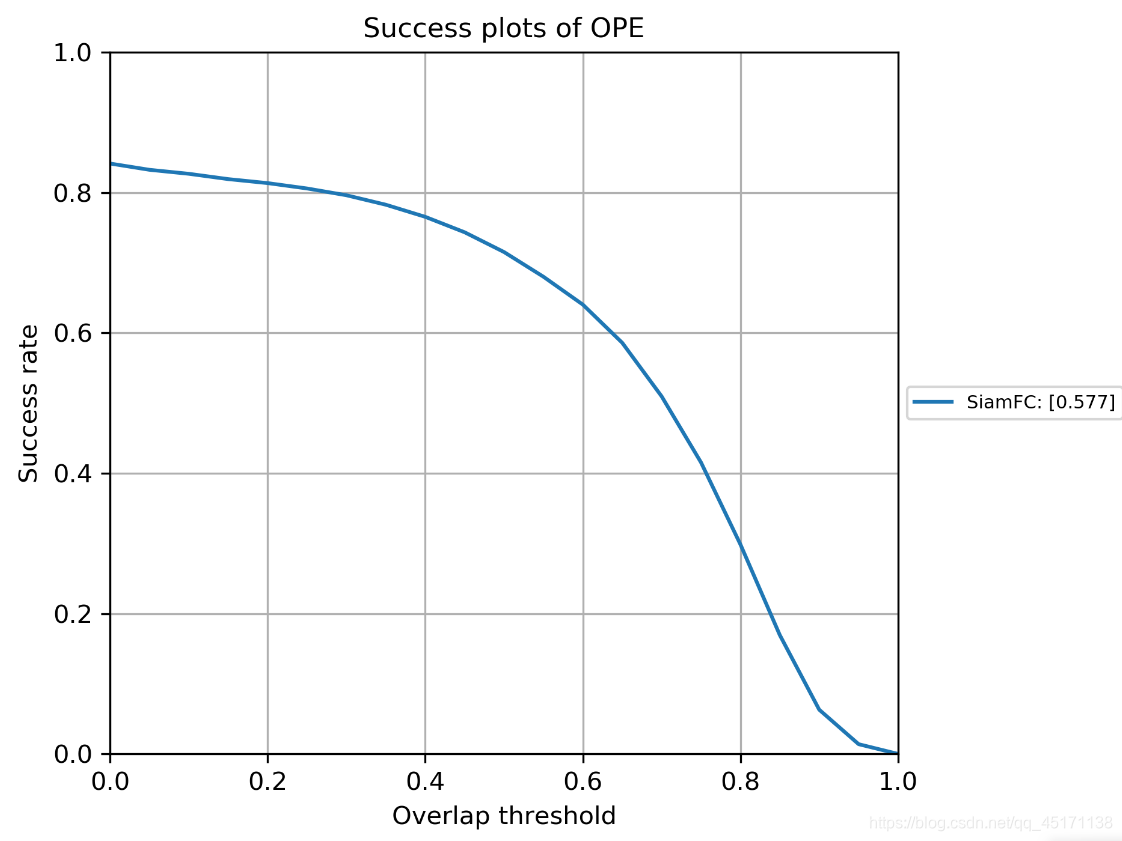
Can directly see the success plot is generated and precision plot, if not compared with other trackers, to which can end.
Most importantly, the data json file:

You can read success score and precision score, and speed fps.
python version of the toolkit tracker contrast OTB
1 Installation and Configuration Environment
First Quguan network download package python version of OTB
OTB official website

can also go directly to the download on github
Second, you can see the relevant configuration requirements on github:
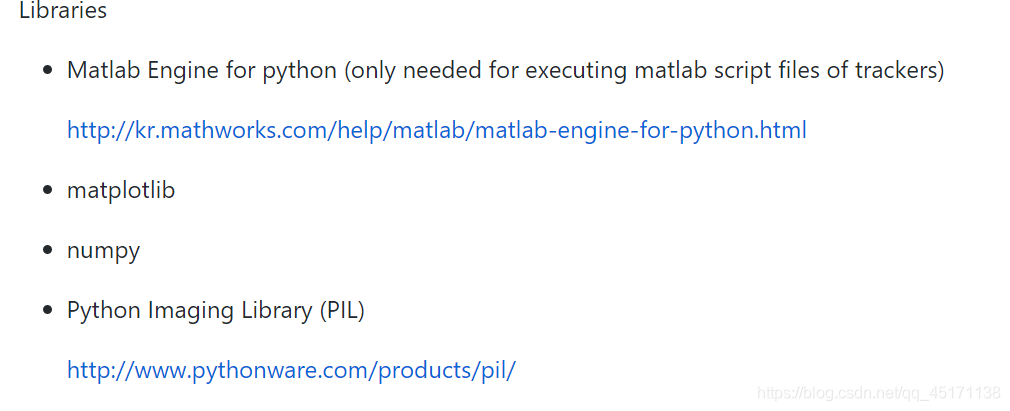
where the first package I understand that if you need to evaluate tracker matlab code is written, you need to use to use this package call in python. But I use python to review mainly because my code is written in python, matlab pack too much trouble for me, I do not want to turn mat file. So this package is no next. The other three packages are just great to get away. There is little attention: the need to use python2.7 version! ! !
FIG 2 Comparison!
Advance Description: Because I've already completed the package tracking evaluation of the tracker on the OTB (2013 or 2015). (Note got10k only generate results OPE's) by got10k tools in this step is just to put our tracker and 2013 or 2015 of the OTB people have good test results were compared to baseline tracker (baseline tracker 34). So we are only concerned with how a comparison chart.
So we just need to focus on results / OPE files in this folder (OTB comes to the first baseline tracker ASLA for example):
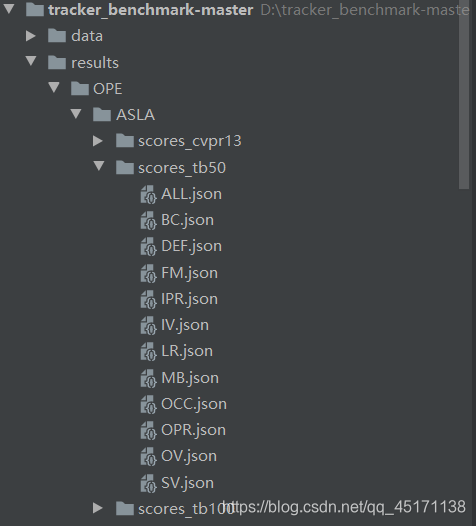
- There are three folders to store the results of the test track results / OPE / ASLA / under: scores_tb50 and socres_cvpr2013 are stored OTB2013 result of, scores_tb100 store the results of OTB2015.
- In scores_tb50 example, the following 14 respectively are stored in different files json challenge (e.g., occlusion, rapid movement) of the tracking result. Different test sequences corresponding to different challenges, only ALL.json corresponding sequence of all sequence (50).
- In fact, we look at the results ALL.json inside when drawing.
- So we just need to track the results of our tracker made ALL.json, placed under the corresponding folder, for example, my tracker is SiamFC, to put results / OPE / SiamFC / (results OTB2013 placed scores_tb50 , the result is placed under OTB2015 scores_tb100) can be directly showing it!
- About how to change ALL.json is simple: to scores_tb50 as an example or
copy it to other trackers ALL.json, and then we like to improve their parameters
{"name": "ALL", "desc": "All attributes", "tracker": "SiamFC", "evalType": "OPE", "seqs": ["BasketBall", "Biker", "Bird1", "BlurBody", "BlurCar2", "BlurFace", "BlurOwl", "Bolt", "Box", "Car1", "Car4", "CarDark", "CarScale", "ClifBar", "Couple", "Crowds", "David", "Deer", "Diving", "DragonBaby", "Dudek", "Football", "Freeman4", "Girl", "Human3", "Human4-2", "Human6", "Human9", "Ironman", "Jump", "Jumping", "Liquor", "Matrix", "MotorRolling", "Panda", "RedTeam", "Shaking", "Singer2", "Skating1", "Skating2-1", "Skating2-2", "Skiing", "Soccer", "Surfer", "Sylvester", "Tiger2", "Trellis", "Walking", "Walking2", "Woman"],
    "overlap": 58.7795880263541,
    "error": 7.794622900737891,
    "overlapScores": [0.38392220858021286, 0.3883923043332954, 0.04390543001550806, 0.194683655138013, 0.15915973959142307, 0.0894964239129424, 0.22384329718365356, 0.011058817570470185, 0.34823984258950896, 0.6508906923934548, 0.7535802226025262, 0.8491585239311483, 0.6070066757641235, 0.15502168012198222, 0.07585873833995199, 0.67882906764084, 0.7484439296263788, 0.03283713375317789, 0.17190439303587005, 0.18311095262425905, 0.7365616854638956, 0.5309180662873945, 0.12747598289090473, 0.7111340918940541, 0.007423368132814519, 0.4085822187597404, 0.3808077356687787, 0.20574960140747073, 0.11846672425697576, 0.09741395465333871, 0.2264789895501827, 0.247066828890485, 0.12122690433373202, 0.10554569108891122, 0.5015786486577571, 0.6174378729799935, 0.46219086168452955, 0.04375909192824903, 0.49555436149055704, 0.08219681780947928, 0.28238781793584533, 0.09248756804048978, 0.11262941193015051, 0.40300662549663674, 0.5912677351263589, 0.14533729914861213, 0.8026553889859993, 0.7717167796943779, 0.3712854356456783, 0.1479269294507216],
    "errorNum": [4.441379310344828, 5.563380281690141, 9.632352941176471, 8.203592814371257, 8.76923076923077, 9.24949290060852, 8.240887480190175, 9.857142857142858, 5.693367786391042, 0.029411764705882353, 0.0, 0.0, 3.0952380952380953, 7.598784194528876, 9.142857142857142, 1.0951008645533142, 0.4246284501061571, 9.71830985915493, 8.232558139534884, 8.495575221238937, 1.0305676855895196, 3.4806629834254146, 8.303886925795053, 0.9199999999999999, 9.935217903415783, 4.002998500749625, 5.416666666666666, 8.327868852459016, 8.734939759036145, 9.180327868852459, 8.338658146964855, 7.610568638713383, 9.8, 9.02439024390244, 5.8999999999999995, 2.226277372262774, 6.219178082191781, 9.6448087431694, 3.1, 9.365750528541225, 7.991543340380549, 8.88888888888889, 8.75, 4.867021276595745, 2.505576208178439, 8.575342465753424, 1.4235500878734622, 0.02427184466019417, 6.02, 8.056951423785595],
    "successRateList": [],
    "precisionList": []}
As we can see is measured OTB2013, so seqs is the name of 50 sequences; "overlap" corresponds success_score we get in got10k, ie AUC, but here are * 100, the last track is in accordance with the ranking of; "error" corresponds precision_score, here I do not understand why all × 10, but does not affect, because the last time a map is useless to; "overlapScores" "errorNum" futile, do not change; the most important It came! ! ! Success_curve got10k paste obtained to the value in the "successRateList", the value in the paste precision_curve to "precisionList" in.
- last step:
Success rate plotting command: `python draw_graph.py`
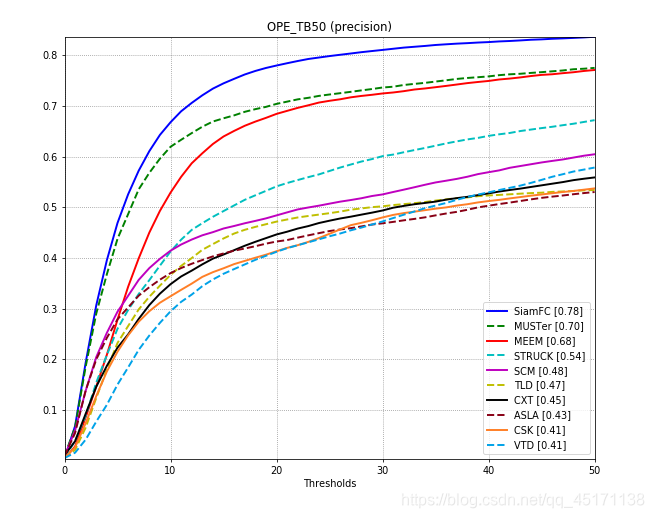
Precision plotting commaind: `python draw_graph.py precision`
In the draw_graph.py
def main():
    evalTypes = ['OPE'] # 使用哪种评估方式
    testname = 'tb50'  # 是测OTB2013还是2015
    graph = 'overlap'   # 默认画的是successplot
    if len(sys.argv) >= 2:
        graph = sys.argv[1]
- The final result (the default display only the first 10)
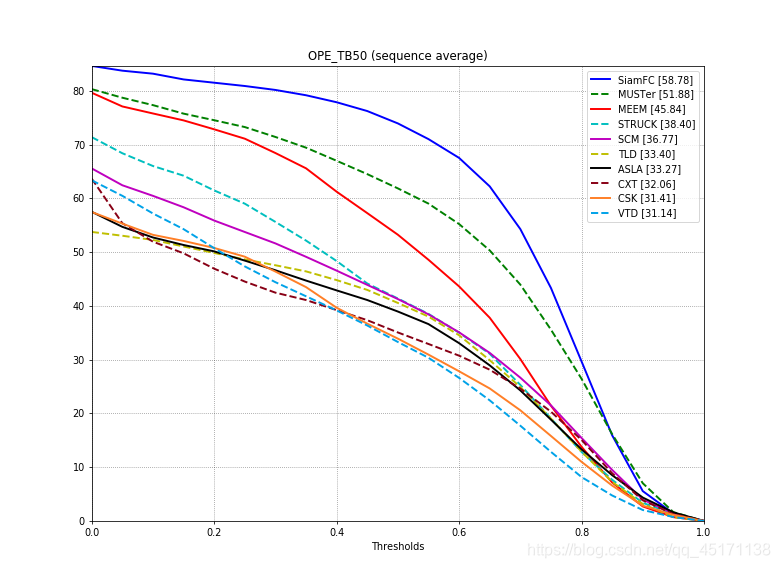
It is pure white, just started tracking the field a little bit, there may be some local people to solve all of a sudden I still need to get a long whining. Some places do not welcome bigwigs correction.
