Linux
Article Directory
- Linux
- 1. The basic process outlined
- 1.1 part of the process
- 1.2 process environment
- The process of generating 1.3
- .4 classification process
- 2. Process Status
- 3. Process Priority
- 3.1 linux process scheduling and multi-tasking
- 3.2 Process Priority
- 3.3 relative priority
- 3.4 nice and authority level
- 3.5 adjustment process priority
- 4. The process management command
- The job control
- 6. Inter-Process Communication
- 7. Use the signal control process
- 8. Monitoring Process Activity
1. The basic process outlined
Process is started to run executable program examples.
/ Proc directory under the name of the directory in digital, each directory represents a process that holds attribute information process. PID of each process is unique, even if the process exits, and other processes will not take up its PID.
1.1 part of the process
- Allocated memory address space
- Security attributes, including ownership credentials and privileges
- One or more program code execution threads
- Process State
1.2 process environment
- Local and global variables
- Current scheduling context
- Allocation of system resources, such as file descriptors and network ports
The process of generating 1.3
Existing (parent) process to copy its own address space (fork) to create a new (child) process structure.
Each new process is assigned a unique process ID (PID), to meet the needs and safety of the track. PID of the parent process ID (PPID) are elements of the new process environment.
Any process can create a child process. All processes are descendants of the first system processes. On RHEL7, the first system process is systemd.
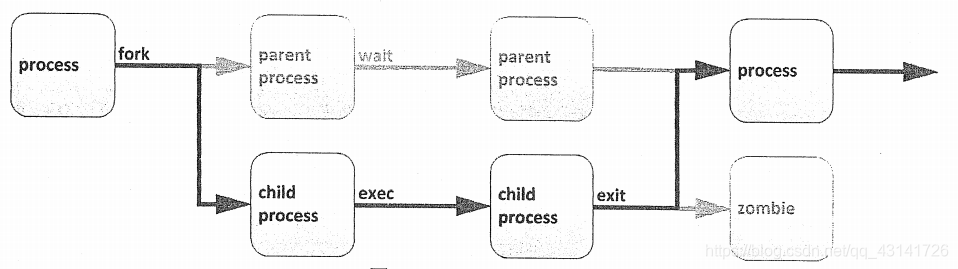
By fork routine child inherits the security identity, past and current file descriptors, ports and resources privileges, environment variables, and program code. Subsequently, the child could exec their own code. Typically, the parent child process during operation in a sleep state, a setting request (the wait) signal upon completion of the process. Upon exiting, the child may have been closed or dropped their resources and the environment, and the remaining part is called a zombie. Parent process receives a signal to be awakened in the child process exits, clearing the remaining structure, and then continue with its own code.
.4 classification process
Foreground process: the process related to the terminal, the terminal starts the process by
- Note: You can also start the process at the front desk sent to the background, running in daemon mode
Daemon: daemon, with the process regardless of terminal (e.g., the kernel), to start the system during the boot process
2. Process Status
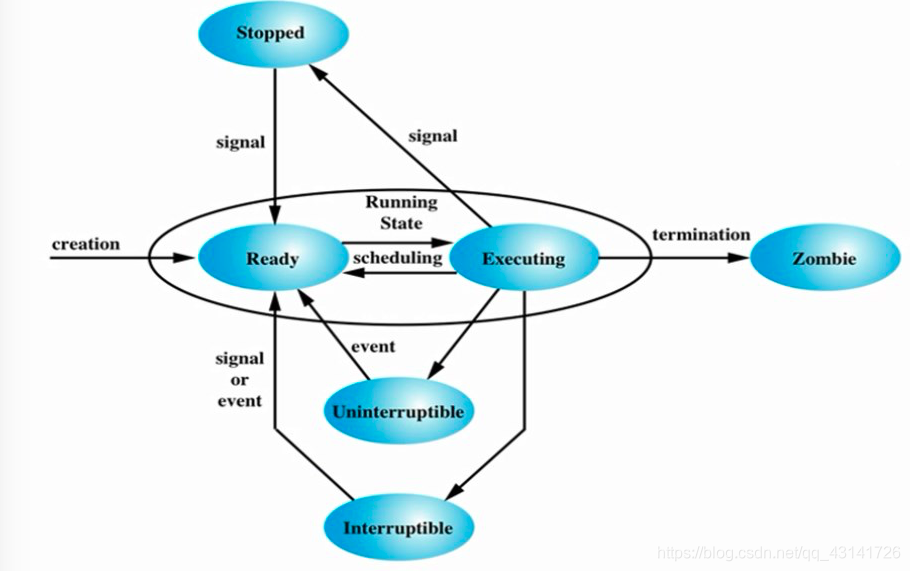
Excuting                    //运行态
Ready                       //就绪态,也可以称作睡眠态
    Uninterruptible sleep   //不可中断的睡眠。不可随时唤醒,只有当IO资源加载成功后才能唤醒
    Interruptible sleep     //可中断的睡眠。可随时唤醒
Zombie                      //僵尸进程。正常运行结束了,但是不释放占据的内存
Stopped                     //停止态,暂停于内存中,但不会被调度,除非手动启动之
The reason the process of sleep:
When executing a process, you need to load additional IO resources, due to the slow speed of the IO device, it goes into a sleep state to wait, to hand over the CPU to other processes, so as not to waste the remaining execution time
In the multi-tasking operating system, each CPU (or CPU core) processing a process at a point in time. In the process runs, its direct request of CPU time and resource allocation subject to change. Process is assigned a status, which along with environmental requirements change.
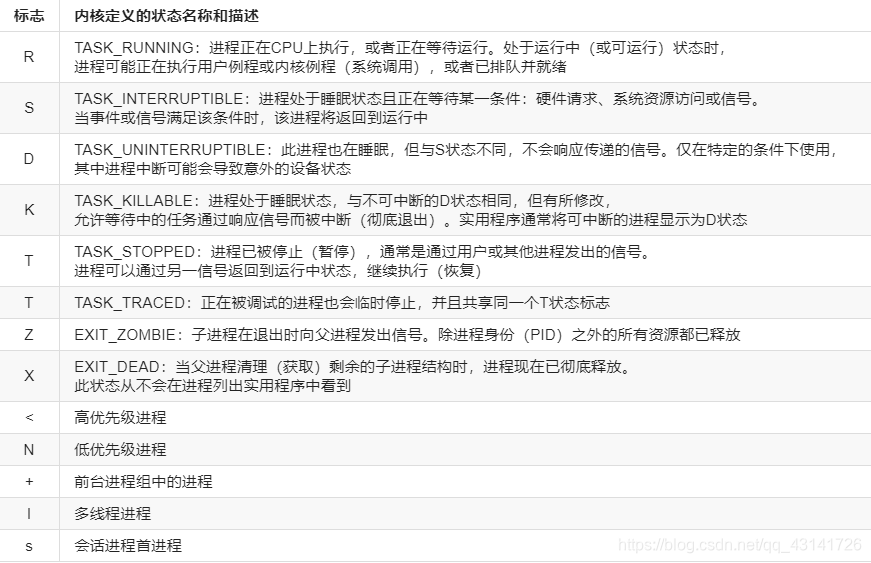
Linux process status
3. Process Priority
3.1 linux process scheduling and multi-tasking
Modern computer systems include both instructions and only allows a low-end processor, comprising high-performance supercomputer, supercomputers each with hundreds of the CPU, having a plurality of cores on each of the CPU, they may be performed in parallel hundreds of instruction. But all these systems tend to have one thing in common: they need to run a number of processes always exceeds the number of core actually has.
By the time slicing technique, Linux (and other operating systems) actual (and threads) to run the process can exceed the actual number of processing units available. Operating system process scheduler will quickly switch between processes on a single core, giving the user the impression of a kind of running multiple processes at the same time.
Perform this switch part of the Linux kernel called process scheduler.
3.2 Process Priority
Process Priority range: 0-139, the lower the number, the higher the priority
- 0-99: real-time priority, Kernel Tuning
- 100-139: static priority, the user can control
Process high-priority features:
- Get more CPU time
- More priority access to CPU run
To modify the priority of a process can be achieved by adjusting the process nice value, the smaller the nice value, the higher the priority:
the range is nice value (-20,19) - 139 corresponding to 20 corresponds to 100,19
3.3 relative priority
由于不是每种进程都与其他进程同样重要,可告知调度程序为不同的进程使用不同的调度策略。常规系统上运行的大多数进程所使用的调度策略称为SCHED_OTHER(也称为SCHED_NORMAL),但还有一些其他策略可用于不同的目的。
由于并非所有进程都以同样的方式创建,可为采用SCHED_NORMAL策略运行的进程指定相对优先级。此优先级称为进程的nice值。一个进程可以有40种不同级别的nice值。
这些nice级别的范围是从-20到19。默认情况下,进程将继承其父进程的nice级别,通常为0
nice级别越高,表示优先级越低(该进程容易将其CPU使用量让给其他进程)
nice级别越低,表示优先级越高(该进程更加不倾向于让出CPU)
如果不存在资源争用(例如当活动进程数少于可用CPU核心数时),即使
nice级别高的进程也将仍使用它们可使用的所有可用CPU资源。但当请求CPU时间的进程数超过可用核心数时
,nice级别较高的进程将比nice级别较低的进程收到更少的CPU时间
3.4 nice级别与权限
为很占CPU资源的进程设置较低的nice级别可能会对同一系统上运行的其他进程的性能造成负面影响,所以仅允许root用户设置负nice级别以及降低现有进程的nice级别。
普通非特权用户仅允许设置正的nice级别。只能对现有进程提升nice级别,而不能降低nice级别。
3.5 进程优先级调整
进程优先级调整:调整nice值
//调整已经启动的进程的nice值:
    renice NI PID(例:renice 3 3704)
//在启动时指定nice值:(-20,19)
    nice -n NI COMMAND
4. 进程管理命令
Linux系统各进程的相关信息均保存在/proc/PID目录下的各文件中
4.1 ps
ps(process state)命令用于列出当前的进程。可以显示详细的进程信息,包括:
- 用户识别符(UID),它确定进程的特权
- 唯一进程识别符(PID)
- CPU和已经花费的实时时间
- 进程在各种位置上分配的内存数量
- 进程的位置STDOUT,称为控制终端
- 当前的进程状态
ps支持三种选项格式:
- UNIX(POSIX)选项,可以分组但必须以连字符开头
- BSD 选项,可以分组但不可与连字符同用
- GNU 长选项,以双连字符开头
ps(process state),显示进程信息。注意事项:
- 加了[]中括号的,表示内核线程,通常位于顶部
- exiting或defunct表示僵尸进程
//常用选项:
a       //显示所有与终端有关的进程
u       //显示进程是由哪个用户启动的
x       //显示所有与终端无关的进程

-e      //显示所有进程,与-A效果相同
-l      //以长格式显示
-F      //显示更详细的完整格式的进程信息
-f      //显示更详细的完整格式的进程信息
-H      //以进程层级格式显示进程相关信息
-o      //根据自己的需要选择要显示的字段

[root@localhost ~]# ps -o pid,comm,ni       //表示只显示进程号,命令,nice值三个字段
   PID COMMAND          NI
  8828 bash              0
  9844 ps                0


//aux结果解析:
    VSZ     //Virtual memory SiZe,虚拟内存集
    RSS     //ReSident Size,常驻内存集
    STAT    //进程状态
    TIME    //运行时的累积时长

//ps命令结果解析:
    NI      //nice值
    PRI     //优先级
    PSR     //进程运行在哪个CPU核心上
    RTPTRIO //实时优先级
    C       //运行的CPU编号
    STIME   //进程的启动时间
    VSZ     //Virtual memory SiZe,虚拟内存集
    RSS     //ReSident Size,常驻内存集
    STAT    //进程状态
    TIME    //运行时的累积时长
4.2 pstree
pstree用于显示当前系统上的进程树
[root@localhost ~]# pstree
systemd─┬─NetworkManager─┬─dhclient
        │                └─2*[{NetworkManager}]
        ├─VGAuthService
        ├─atd
        ├─auditd───{auditd}
        ├─crond
        ├─dbus-daemon
        ├─firewalld───{firewalld}
        ├─irqbalance
        ├─login───bash
        ├─lvmetad
        ├─master───qmgr
        ├─polkitd───5*[{polkitd}]
        ├─rhnsd
        ├─rhsmcertd
        ├─rsyslogd───2*[{rsyslogd}]
        ├─sshd───sshd───bash───pstree
        ├─systemd-journal
        ├─systemd-logind
        ├─systemd-udevd
        ├─tuned───4*[{tuned}]
        └─vmtoolsd───{vmtoolsd}
4.3 pgrep
以grep风格指定只显示哪些进程,在当前系统中找符合某些特性的进程。只显示进程号
[root@localhost ~]# pgrep atd
1387
[root@localhost ~]# pgrep sshd
1105
8826
[root@localhost ~]# ps -ef|grep sshd
root       1105      1  0 08:44 ?        00:00:00 /usr/sbin/sshd -D
root       8826   1105  0 09:48 ?        00:00:00 sshd: root@pts/0
root       9908   8828  0 16:42 pts/0    00:00:00 grep --color=auto sshd
4.4 pidof
根据进程名查找其PID号
[root@localhost ~]# pidof sshd
8826 1105
[root@localhost ~]# pidof atd
1387
4.5 vmstat
虚拟内存状态查看命令
//语法:vmstat [options] [delay [count]]
//例:
vmstat 2        //表示每2秒刷新一次
vmstat 2 5      //表示每2秒刷新一次,刷新5次后退出

//常用的选项:
    -s          //显示内存的统计数据


[root@localhost ~]# vmstat
procs -----------memory---------- ---swap-- -----io---- -system-- ------cpu-----
 r  b   swpd   free   buff  cache   si   so    bi    bo   in   cs us sy id wa st
 1  0      0 576992   3388 271316    0    0     2     1   15   13  0  0 100  0  0

procs:
    r(running)  //表示等待运行的队列长度,也即等待运行的进程的个数
    b(block)    //表示阻塞队列长度,也即处于不可中断睡眠态的进程个数
memory:
    swpd        //交换内存的使用总量
    free        //空闲物理内存总量
    buffer      //用于buffer的内存总量
    cache       //用于cache的内存总量
swap:
    si(swap in)     //表示从物理内存有多少页面换进swap,也即数据进入swap的数据速率(kb/s)
    so(swap out)    //表示从swap有多少页面换进物理内存,也即数据离开swap的数据速率(kb/s)
io:
    bi(block in)    //表示磁盘块有多少个被调入内存中,也即从块设备读入数据到系统的速率(kb/s)
    bo(block out)   //表示有多少个磁盘块从内存中被同步到硬盘上去了,也即保存数据至块设备的速率(kb/s)
system:
    in( interrupts)     //表示中断的个数,也即中断速率(kb/s)
    cs(context switch)  //表示上下文切换的次数,也即进程切换速率(kb/s)
CPU:
    us      //表示用户空间
    sy      //表示内核空间
    id      //表示空闲百分比
    wa      //表示等待IO完成所占据的时间百分比
    st      //表示steal,被虚拟化技术偷走的时间(比如运行虚拟机)
5. 控制作业
5.1 作业与会话
作业控制是shell的一种功能,它允许单个shell实例运行和管理多个命令。
作业与在shell提示符中输入的每个管道相关联。该管道中的所有进程均是作业的一部分,并且是同一个进程组的成员。(如果在shell提示符中仅输入了一条命令,则这条命令可视为命令的最小管道。该命令将是该作业的唯一成员)
一次只能有一个作业从特定终端窗口读取输入和键盘生成的信号。属于该作业的进程是该控制终端的前台进程。
该控制终端的后台进程是与该终端相关联的任何其他作业的成员。终端的后台进程无法从终端读取输入或接收键盘生成的中断,但可以写入终端。后台中的作业可能已停止(暂停),也可能正在运行。如果某个正在运行的后台作业尝试从终端读取内容,则该作业将自动暂停。
每个终端是其自身的会话,并且可以具有一个前台进程和多个独立的后台进程。一个作业只能属于一个会话,也就是属于其控制终端的会话。
5.2 作业分类
Linux作业分为前台作业与后台作业两种。其各自的特点如下:
前台作业:通过终端启动,且启动后一直占据了命令提示符
后台作业:可以通过终端启动,但启动之后,释放命令提示符,后续的操作在后台完成
- 此类作业虽然被送往后台运行,但其依然与终端相关。如果希望送往后台后,剥离与终端的关系需要执行(nohup COMMAND &)
5.3 在后台运行作业
//在命令后跟上&符号可以生成一个后台作业
[root@localhost ~]# sleep 1000 &
[1] 1819

//jobs命令用于显示当前所有的后台作业
[root@localhost ~]# jobs
[1]+  Running                 sleep 1000 &

//fg命令用于将后台作业调至前台运行
[root@localhost ~]# fg
//当只有一个后台作业时,直接使用fg命令,不跟任何参数即可将后台作业调至前台运行,但是当有多个作业时则必须跟上%+作业号,也就是上面命令执行结果中以[]括起来的数字。
[root@localhost ~]# jobs
[1]-  Running                 sleep 1000 &
[2]+  Running                 sleep 500 &
[root@localhost ~]# fg %1

//使用ctrl+z可将前台进程发送到后台,此时作业将处于停止状态
[root@localhost ~]# fg %1
sleep 1000
^Z
[1]+  Stopped                 sleep 1000

//使用bg命令+作业号可使后台已停止的作业重新运行
[root@localhost ~]# bg %1
[1]+ sleep 1000 &
[root@localhost ~]# jobs
[1]-  Running                 sleep 1000 &
[2]+  Running                 sleep 500 &

//kill加上作业号可以手动杀死指定作业
[root@localhost ~]# jobs
[1]-  Running                 sleep 1000 &
[2]+  Running                 sleep 500 &
[root@localhost ~]# kill %1
[1]-  Terminated              sleep 1000
[root@localhost ~]# jobs
[2]+  Running                 sleep 500 &

//jobs命令的结果中
    +     //命令将默认操作的作业
    -     //命令将第二个默认操作的作业
6. 进程间通信
进程间通信(IPC:Inter Process Communication)
进程间通信方式:
同一主机
- 共享内存
- 信号:Signal
不同主机
- rpc:remote procecure call
- 基于socket实现进程间通信
7. 使用信号控制进程
信号是传递至进程的软件中断。信号向执行中的程序报告事件。生成信号的事件可以是错误或外部事件(如I/O请求或计时器过期),或者来自于明确请求(如使用信号发送命令)
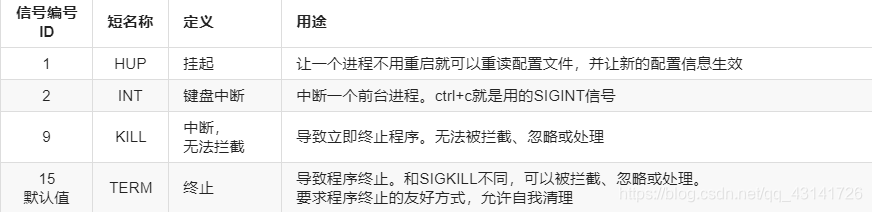
下表列出了系统管理员用于日常进程管理的基本信号。请通过短名称(HUP)或正确名称(SIGHUP)指代信号。
指定一个信号的方法:
- 信号号码(数字标识):kill -1
- 信号完整名称:kill -SIGKILL
- 信号简写名称:kill -TERM或kill -KILL或kill -INT或kill -HUP
基本进程管理信号
用户可以中断自己的进程,但只有root才能终止由其他人拥有的进程。
kill命令根据ID向进程发送信号。虽其名称为kill,但该命令可用于发送任何信号,而不仅仅是终止程序的信号
//语法: kill [-SIGNAL] PID ...

//显示所有可用的信号(可使用man 7 signal查看帮助信息)
[root@localhost ~]# kill -l
 1) SIGHUP       2) SIGINT       3) SIGQUIT      4) SIGILL       5) SIGTRAP
 6) SIGABRT      7) SIGBUS       8) SIGFPE       9) SIGKILL     10) SIGUSR1
11) SIGSEGV     12) SIGUSR2     13) SIGPIPE     14) SIGALRM     15) SIGTERM
16) SIGSTKFLT   17) SIGCHLD     18) SIGCONT     19) SIGSTOP     20) SIGTSTP
21) SIGTTIN     22) SIGTTOU     23) SIGURG      24) SIGXCPU     25) SIGXFSZ
26) SIGVTALRM   27) SIGPROF     28) SIGWINCH    29) SIGIO       30) SIGPWR
31) SIGSYS      34) SIGRTMIN    35) SIGRTMIN+1  36) SIGRTMIN+2  37) SIGRTMIN+3
38) SIGRTMIN+4  39) SIGRTMIN+5  40) SIGRTMIN+6  41) SIGRTMIN+7  42) SIGRTMIN+8
43) SIGRTMIN+9  44) SIGRTMIN+10 45) SIGRTMIN+11 46) SIGRTMIN+12 47) SIGRTMIN+13
48) SIGRTMIN+14 49) SIGRTMIN+15 50) SIGRTMAX-14 51) SIGRTMAX-13 52) SIGRTMAX-12
53) SIGRTMAX-11 54) SIGRTMAX-10 55) SIGRTMAX-9  56) SIGRTMAX-8  57) SIGRTMAX-7
58) SIGRTMAX-6  59) SIGRTMAX-5  60) SIGRTMAX-4  61) SIGRTMAX-3  62) SIGRTMAX-2
63) SIGRTMAX-1  64) SIGRTMAX


//killall COMMAND:killall后面跟进程名,表示将匹配到的以进程名为名的进程全部杀死
[root@localhost ~]# ps -ef|grep sleep
root       1914   1272  0 19:58 pts/0    00:00:00 sleep 1000
root       1915   1272  0 19:58 pts/0    00:00:00 sleep 500
root       1916   1272  0 19:58 pts/0    00:00:00 sleep 700
root       1920   1272  0 19:58 pts/0    00:00:00 grep --color=auto sleep
[root@localhost ~]# killall sleep
[1]   Terminated              sleep 1000
[2]-  Terminated              sleep 500
[3]+  Terminated              sleep 700
[root@localhost ~]# ps -ef|grep sleep
root       1923   1272  0 19:58 pts/0    00:00:00 grep --color=auto sleep
8. 监控进程活动
8.1 IO负载
负载平均值代表一段时间内感知的系统负载。Linux通过预期服务等待时间的表示来实施平均负载计算。
Linux不仅计算进程数,也作为独立的任务计算线程数。运行中线程和等待I/O资源的线程的CPU请求队列对应于R和D进程状态。等待I/O包括处于睡眠而等待预期磁盘和网络响应的任务。
负载数属于全局计数器计算,是所有CPU的总和数。由于从睡眠返回的任务可能会重新调度到不同的CPU,难以精确的每CPU计数,但累计数的准确度可以保障。显示的平均负载代表所有的CPU。
//查看cpu核心数
[root@localhost ~]# grep 'model name' /proc/cpuinfo
model name      : Intel(R) Core(TM) i5-3210M CPU @ 2.50GHz
model name      : Intel(R) Core(TM) i5-3210M CPU @ 2.50GHz
model name      : Intel(R) Core(TM) i5-3210M CPU @ 2.50GHz
model name      : Intel(R) Core(TM) i5-3210M CPU @ 2.50GHz
一些UNIX系统仅考虑CPU使用率或运行队列长度来指示系统负载。由于具有空闲CPU的系统可能会因为磁盘或网络资源忙而遇到很长时间的等待,因此Linux负载平均值中包含了对I/O的考量。遇到负载平均值很高但CPU活动很低时,请检查磁盘和网络活动。
Linux中可以使用top、uptime显示负载平均值的情况。
[root@localhost ~]# uptime
 22:35:39 up  7:06,  3 users,  load average: 0.00, 0.01, 0.05
//此处的load average就表示负载平均值,这三个值代表最近1、5和15分钟的负载情况。
将显示的负载平均值除以系统中的逻辑CPU数。当值低于1表示资源利用率较好,等待时间很短。当值高于1表示资源饱和,而且有一定的服务等待时间。
The number of idle CPU load queue is 0. Each thread is ready and waiting to make the count increased by one. The total number of queue 1, the resources (CPU, disk, or network) is in use, but not spend time waiting for the request. Increase in the cumulative number of requests will be counted, but many requests can be processed within the time limit, resource usage will be high, and the waiting time will not.
Because the disk or network resource busy waiting for I / O is in a sleeping processes included in this count, and the average value of the load increases. Although it can not represent CPU utilization, queue number still indicates that the user is waiting for resources and program services.
Before resource saturation, the average load will remain at 1 or less, because almost will not find a job waiting in the queue. Only the resource request results in a saturated state and remain in the queue when the load count calculation routine, the average load will increase. When resource utilization close to 100% for each additional request will begin to experience the service latency.
8.2 real-time process monitoring
top for full screen display of dynamic system information
//常用选项:
    -d      //设置延迟时长,top -d 1表示每隔1秒刷新一次,默认每隔5秒刷新
    -b      //批模式翻屏显示,默认只实时显示一屏,若要显示后面的进程信息则可使用-b选项,与-n #合用,可指定显示翻#屏

[root@localhost ~]# top -b -n 1
top - 16:58:44 up  8:14,  2 users,  load average: 0.00, 0.01, 0.05
Tasks: 178 total,   1 running, 177 sleeping,   0 stopped,   0 zombie
%Cpu(s):  0.0 us,  0.0 sy,  0.0 ni,100.0 id,  0.0 wa,  0.0 hi,  0.0 si,  0.0 st
KiB Mem :   999720 total,   575768 free,   148504 used,   275448 buff/cache
KiB Swap:  2097148 total,  2097148 free,        0 used.   670936 avail Mem

   PID USER      PR  NI    VIRT    RES    SHR S  %CPU %MEM     TIME+ COMMAND
     1 root      20   0  190888   3776   2504 S   0.0  0.4   0:01.14 systemd
     2 root      20   0       0      0      0 S   0.0  0.0   0:00.01 kthreadd
     3 root      20   0       0      0      0 S   0.0  0.0   0:00.00 ksoftirqd/0
     5 root       0 -20       0      0      0 S   0.0  0.0   0:00.00 kworker/0:0H
     7 root      rt   0       0      0      0 S   0.0  0.0   0:00.04 migration/0
     8 root      20   0       0      0      0 S   0.0  0.0   0:00.00 rcu_bh
     9 root      20   0       0      0      0 S   0.0  0.0   0:00.83 rcu_sched


load average:1分钟,5分钟,15分钟
    load average    //CPU队列中等待运行的任务的个数
cpu(s):多颗CPU平均负载,按1键显示每颗CPU平均负载。
    us  //表示用户空间;
    sy  //表示内核空间;
    ni  //表示调整nice值,CPU占用的比率;
    id  //表示空闲百分比;
    wa  //表示等待IO完成所占据的时间百分比;
    hi  //表示hard interrupt,硬件中断占据的时间百分比;
    si  //表示软中断占据的时间百分比;
    st  //表示steal,被虚拟化技术偷走的时间(比如运行虚拟机)
PR      //优先级
NI      //nice值
VIRT    //虚拟内存集
RES     //常驻内存集
SHR     //共享内存大小
S       //进程状态


//top命令交互式子命令:
    M   //根据驻留内存大小进行排序,默认根据CPU百分比排序
    P   //根据CPU使用百分比进行排序
    T   //根据累计时间(占据CPU时长)进行排序
    l   //是否显示平均负载和启动时间
    t   //是否显示进程和CPU状态相关信息
    m   //是否显示内存相关信息
    c   //是否显示完整的命令行信息
    q   //退出top命令
    k   //终止某个进程
    1   //显示所有CPU的信息
    s   //修改刷新时间间隔
