ida has many extensions mainstream debugger, such as windbg / gdb, etc., can be dynamic debugging binaries on the basis of a static analysis. But many debugger extension does not take into account ollydbg, inevitably think it is a shortcoming.
Recently I found a plug-in on GitHub: RET-Sync , not only to make up the gap to ollydbg ida support, but also additional support x64dbg / lldb debugger such as:

Before you can use plug-ins
1. Although the authors recommend the use vs2017 generation plug-in, but the bug vs2017, the proposed switch to other low version of the compiler. I found vs2013 can also generate a plug-in.
2. Compile generated windbg extensions need to distinguish between x86 / x64 version. x86-dll into C: \ Program Files (x86) \ Windows Kits \ 10 \ under Debuggers \ x86 \ winext directory; accordingly, x64-of dll into C: \ Program Files (x86) \ Windows Kits \ 10 \ Debuggers \ x64 \ directory under winext. Compiler-generated ollydbg1 expanded into ollydbg1 Menu Bar Options-Appearance- "UDD path" the path specified:

3. I use the IDA Pro 7.0. Since IDA7.0 built python2.7 and support x64-bit systems, therefore, need to install python2.7 x86-64 version, or encountered such as < summary python problems encountered by IDA > wonderful variety of issues mentioned in the article .
4. Copy all files in the directory to the IDA ext_ida plugins directory:
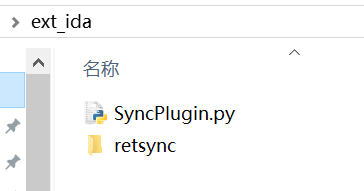 --->
--->
Use plug-ins
1. First load the binary to be debugged in IDA, save (Ctrl + W) generated idb file. Used herein do of #ParadoxX Crackmes.cf in Level1 example, load and save AC1D.Materie.exe ultimately produce AC1D.Materie.idb, as shown:

2.IDA start rer-sync plugin, Edit-Plugins- "ret sync":

Will pop ret sync plug-in window, if set up right in front of the environment, IDA will output the Output window:

[sync] form create
Note: FormToPyQtWidget: importing 'sip' module into <module '__main__' from ''>
[sync] default idb name: AC1D.Materie.exe
[*] sync enabled <----------------------------sync插件加载成功
[*] init_broker
[*] cmdline: "C:\Python27\python.exe" -u "D:\Program Files\IDA
...
[sync] name AC1D.Materie.exe
[sync] module base 0x400000
[sync] hexrays #7.0.0.170914 found
[sync] hexrays version >= 7.2 is needed
[*] broker new state: Starting
[*] broker new state: Running
[*] broker started
...
[*] << broker << dispatcher not found, trying to run it
[*] << broker << dispatcher now runs with pid: 4464
[*] << broker << connected to dispatcher
[*] << broker << listening on port 61085 <-----------sync开始侦听并等待调试器链接
3. Look output IDA, the feeling ret sync run on IDA is a server-side plug-ins; to work properly, you also need to connect the client. Our clients of course, is running ret sync extension windbg / ollydbg up. First with ollydbg show you.
4. Load AC1D.Materie.exe in the ollydbg
After ollydbg loaded, eip may point where the space system module. We need to set the initial break location
"Debugging options"-Events-Make first pause at"-"Entry point of main moudle"

Why so set? According to the authors ret sync explanation, only when idb same name as the module and the IDA Eip where the debugger is generated, plug-ins began to work! Can be determined according od "Memory Map" block diagram and CPU window, my ollydbg currently meet the plug conditions of:

Click plugins- "ret sync plugin" -sync, IDA disassemly this time window corresponding to an instruction will turn yellow, while the output window:

[*] << broker << dispatcher now runs with pid: 4464
[*] << broker << connected to dispatcher
Press F7 / F8 in that the EIP Ollydbg the down run, IDA yellow highlight cursor change will follow:

Ah, really is a good plug-in, I like
