Chapter 3 Mysql architecture and performance optimization and indexing
3.1 Mysql architecture
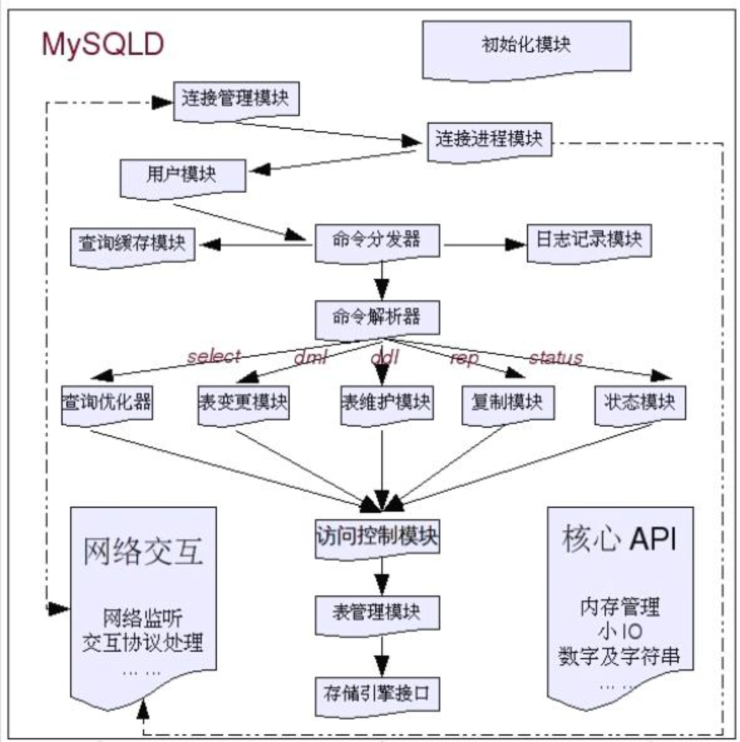
1. a logic chart:

2. Logical Architecture Figure 2:
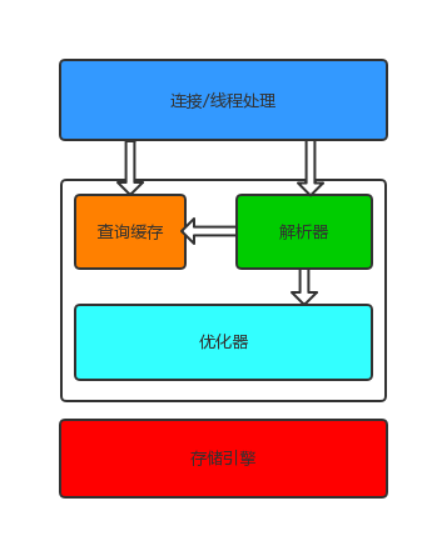
3. Execution Flow:
3.2 storage engine description:
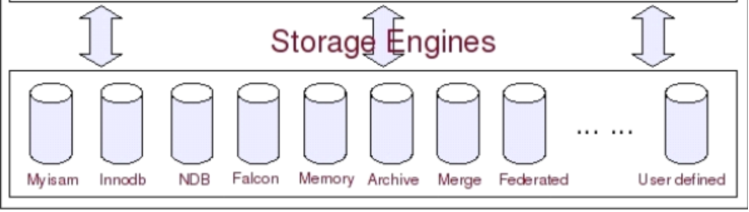
* Multi storage engine mysql database is different from the other one of the major characteristics;
* Storage engine for the table
* After MySQL 5.5, the default storage engine by the MyISAM changes to InnoDB .
* View storage engine : Show Engines;
|
|
Innodb |
Myisam |
| File storage |
.frm table definition file .ibd data file |
.frm table definition file .myd data file .myi index file |
| lock |
Table locks, row lock |
Table lock |
| Affairs |
ACID |
not support |
| CRDU |
Read, write |
Read Multiple |
| count |
Sweep table |
Local specialized storage |
| Index Structure |
B+ Tree |
B+ Tree |
3.1 index storage structure:
-
B Tree and B + Tree Characteristics and differences
* Height of the tree are generally in the 2-4 this height, directly affect the height of the tree the number of IO read and write.
* If there are three tree --- supporting data may reach 20G, if the tree structure --- four supporting data may reach tens T
* B Tree and B + Tree biggest difference is that the question of whether to store data non-leaf nodes. B Tree non-leaf nodes and the leaf nodes are stored data. And B + Tree leaf nodes will only store data, and the data are stored on a single line, and these are all the data pointer, i.e. the sequence.
-
Non-clustered index
* 叶子节点只会存储数据行的指针,简单来说数据和索引不在一起,就是非聚集索引。
* 主键索引和辅助索引都会存储指针的值
-
聚集索引(InnoDB)
* 主键索引(聚集索引)的叶子节点会存储数据行,也就是说数据和索引是在一起,这就是聚集索引。
* 辅助索引只会存储主键值
* 如果没有没有主键,则使用唯一索引建立聚集索引;如果没有唯一索引,MySQL会按照一定规则创建聚集索引。
3.2 Mysql性能优化之慢查询
MySQL 数据库有一个“慢查询日志”功能,
MySQL的慢查询日志功能,默认是关闭的,需要手动开启。
查看是否开启慢查询功能,slow_query_log_file=OFF则没有开启,若为ON则为开启;

临时开启慢查询功能:
在 MySQL 执行 SQL 语句设置,但是如果重启 MySQL 的话将失效
mysql>set global slow_query_log = ON;
mysql>set global long_query_time = 1;
永久开启慢查询功能:
修改/etc/my.cnf配置文件,重启 MySQL, 这种永久生效.
[mysqld]
slow_query_log = ON
slow_query_log_file = /var/log/mysql/slow.log
long_query_time = 1
慢日志格式:
mysql>select sleep(3);
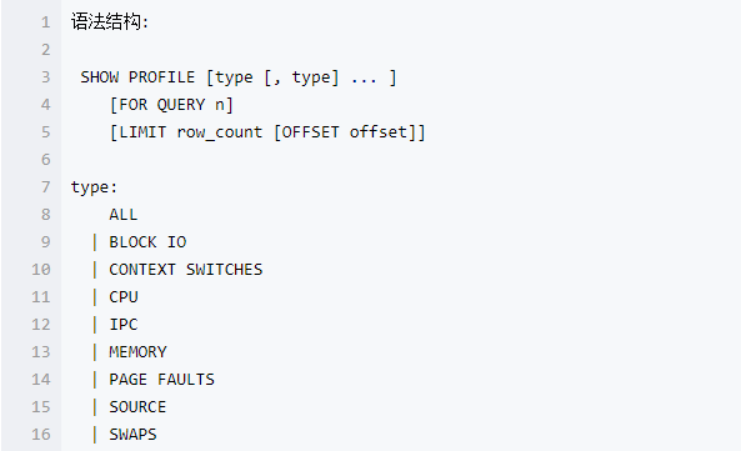
2.4 Mysql性能分析语句show profile
l Query Profiler是MYSQL自带的一种query诊断分析工具,通过它可以分析出一条SQL语句的性能瓶颈在什么地方。(通常需要手动开启)
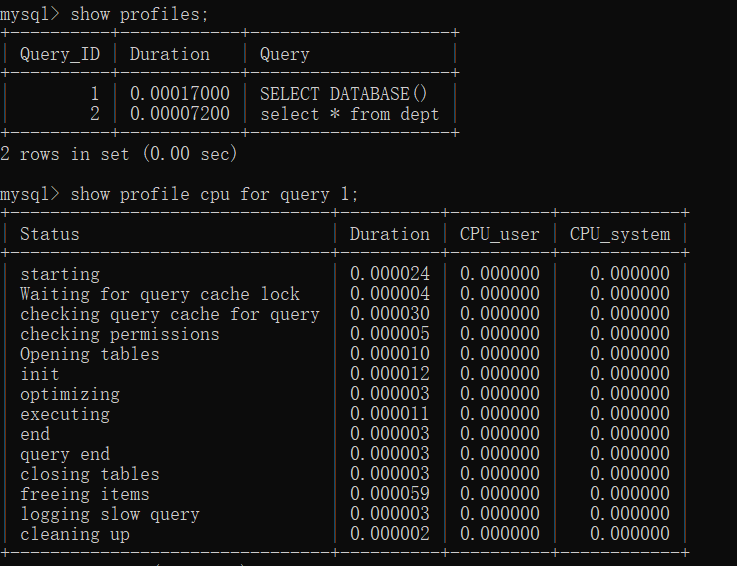
l show profile 和 show profiles 语句可以展示当前会话(退出session后,profiling重置为0) 中执行语句的资源使用情况.
l show profiles :以列表形式显示最近发送到服务器上执行的语句的资源使用情况.显示的记录数由变量:profiling_history_size 控制,默认15条
查看profile是否开启,OFF(关闭),ON(开启)
* select @@profiling;
* show variables like ‘%profil%’;
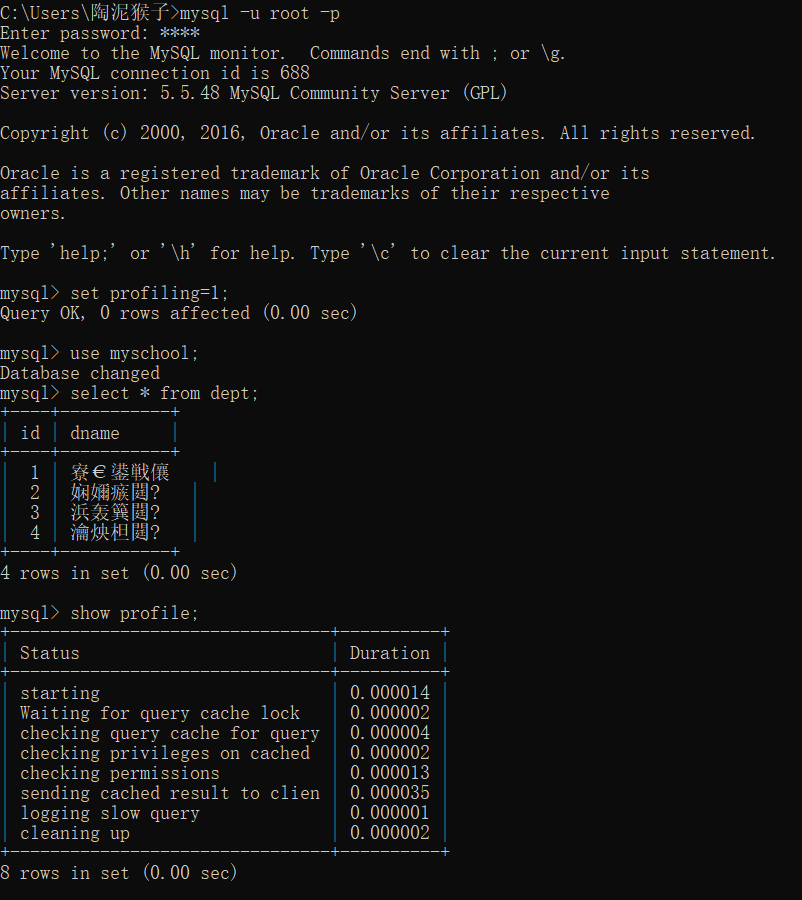
开启:set profiling=1;
2.4Mysql性能优化细节