Why iOS using too much memory will crash, performance will decline? Tencent game College expert Devlin in this article to explain how to make mobile games take up less memory? Starting memory consumption iOS real-time statistics.
First, the problem
Prior to the tour project in hand, excessive memory usage, all began to fall apart, so you have to do iOS memory statistics. There are several ways memory statistics: XCode memory usage statistics, UnityInternalProfile memory statistics, Mono memory statistics and other methods.
But XCode statistics need to connect the phone, UnityInternalProfile memory statistics and XCode memory statistics and the gap is too big, the memory time of the crash and who value a relationship? How they show the total amount of memory on the phone? Back on her own how to achieve a suitable memory statistics.
Second, test study
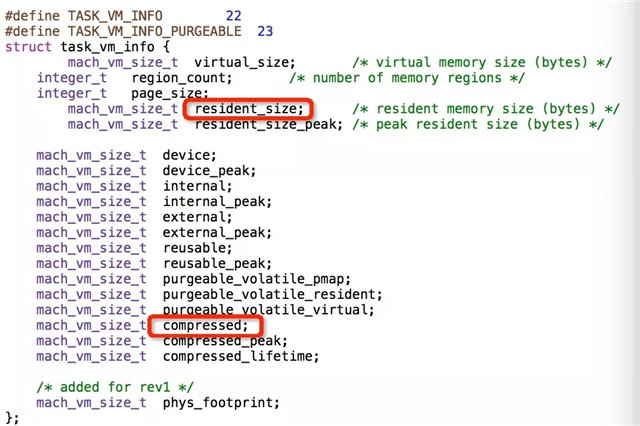
Studied under UnityInternalProfile, we found that it took a mach_base_task_info in the resident_size (physical memory footprint)
Then I did a test, every few frames are assigned to use a certain amount of memory, then print out the statistics xcode memory and resident_size.

The abscissa is time and the ordinate is the memory.
With the growth resident_size value memory growth, but the growth to a certain extent is not changed how, when speculation may have been compressed, information search (MacOS have to use memory compression technology) and the code found there task_vm_info iOS this structure, inside there are just compress this.
Then increase the output value of compress, re-test!

Memory usage continues to increase in the course, when resident_size (physical memory) no longer increases, compress the linear growth.
Third, the inference
It can be seen from FIG: actual memory usage = resident + compress. It can be that iOS to reduce the memory footprint by compressing memory.
And during the test, was found when the actual memory system to reach half the physical memory, the system will continue to send the warning memorywarning, Q will be 60% off App.
Fourth, the application
现在只需要实时拿到task_vm_info里的resident 和 compress 就可以统计App的实际内存的使用量了,对于Unity手机项目来说,需要写Native和C#代码,幸运的是,我已经帮你把代码写好了。
在XCodePostProcess::OnPostProcessBuild()里加入如下代码,会在Unity生成的XCode工程自动插入如下Native代码:
XClass AppRender = new XClass(pathToBuiltProject + "/Classes/UnityAppController+Rendering.mm");
if( AppRender != null)
{
string TCode = "";
TCode += "#include <mach/mach_time.h>\n";
TCode += "#include <mach/mach.h>\n";
TCode += "#include <mach/mach_host.h>\n";
TCode += "#include <mach/task_info.h>\n";
TCode += "#include <mach/task.h>\n";
TCode += "static float GetTotalPhysicsMemory( )\n";
TCode += "{\n";
TCode += " kern_return_t kr;\n";
TCode += " mach_msg_type_number_t info_count = TASK_VM_INFO_COUNT;\n";
TCode += " task_vm_info_data_t vm_info;\n";
TCode += " kr = task_info(mach_task_self(), TASK_VM_INFO, (task_info_t)&vm_info, &info_count);\n";
TCode += " if (kr == KERN_SUCCESS) return (float)(vm_info.compressed + vm_info.resident_size) / 1024.0 / 1024.0;\n";
TCode += " return 0;\n";
TCode += "}\n";
TCode += "extern \"C\" float _Get_Profiler_TotalPhysicMemory(){return _fLockStepPhysicMemory;}\n";
TCode += "extern \"C\" void UnityRepaint()";
AppRender.Replace("extern \"C\" void UnityRepaint()",TCode );
}
(左右滑动可查看全部代码)
在UnityC#里加入以下托管代码,调用 Get_Profiler_TotalPhysicMemory()即可实时拿到内存使用值。
#if ( UNITY_IPHONE && !UNITY_EDITOR )
[DllImport("__Internal")]
static extern float _Get_Profiler_TotalPhysicMemory( );
public static float Get_Profiler_TotalPhysicMemory( )
{
return _Get_Profiler_TotalPhysicMemory( );
}
#endif
(左右滑动可查看全部代码)
五、补充
由于系统有分页机制,即你申请使用1字节的内存,系统也有可能会给你一整页(16k大小的物理页),所以会导致这里的实际内存使用量(内存分页总和)与XCode内存统计(精确统计)不完成相等,但大致符合一定比例。