
First, the environment Introduction
System: Win7
the IDE: the Visual Studio 2017
Database: mysql 5.1
Framework: ASP.NET Core MVC + dapper
Second, the monitoring asp.net page
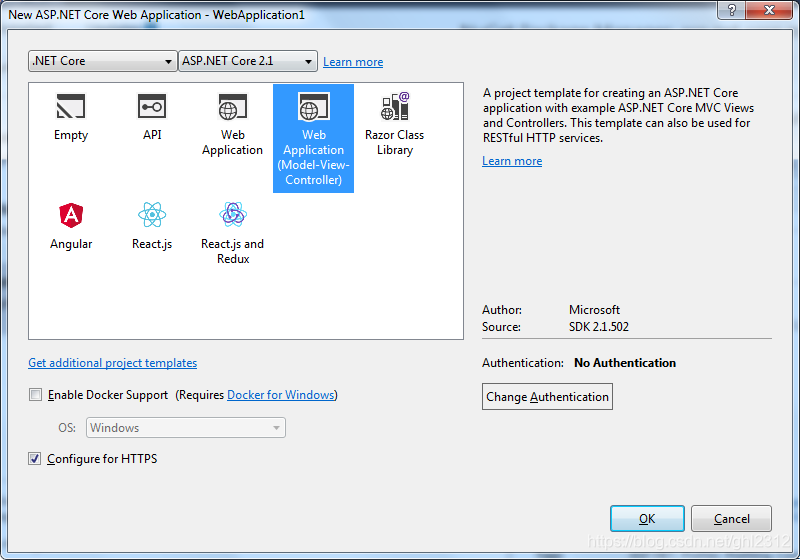
1. Create Asp.net Core the Application the Web, as shown in FIG:
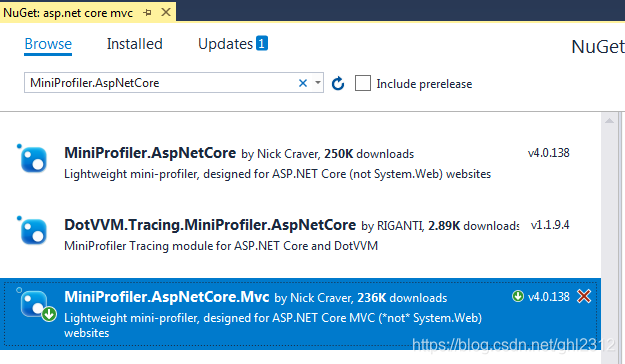
2. MiniProfiler.AspNetCore.Mvc download package from nuget, as shown in FIG:
3. Add the following code Startup.cs ConfigureServices Method:
services.AddMiniProfiler();
- 1
4. Add the following code Startup.cs Configure Method:
app.UseMiniProfiler();
- 1
5. Modify _ViewImports.cshtml
@using StackExchange.Profiling
@addTagHelper *, MiniProfiler.AspNetCore.Mvc
- 1
- 2
6. Modify _Layout.cshtml (Shared / _Layout.cshtml)
<mini-profiler />
- 1
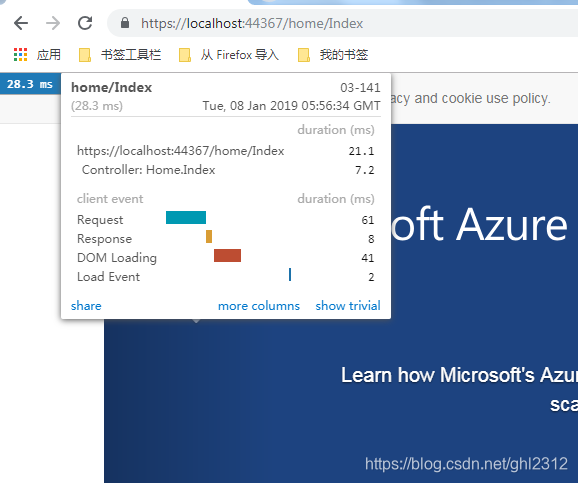
Run the project, view the execution results are as follows:
Three, sql monitor the execution of the sentence
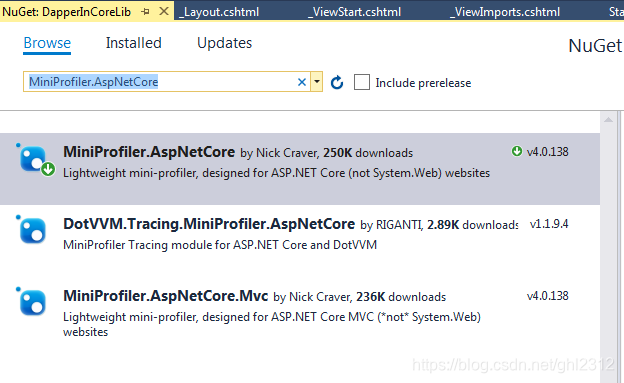
1. nuget MiniProfiler.AspNetCore downloaded from the package, as shown in FIG:
2. Modify Create database connection code, as follows:
_conn = new ProfiledDbConnection(new MySqlConnection(connectionString), MiniProfiler.Current);
- 1
Run the project, view the execution results in Figure:
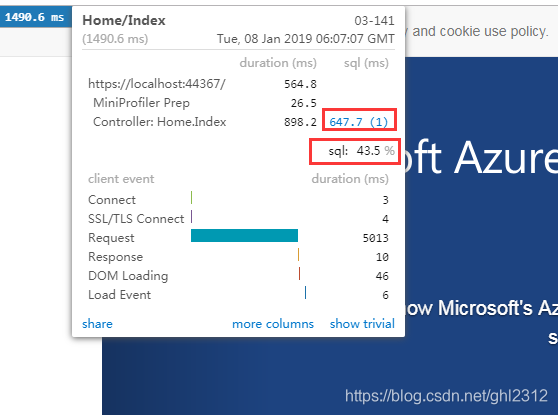
As can be seen queries using 647.7ms, occupying 43.5% of the time the page loads, click on the blue 647.7 can see the details of execution, as shown below:

so that we can monitor page load executed All sql statement.
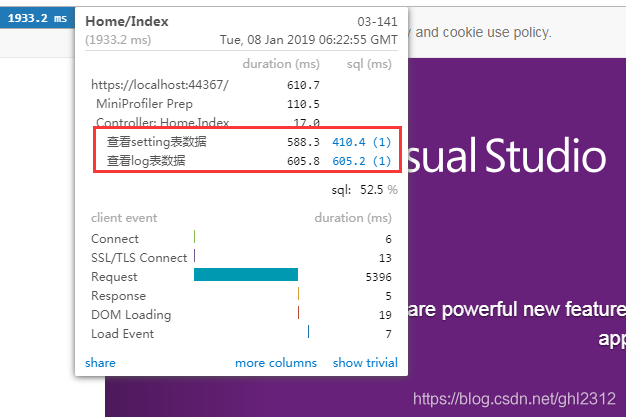
In a real project situation would be more complicated, for example: a page will exist to perform several or dozens of sql same time, how do to show clearly the case sql execute it? We can use MiniProfiler the Step method to classify statistics. Modify the code as follows:
     public IActionResult Index()
        {
            var dbSettings = _dbSettings;

            var dbInstance = DapperFactory.GetInstance(dbSettings);
            var dapper = dbInstance.GetDapper();
            var profiler = MiniProfiler.Current;
            using (profiler.Step("查看setting表数据"))
            {
                var query = dapper.GetList<Setting>("select * from setting");
            }

            using (profiler.Step("查看log表数据"))
            {
                var query = dapper.GetList<Log>("select * from log");
            }

            return View();
        }
- 1
- 2
- 3
- 4
- 5
- 6
- 7
- 8
- 9
- 10
- 11
- 12
- 13
- 14
- 15
- 16
- 17
- 18
- 19
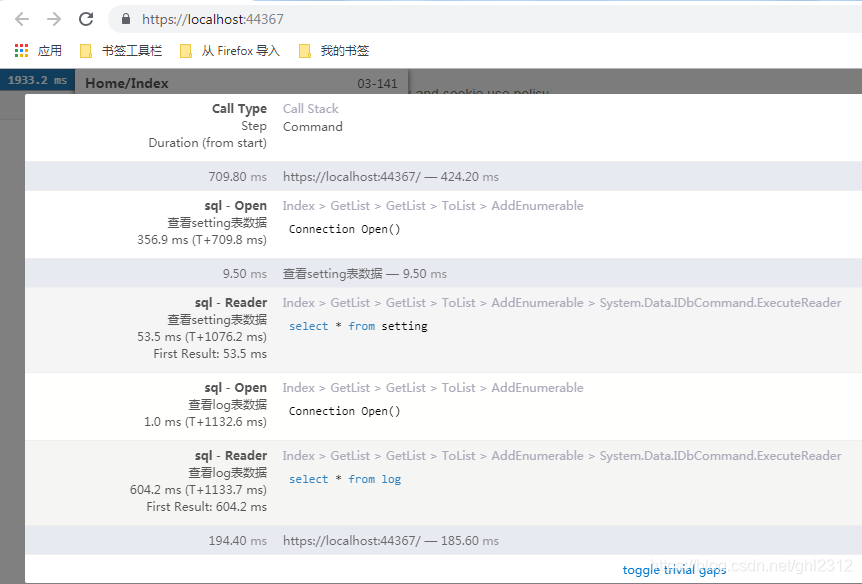
Check the implementation of the Figure:
PS:
miniprofiler document's official website address: https://miniprofiler.com/dotnet/
