Stream delay calculation process is very important to monitor a metric
flink to open after the latency through the open configuration metrics.latency.interval can see askManagerJobMetricGroup / operator_id / operator_subtask_index / latency metrics in the metric
If every piece of data are marked with time monitor output Time - Enter the time, it will consume a lot of performance
Look flink own latency monitoring is how to do
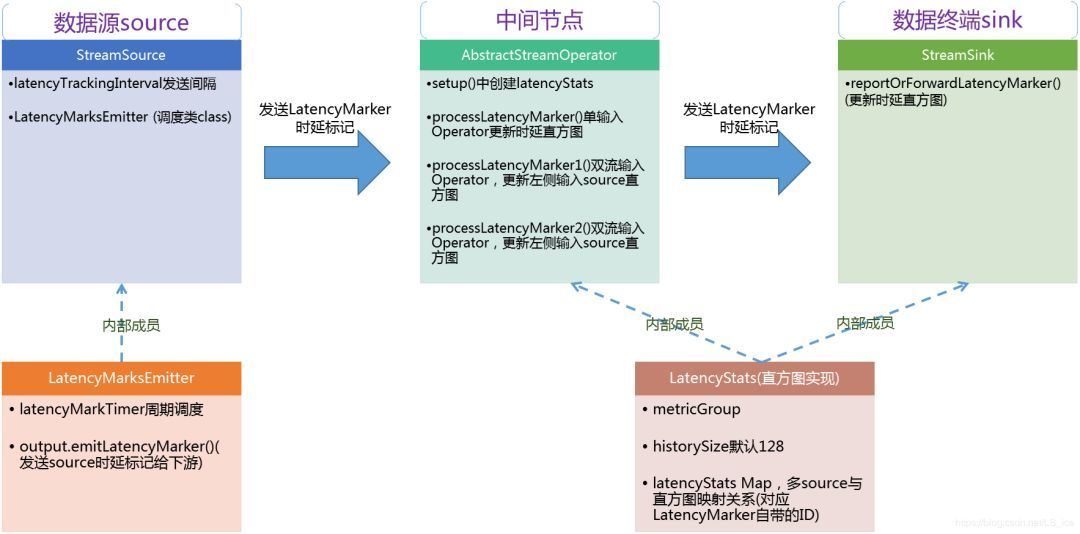
In fact, it is also conceivable principle is very simple, that is periodically insert a special source of data LatencyMarker
LatencyMarker initialization time when it will take time to produce
Each time data is received task when he LatencyMarker with the current time - LatencyMarker time = lateTime sent metrics collection system
Then continues downstream to emit this LatencyMarker
How to look at the source code are implemented
Because it is fed from the source LatencyMarker look StreamSource.java
In the run method of StreamSource

Initiated a LatencyMarksEmitter
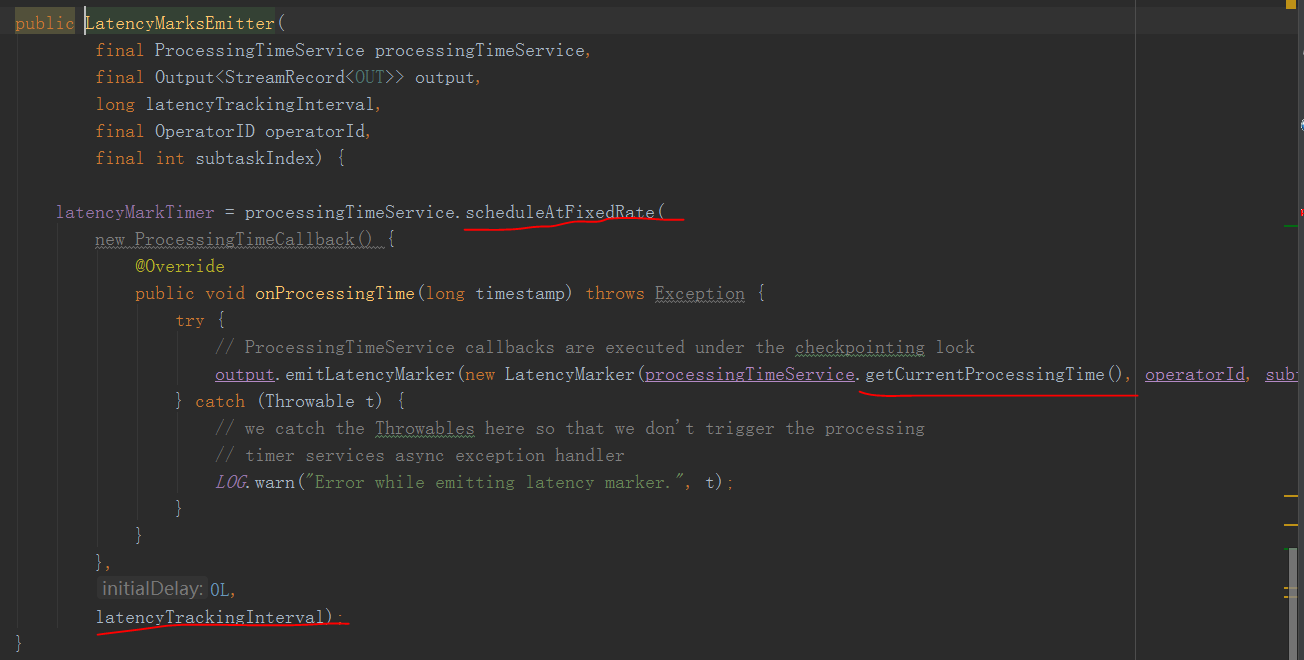
In fact, processTimeServera periodic (long metrics.latency.interval we set) whereabouts LatencyMarker downstream emit current time
Then came the task to receive local data
The method of processInput StreamInputProcessor
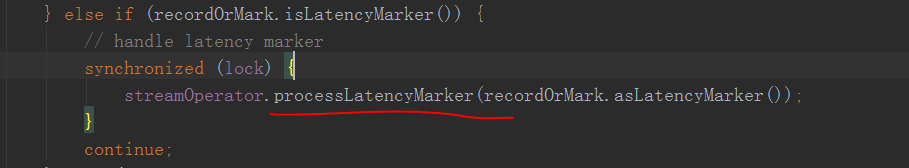
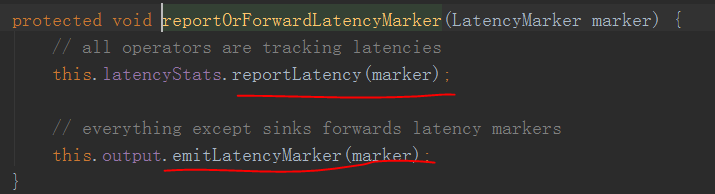

We can see that with the current time - LatencyMarker, then go out into the report is sent, and then emit
The sink operator only difference is
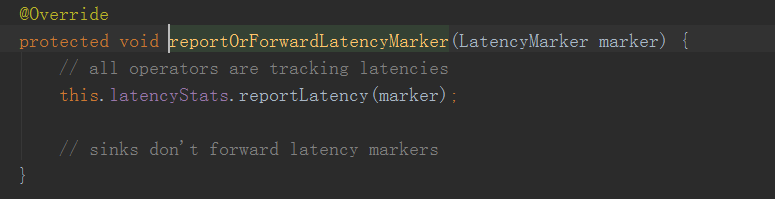
The difference is not emit LatencyMarker sink because it is the last thing the operator
Here it is finished
Note that the point is:
其实可以看到flink中的LatencyMarker是没有走用户代码逻辑的,也就是说统计出来的延迟时间并不是端到端的,而是除了用户逻辑处理外的延迟,
因为LatencyMarker和数据的处理是同步处理的,虽然监控延迟中没有过用户逻辑代码(正常数据接收以后用户代码处理然后emit,LatencyMarker接收后直接emit)
但是就像马路一样,整个马路拥塞了延迟高了,那还是会使这个指标值越来越大
可能这样的设计是考虑到LatencyMarker如果也走用户处理逻辑的话会消耗过多的性能吧,特别是采集频繁的时候