First, set the parameters of the garbage collector
-XX: + UseSerialGC, the default value of the virtual machine in the Client mode, Serial + Serial Old
-XX: + UseParNewGC, ParNew + Serial Old, In JDK1.8 has been deprecated and will be removed (Java HotSpot (TM) Client VM warning: Using the ParNew young collector with the Serial old collector is deprecated and will likely be removed in a future release).
-XX:+UseConcMarkSweepGC,ParNew+CMS
-XX: + UseParallelGC, the default value of the virtual machine in the Server mode, Parallel Scavenge + Serial Old
-XX:+UseParallelOldGC ,Parallel Scavenge+Parallel Old
-XX:+UseG1GC,G1 Young Generation+G1 Old Generation
Second, the use of Java code testing
{class GCTest public
    public static void main (String [] args) {
        // - XX: + UseParallelOldGC and -XX: + UseParallelGC As a result, since MXBean name, but not the same as actually used
        List <GarbageCollectorMXBean> garbageCollectorMXBeans = ManagementFactory. getGarbageCollectorMXBeans ();
        for (GC of GarbageCollectorMXBean: garbageCollectorMXBeans) {
            System.out.println (gc.getName ());
            System.out.println ( "-");
        }
    }
}
I use JDK1.8 test here, enter the JVM startup parameters -XX: + PrintCommandLineFlags, this parameter will print JVM default optimization parameters.
Test Results:
1, specify the parameters -XX: + PrintCommandLineFlags -XX: + UseSerialGC
-XX:InitialHeapSize=16777216 -XX:MaxHeapSize=268435456 -XX:+PrintCommandLineFlags -XX:-UseLargePagesIndividualAllocation -XX:+UseSerialGC
Copy
--
MarkSweepCompact
--
2, specify the parameters -XX: + PrintCommandLineFlags -XX: + UseParNewGC
-XX:InitialHeapSize=16777216 -XX:MaxHeapSize=268435456 -XX:+PrintCommandLineFlags -XX:-UseLargePagesIndividualAllocation -XX:+UseParNewGC
ParNew
--
MarkSweepCompact
--
Java HotSpot(TM) Client VM warning: Using the ParNew young collector with the Serial old collector is deprecated and will likely be removed in a future release
3, specify the parameters -XX: + PrintCommandLineFlags -XX: + UseConcMarkSweepGC
-XX:InitialHeapSize=16777216 -XX:MaxHeapSize=268435456 -XX:MaxNewSize=89481216 -XX:MaxTenuringThreshold=6 -XX:OldPLABSize=16 -XX:+PrintCommandLineFlags -XX:+UseConcMarkSweepGC -XX:-UseLargePagesIndividualAllocation -XX:+UseParNewGC
ParNew
--
ConcurrentMarkSweep
--
4, specify the parameters -XX: + PrintCommandLineFlags -XX: + UseParallelGC
-XX:InitialHeapSize=16777216 -XX:MaxHeapSize=268435456 -XX:+PrintCommandLineFlags -XX:-UseLargePagesIndividualAllocation -XX:+UseParallelGC
PS Scavenge
--
PS MarkSweep
--
5, specify the parameters -XX: + PrintCommandLineFlags -XX: + UseParallelOldGC
-XX:InitialHeapSize=16777216 -XX:MaxHeapSize=268435456 -XX:+PrintCommandLineFlags -XX:-UseLargePagesIndividualAllocation -XX:+UseParallelOldGC
PS Scavenge
--
PS MarkSweep
--
6, specify the parameters -XX: + PrintCommandLineFlags -XX: + UseG1GC
-XX:InitialHeapSize=16777216 -XX:MaxHeapSize=268435456 -XX:+PrintCommandLineFlags -XX:+UseG1GC -XX:-UseLargePagesIndividualAllocation
G1 Young Generation
--
G1 Old Generation
--
Third, use the built-JConsle View
1, write a code that has been run
public class GCTest {
    public static void main(String[] args) throws InterruptedException {
        while (true) {
            Thread.sleep(1000);
        }
    }
}
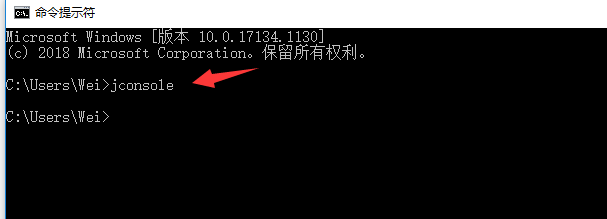
2, open a command line, enter jconsole
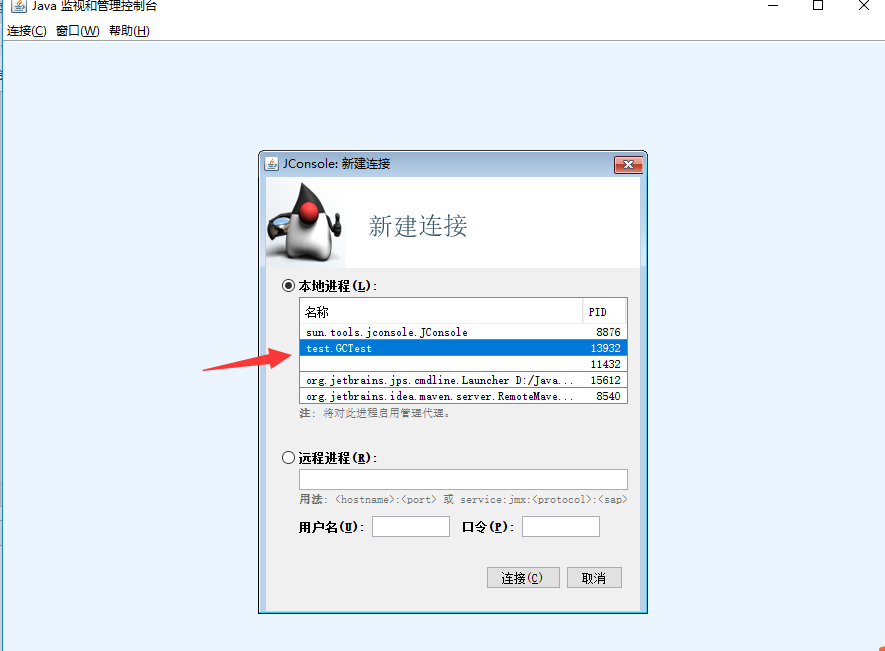
3, showing the connection of a Java program
4, see the VM Summary

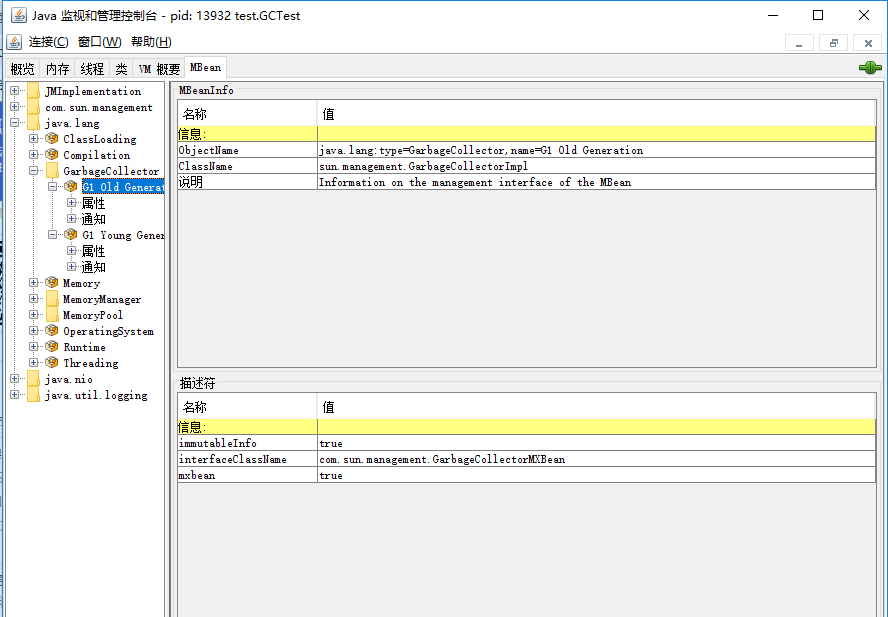
5, can also be viewed in the MBean
IV Summary
-XX: + UseParallelGC and -XX: + UseParallelOldGC addition to the different JVM parameters, print results are the same, because the same set MXBean name, specific can look at this article: https: //www.cnblogs.com/kelthuzadx /p/10924117.html