This example describes the tutorial Pinpoint
Pinpoint installation and deployment reference: [APM] Pinpoint installation and deployment (a)
Check the call relationship application topology
Enter pintpoint- "select application -> select View time period, you can view the application calls the relationship topology, graphic follows:
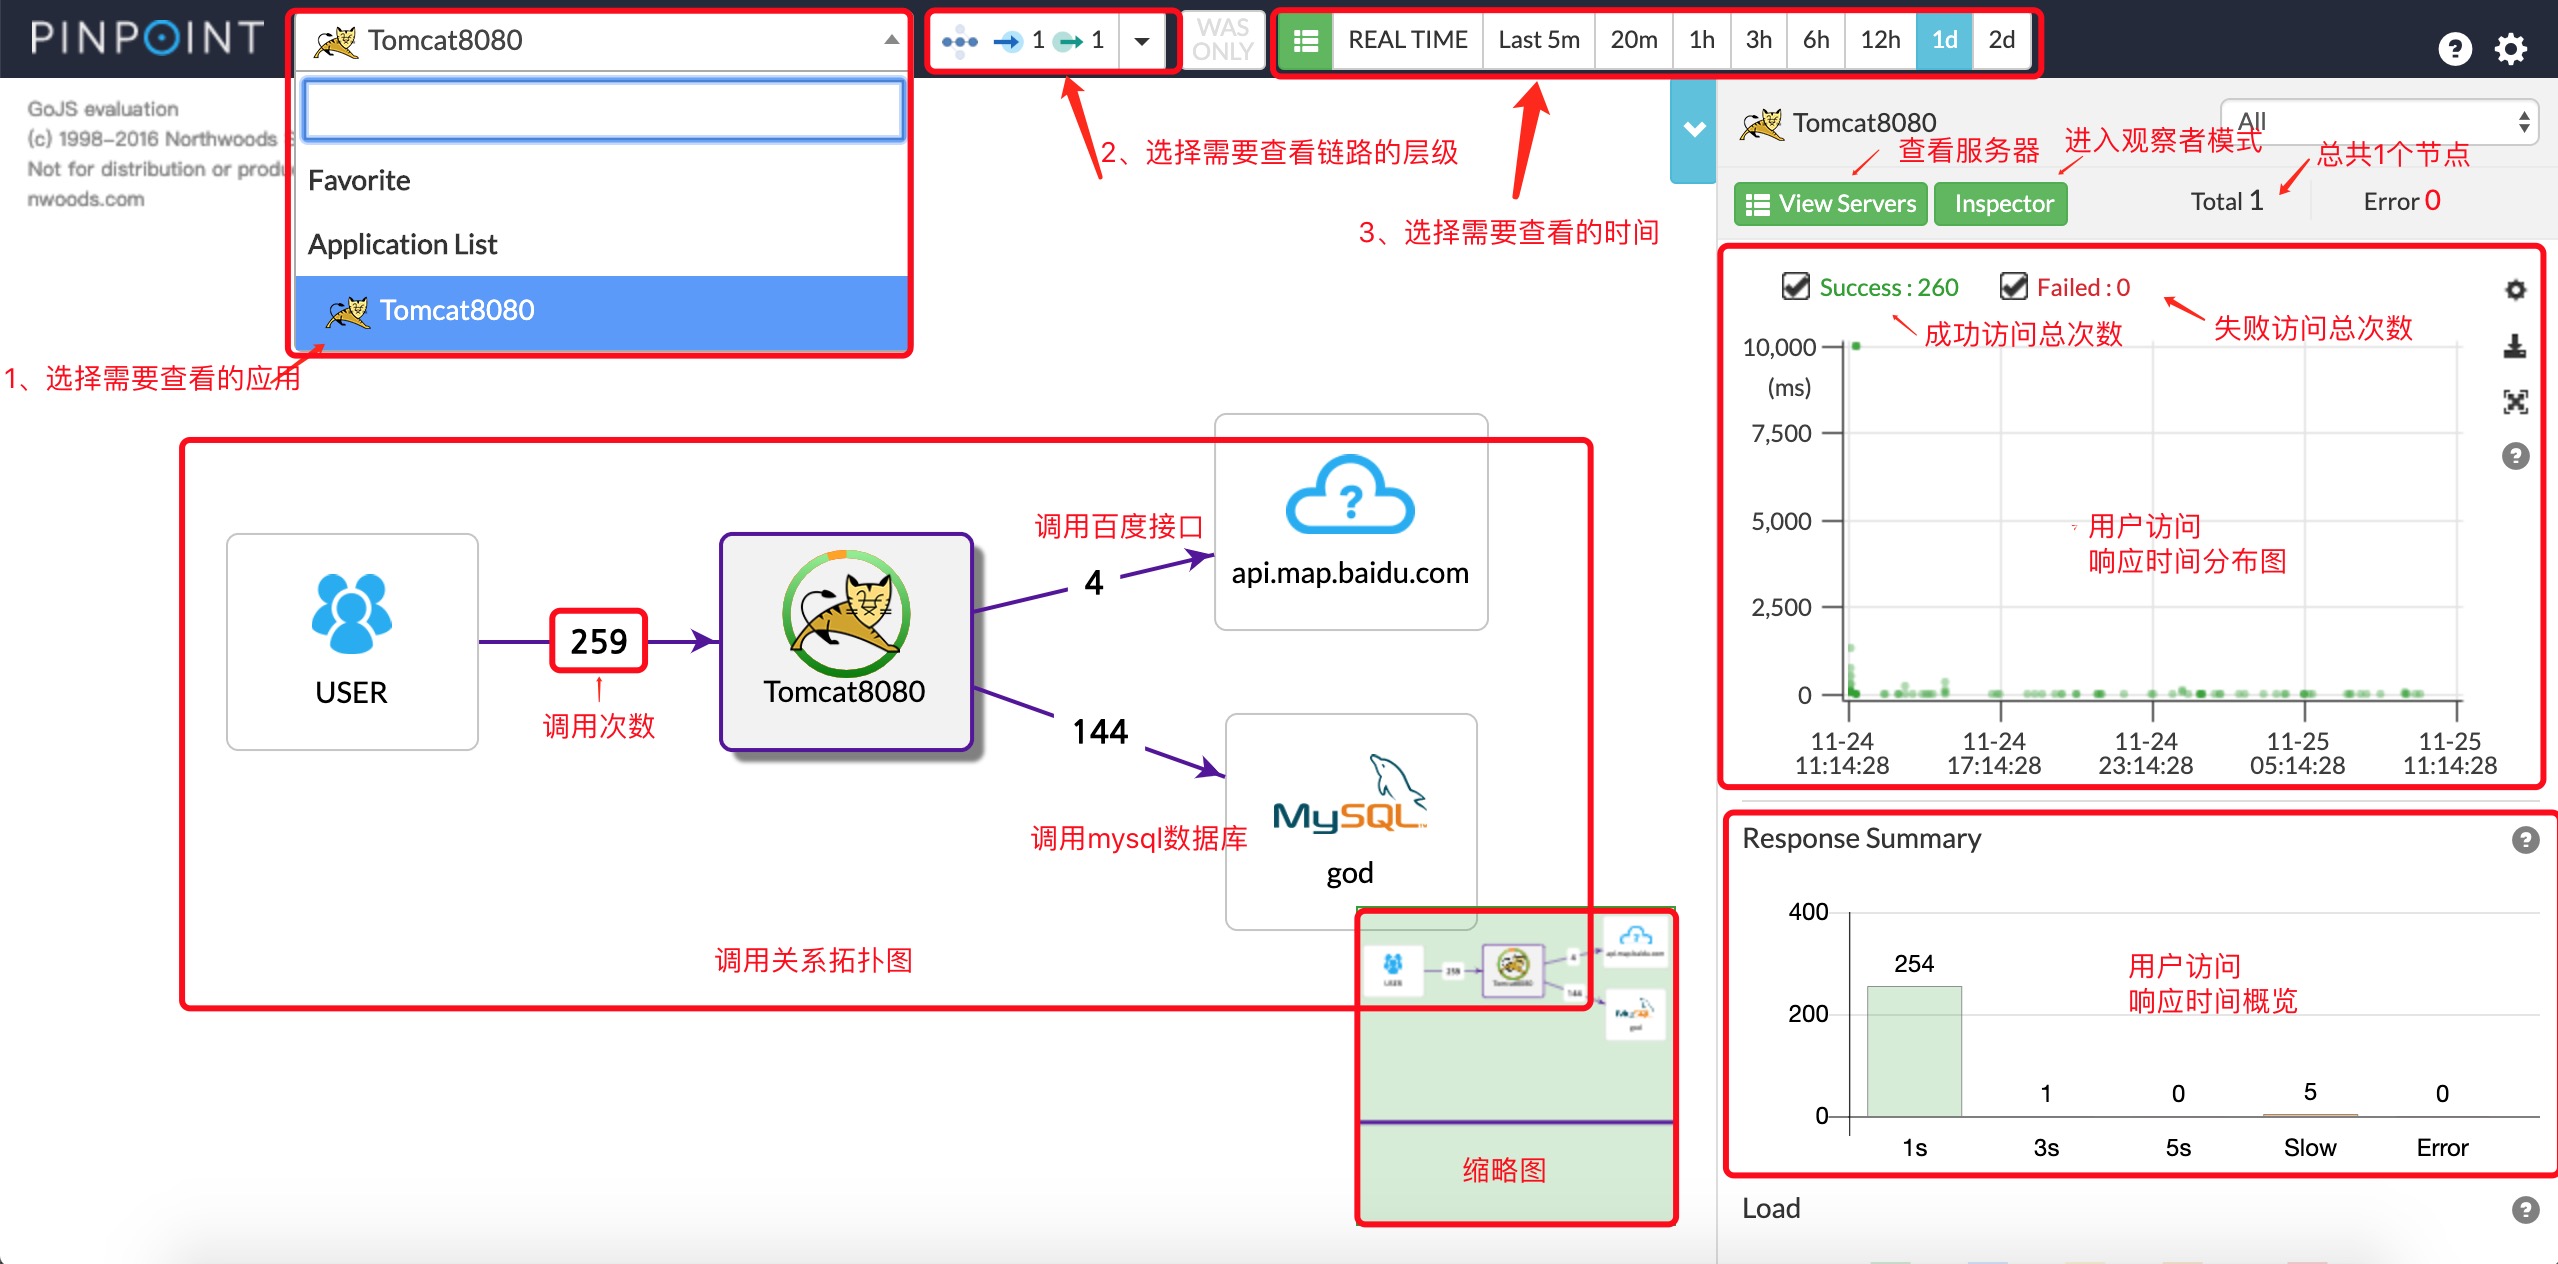
By the map, you can see a call between an application and the number of calls to the left, to facilitate the deployment analysis
It may be distributed to the right in FIG response time, long time each time the user can access analysis, a time-out occurs in response to a timely manner.
View calling the case a single node application
Click right View Servers- "left selection popup correspondent node -" to show the call intermediate portion of this node
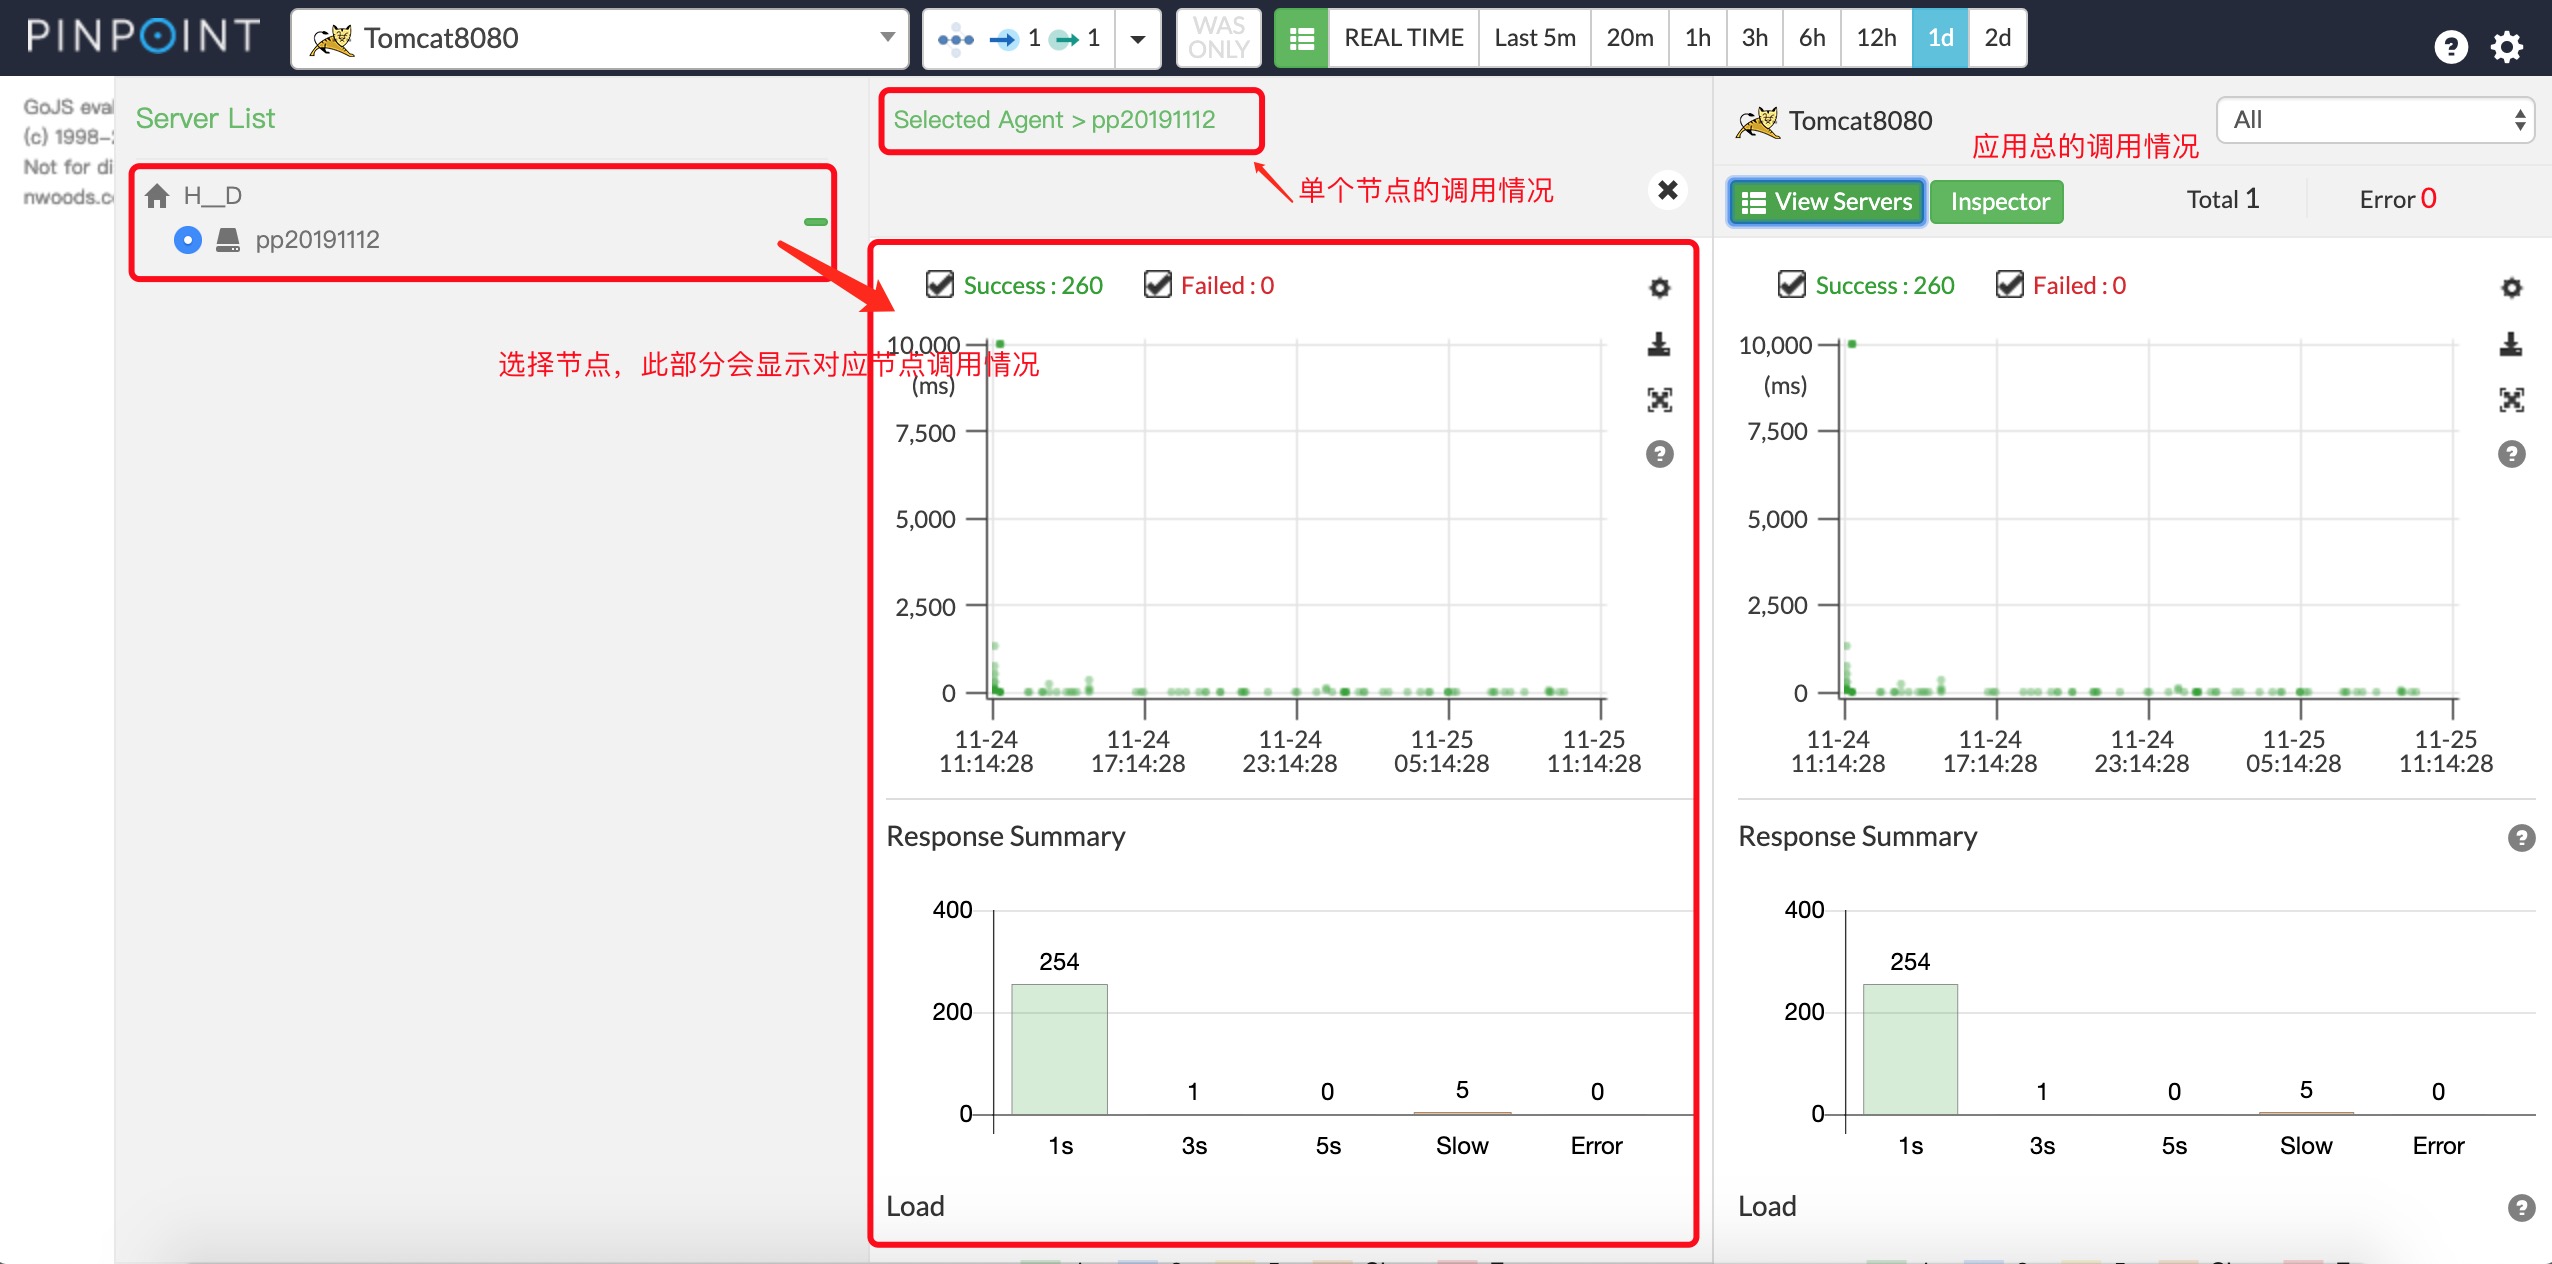
By the figure, it can be targeted to a single node visits were analyzed
Call request analysis section case
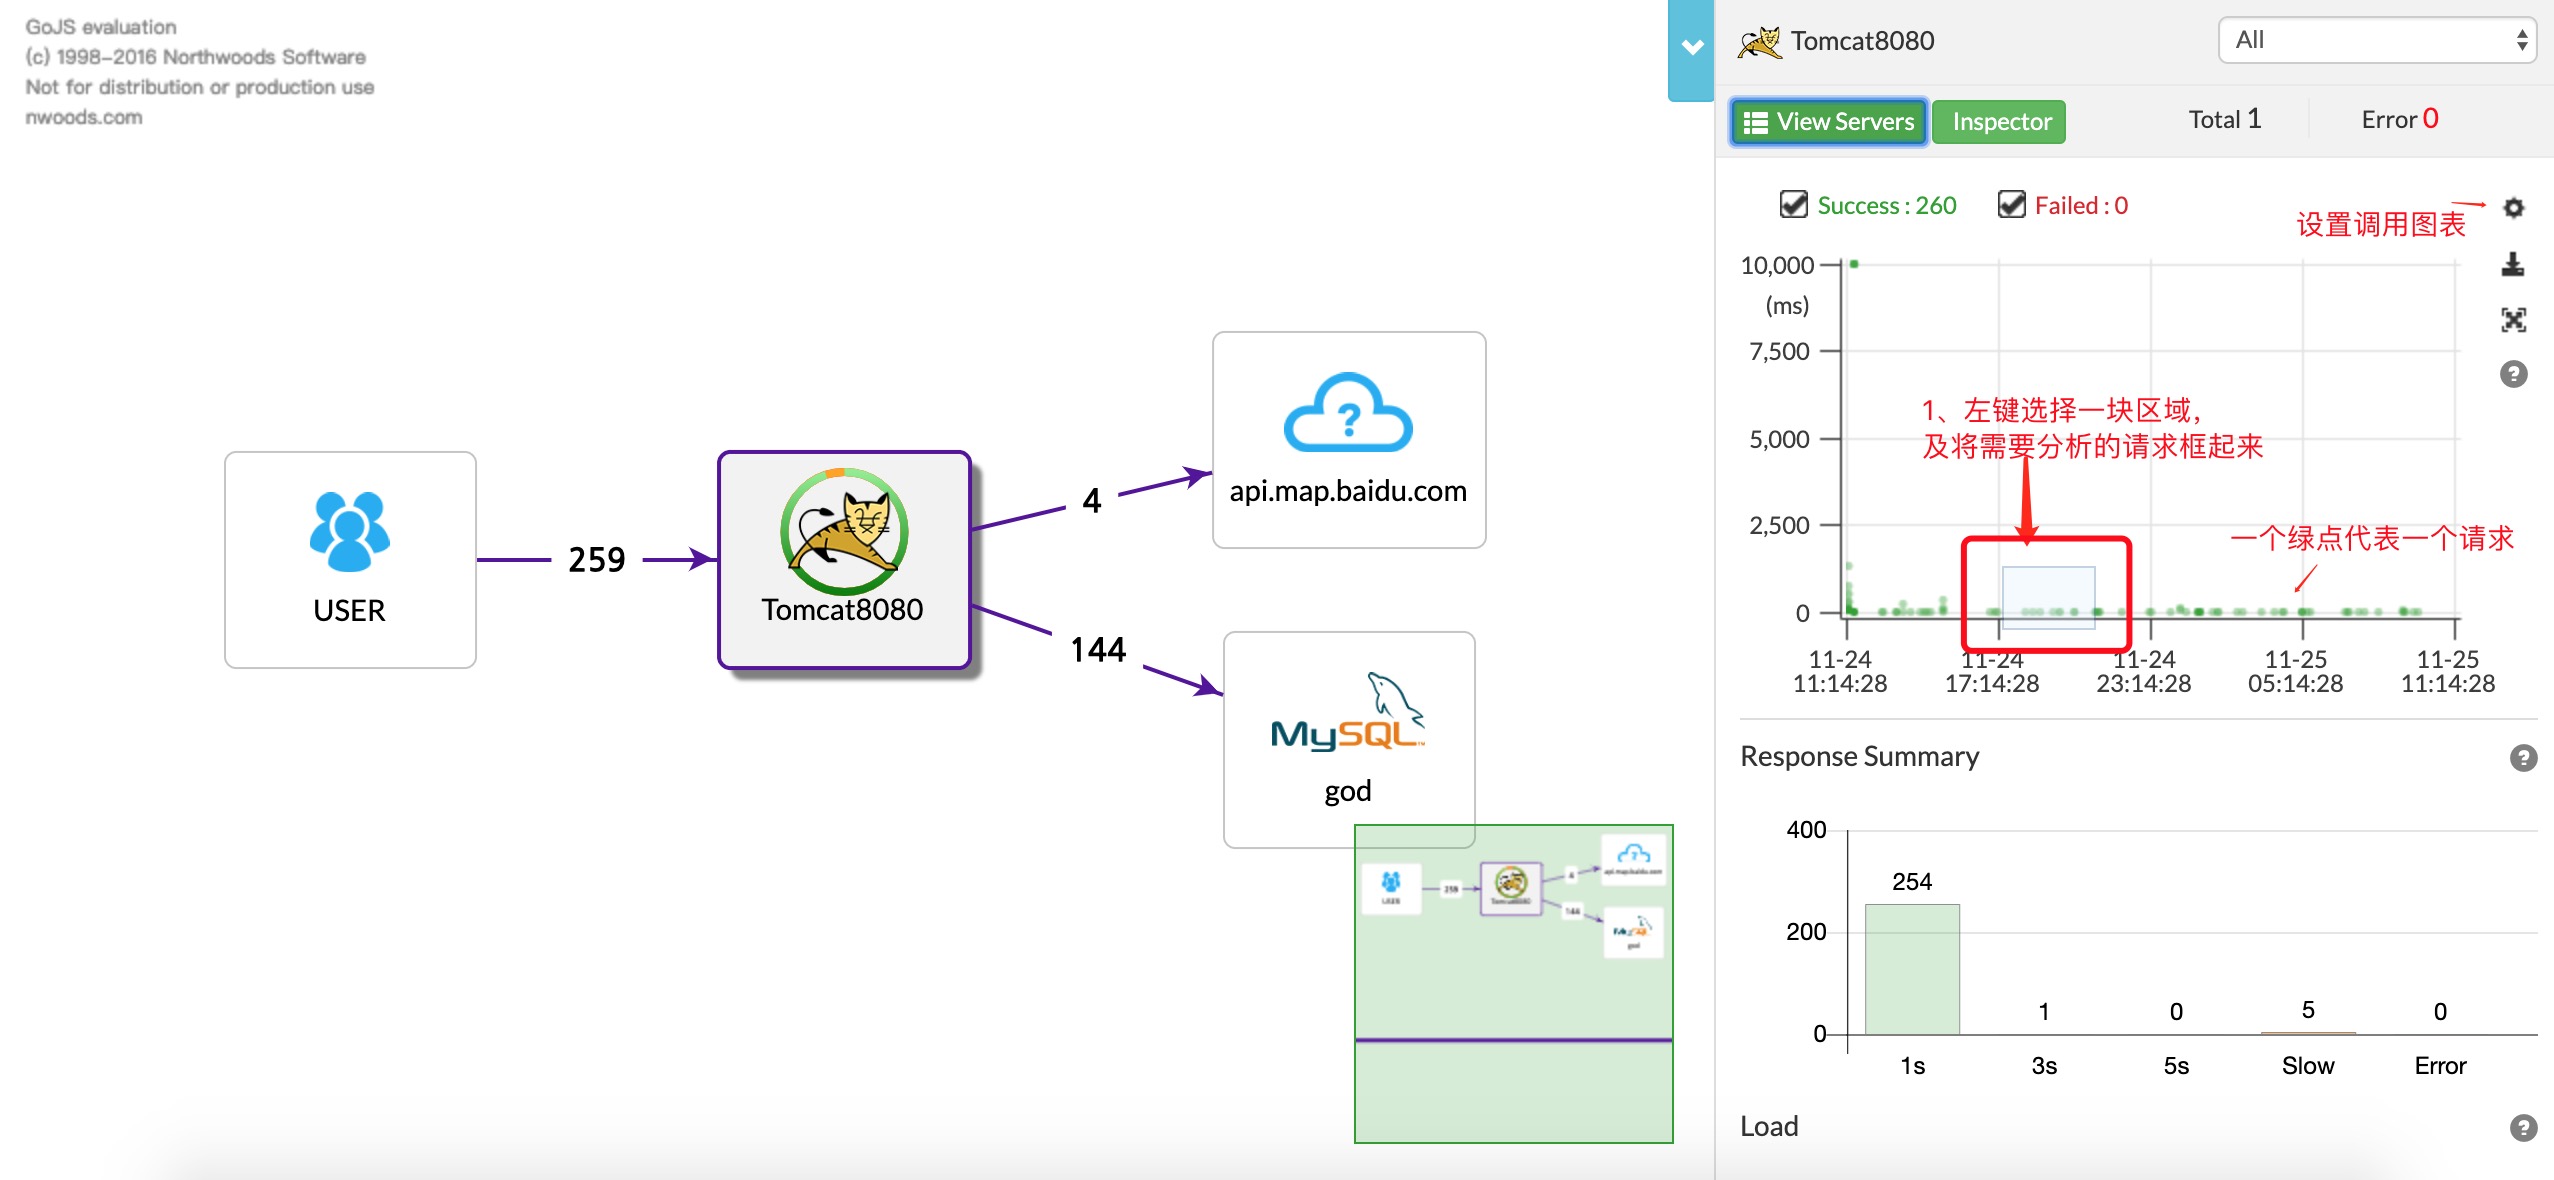
The response time profile - "Left selection of needs analysis request -" pop-up selection request list page - "Select a request in the list -" The lower screen displays information request call tree
Pop-up list to select the page request

Through this section, the analysis can be performed on a single request, a request to view a good thing in all aspects, as well as information on abnormalities occur, facilitate the development of timely positioning problems. The lower half Server Map, Timeline, Mixed View this request is to help you analyze the situation.
View single node application server case
Click on the right Inspector- "pop-Server Interface situation -" Select View node server

By interface analysis, you can see the basic information of the server, memory usage and applications. There are various lower half of the table, look at the situation needs its own use.