How to check hard to resolve the issue:
--捕获出需要使用绑定变量的SQL
drop table t_bind_sql purge;
create table t_bind_sql as select sql_text,module from v$sqlarea;
alter table t_bind_sql add sql_text_wo_constants varchar2(1000);
create or replace function
remove_constants( p_query in varchar2 ) return varchar2
as
l_query long;
l_char varchar2(10);
l_in_quotes boolean default FALSE;
begin
for i in 1 .. length( p_query )
loop
l_char := substr(p_query,i,1);
if ( l_char = '''' and l_in_quotes )
then
l_in_quotes := FALSE;
elsif ( l_char = '''' and NOT l_in_quotes )
then
l_in_quotes := TRUE;
l_query := l_query || '''#';
end if;
if ( NOT l_in_quotes ) then
l_query := l_query || l_char;
end if;
end loop;
l_query := translate( l_query, '0123456789', '@@@@@@@@@@' );
for i in 0 .. 8 loop
l_query := replace( l_query, lpad('@',10-i,'@'), '@' );
l_query := replace( l_query, lpad(' ',10-i,' '), ' ' );
end loop;
return upper(l_query);
end;
/
update t_bind_sql set sql_text_wo_constants = remove_constants(sql_text);
commit;
set linesize 266
--- End after performing the above action, the following SQL statement can complete unbound variables statement statistics
A30 sql_text_wo_constants the format COL
COL Module1 the format A30
COL the format the CNT 999999
SELECT sql_text_wo_constants, Module1, COUNT (*) the CNT
from t_bind_sql
Group by sql_text_wo_constants, Module1
HAVING COUNT (*)> 100
Order by desc. 3;
- Note: The test may be considered the following script
Table T purge drop;
Create Table T (X int);
SELECT * WHERE rownum MYSTAT from V $ =. 1;
the begin
for I in. 1 .. 100000
Loop
Execute immediate
'INSERT INTO T values (' || || I ')' ;
End Loop;
the commit;
End;
/
attached: results of part posted
-------------------------------------------------- -------------------------------------------------- -
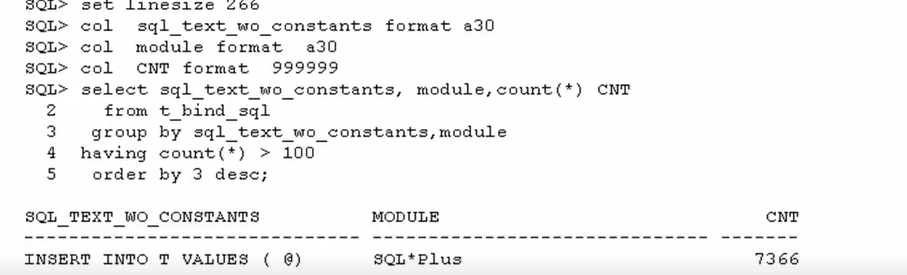
SQL> --- after performing the above action, the following SQL statement can complete unbound variables statement statistics
SQL> LINESIZE the SET 266
SQL> COL sql_text_wo_constants format A30
SQL> COL Module format A30
SQL> COL CNT format 999999
SQL> sql_text_wo_constants SELECT, Module1, COUNT (*) the CNT
2 from t_bind_sql
. 3 by sql_text_wo_constants Group, Module1
. 4 HAVING COUNT (*)> 100
. 5 Order by desc. 3;
sQL_TEXT_WO_CONSTANTS the MODULE the CNT
-------------- ---------------- ------------------------------ ---- ---
INSERT INTO T VALUES (@) SQL * Plus 7366
Bind variables does not suit the scene:
--- T 1 Construction of tables, data, and the primary key.
The VARIABLE ID NUMBER
the COLUMN NEW_VALUE SQL_ID SQL_ID
the DROP TABLE T;
the CREATE TABLE T
the AS
the SELECT rownum the AS ID, RPAD ( '*', 100, '*') the AS PAD
the FROM Dual
the CONNECT Level BY <= 1000;
the ALTER TABLE T t_pk the ADD CONSTRAINT a PRIMARY KEY (ID);
. 2 collects statistics ---
the BEGIN
dbms_stats.gather_table_stats (
ownname => User,
tabname => 'T',
estimate_percent => 100,
the method_opt = > 'All Columns for size skewonly'
);
the END;
/
.. 3 --- the current distribution of the query table T
the SELECT COUNT (ID), COUNT (the DISTINCT ID), min (ID), max (ID) the FROM T;
- --4.It found that under the current circumstances, it is possible to distinguish the data distribution and proper use of the implementation plan
LINESIZE 1000 SET
SET EXPLAIN AUTOTRACE TRACEONLY
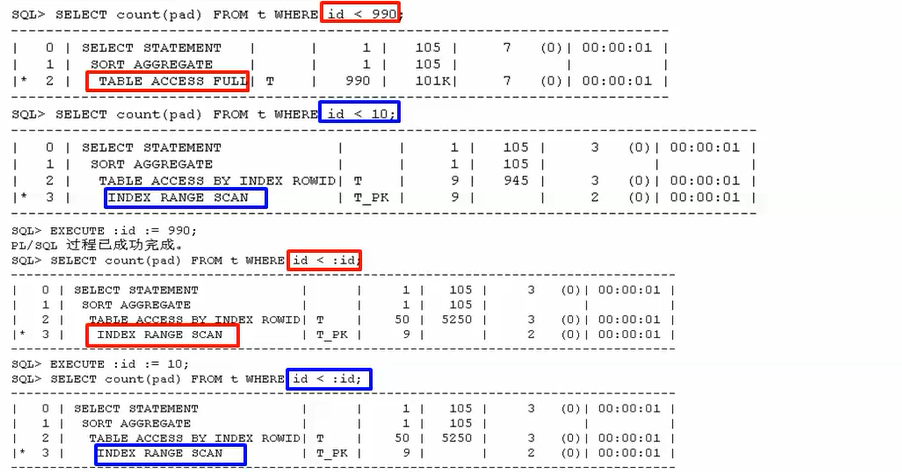
the SELECT COUNT (PAD) the WHERE id the FROM T <990;
the SELECT COUNT (PAD) the WHERE id the FROM T <10;
.. 5 will now --- id value about the variable binding experiment variables whether SQL can use the histogram
- the first generation of 990, found the execution plan is to take full table scan, it is correct
eXECUTE: the above mentioned id: = 990;
the SELECT COUNT (PAD) the FROM t the WHERE the above mentioned id <: the above mentioned id;
--- 6 followed by substitution. 10, was found still take full table scan
EXECUTE: the above mentioned id: = 10;
the SELECT COUNT (PAD) the FROM t the WHERE the above mentioned id <: the above mentioned id;
--- 7 Ba shared pool emptied, a very important step to ensure the hard parse.
the ALTER the SYSTEM FLUSH SHARED_POOL ;
. --- 8 10 substitutes, can be found using the histogram index execution plan is read, normal
the eXECUTE: ID: = 10;
the SELECT COUNT (PAD) the WHERE ID the FROM T <: ID;
--- substitutes. 9 990. after, unusual, take the index still reading, this time due to return most of the data, it should be a full table scan fishes.
The EXECUTE: ID: = 990;
the SELECT COUNT (PAD) the WHERE ID the FROM T <: ID;
--- understand, this is the legendary bound variables peep!
Annex: Results of posted portion
------------------------------------------- -------------------------------------------------- ---------
the SQL> the SELECT COUNT (PAD) the WHERE ID the FROM T <990;
--------------------------- ------------------------------------------------
| 0 | a STATEMENT the SELECT | |. 1 | 105 |. 7 (0) | 00:00:01 |
|. 1 | AGGREGATE to the SORT | |. 1 | 105 | | |
| 2 * | the ACCESS TABLE FULL | T | 990 | 101K |. 7 (0 ) | 00:00:01 |
------------------------------------------ ---------------------------------
the SQL> the SELECT COUNT (PAD) the WHERE ID the FROM T <10;
--- -------------------------------------------------- --------------------------------
| 0 | SELECT STATEMENT | | 1 | 105 | 3 (0)| 00:00:01 |
| 1 | SORT AGGREGATE | | 1 | 105 | | |
| 2 | TABLE ACCESS BY INDEX ROWID| T | 9 | 945 | 3 (0)| 00:00:01 |
|* 3 | INDEX RANGE SCAN | T_PK | 9 | | 2 (0)| 00:00:01 |
-------------------------------------------------------------------------------------
SQL> EXECUTE :id := 990;
PL/SQL 过程已成功完成。
SQL> SELECT count(pad) FROM t WHERE id < :id;
-------------------------------------------------------------------------------------
| 0 | SELECT STATEMENT | | 1 | 105 | 3 (0)| 00:00:01 |
| 1 | SORT AGGREGATE | | 1 | 105 | | |
| 2 | TABLE ACCESS BY INDEX ROWID| T | 50 | 5250 | 3 (0)| 00:00:01 |
|* 3 | INDEX RANGE SCAN | T_PK | 9 | | 2 (0)| 00:00:01 |
-------------------------------------------------------------------------------------
SQL> EXECUTE :id := 10;
SQL> SELECT count(pad) FROM t WHERE id < :id;
-------------------------------------------------------------------------------------
| 0 | SELECT STATEMENT | | 1 | 105 | 3 (0)| 00:00:01 |
| 1 | SORT AGGREGATE | | 1 | 105 | | |
| 2 | TABLE ACCESS BY INDEX ROWID| T | 50 | 5250 | 3 (0)| 00:00:01 |
|* 3 | INDEX RANGE SCAN | T_PK | 9 | | 2 (0)| 00:00:01 |
-------------------------------------------------------------------------------------
sql becomes logic zero read:
Table T purge drop;
Create Table T AS SELECT * from dba_objects;
INSERT INTO SELECT * T from T;
the commit;
SET AUTOTRACE ON
SET Timing ON
SET LINESIZE 1000
SELECT / * + RESULT_CACHE * / COUNT (*) from T;
--- Next performed again (actually read discovery logic 0):
SET AUTOTRACE ON
SELECT / * + RESULT_CACHE * / COUNT (*) from T;
attachment: posted part execution result
------------- -------------------------------------------------- ---------------------------------------
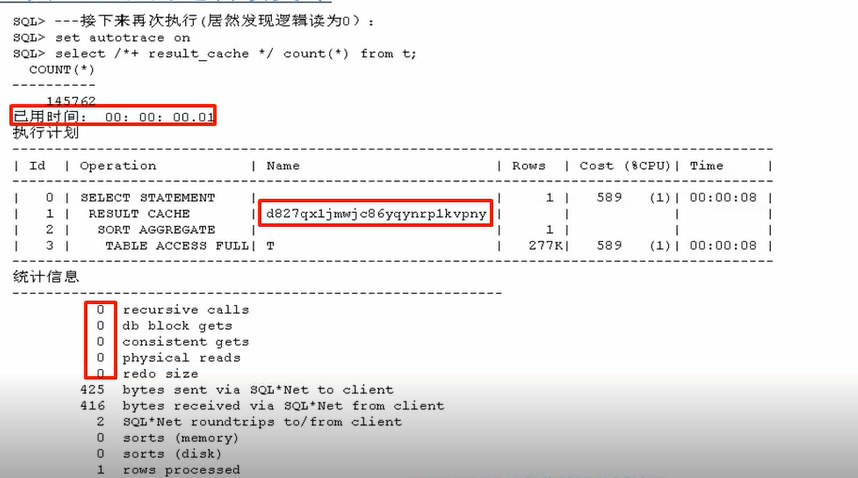
SQL> --- Next to perform again (actually discovery logic read as 0):
the SQL> SET ON AUTOTRACE
the SQL> SELECT / * + RESULT_CACHE * / COUNT (*) from T;
COUNT (*)
----------
145 762
elapsed time: 00: 00 : 00.01
plan of Implementation
------------------------------------------------------------------------------------------
| Id | Operation | Name | Rows | Cost (%CPU)| Time |
------------------------------------------------------------------------------------------
| 0 | SELECT STATEMENT | | 1 | 589 (1)| 00:00:08 |
| 1 | RESULT CACHE | d827qx1jmwjc86yqynrp1kvpny | | | |
| 2 | SORT AGGREGATE | | 1 | | |
| 3 | TABLE ACCESS FULL| T | 277K| 589 (1)| 00:00:08 |
------------------------------------------------------------------------------------------
统计信息
----------------------------------------------------------
0 recursive calls
0 db block gets
0 consistent gets
0 physical reads
0 redo size
425 bytes sent via SQL*Net to client
416 bytes received via SQL*Net from client
2 SQL*Net roundtrips to/from client
0 sorts (memory)
0 sorts (disk)
1 rows processed
Logical read function becomes zero:
drop table t;
CREATE TABLE T AS SELECT * FROM DBA_OBJECTS;
CREATE OR REPLACE FUNCTION F_NO_RESULT_CACHE RETURN NUMBER AS
V_RETURN NUMBER;
BEGIN
SELECT COUNT(*) INTO V_RETURN FROM T;
RETURN V_RETURN;
END;
/
set autotrace on statistics
SELECT F_NO_RESULT_CACHE FROM DUAL;
--看调用F_NO_RESULT_CACHE执行第2次后的结果
SELECT F_NO_RESULT_CACHE FROM DUAL;
CREATE OR REPLACE FUNCTION F_RESULT_CACHE RETURN NUMBER RESULT_CACHE AS
V_RETURN NUMBER;
BEGIN
SELECT COUNT(*) INTO V_RETURN FROM T;
RETURN V_RETURN;
END;
/
SELECT F_RESULT_CACHE FROM DUAL;
--看调用F_RESULT_CACHE执行第2次后的结果
SELECT F_RESULT_CACHE FROM DUAL;
--以下细节是探讨关于如何保证在数据变化后,结果的正确性
SELECT COUNT(*) FROM T;
SELECT F_RESULT_CACHE(1) FROM DUAL;
DELETE T WHERE ROWNUM = 1;
SELECT COUNT(*) FROM T;
SELECT F_RESULT_CACHE(1) FROM DUAL;
COMMIT;
SELECT F_RESULT_CACHE(1) FROM DUAL;
EXEC DBMS_RESULT_CACHE.FLUSH
CREATE OR REPLACE FUNCTION F_RESULT_CACHE(P_IN NUMBER)
RETURN NUMBER RESULT_CACHE RELIES_ON (T) AS
V_RETURN NUMBER;
BEGIN
SELECT COUNT(*) INTO V_RETURN FROM T;
RETURN V_RETURN;
END;
/
SELECT COUNT(*) FROM T;
SELECT F_RESULT_CACHE(1) FROM DUAL;
SELECT F_RESULT_CACHE(1) FROM DUAL;
T = the WHERE ROWNUM. 1 the DELETE;
the SELECT COUNT (*) the FROM T;
the SELECT F_RESULT_CACHE (. 1) the FROM the DUAL;
--- After adding RELIES_ON statement, Oracle automatically set according to the result INVALIDATE dependent object, thereby ensuring the correctness RESULT CACHE.
Annex: Results of posted portion
------------------------------------------- -------------------------------------------------- ---------
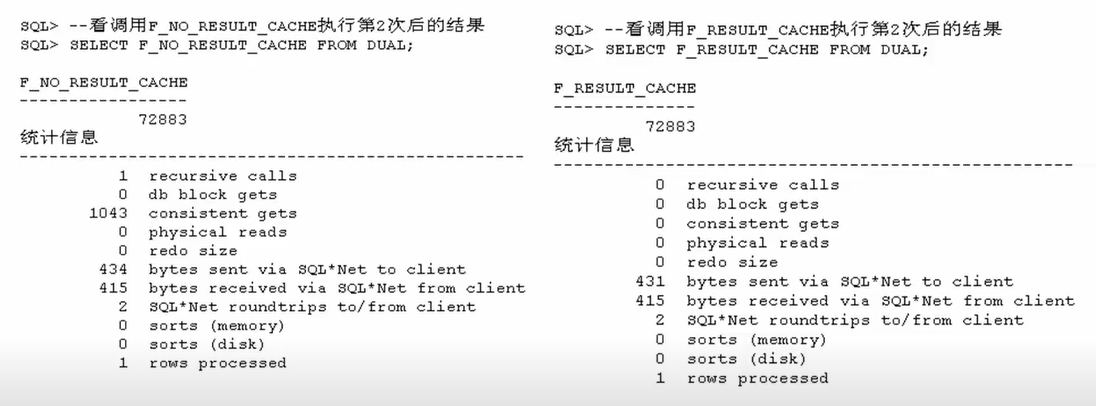
SQL> - call F_NO_RESULT_CACHE look after the implementation of the results of the 2nd
SQL> the SELECT F_NO_RESULT_CACHE the FROM DUAL;
F_NO_RESULT_CACHE
-----------------
72 883
statistics information
------------------------------------------------- -
. 1 recursive This Calls
0 DB Block the gets
1043 the gets consistent
0 PHYSICAL the reads
0 the redo size
434 bytes sent via SQL*Net to client
415 bytes received via SQL*Net from client
2 SQL*Net roundtrips to/from client
0 sorts (memory)
0 sorts (disk)
1 rows processed
SQL> --看调用F_RESULT_CACHE执行第2次后的结果
SQL> SELECT F_RESULT_CACHE FROM DUAL;
F_RESULT_CACHE
--------------
72883
统计信息
---------------------------------------------------
0 recursive calls
0 db block gets
0 consistent gets
0 physical reads
0 redo size
431 bytes sent via SQL*Net to client
415 bytes received via SQL*Net from client
2 SQL*Net roundtrips to/from client
0 sorts (memory)
0 sorts (disk)
1 rows processed
Let keep sql run faster:
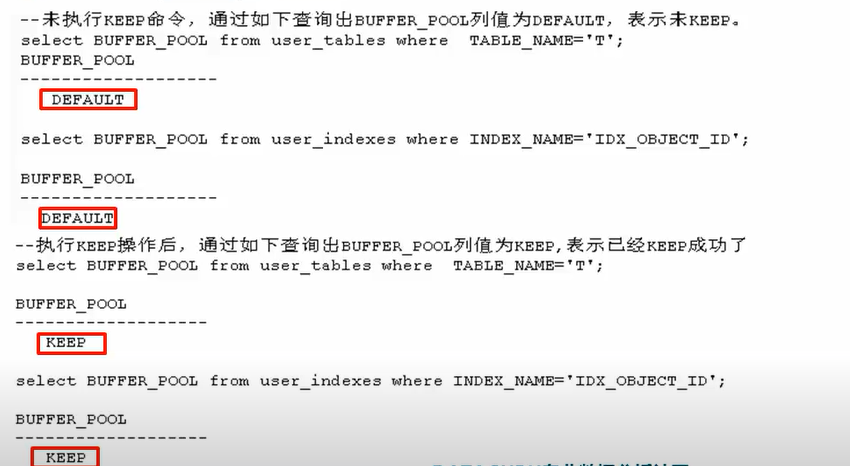
- premise: db_keep_cache_size must ensure that the value is not 0, so first of all there are the following:
- Set the 100M so much.
SET = 100M System DB_KEEP_CACHE_SIZE ALTER;
drop Table T;
Create Table T AS SELECT * from dba_objects;
Create index idx_object_id ON T (object_id);

- KEEP command is not executed, the query by the DEFAULT value BUFFER_POOL column, means no KEEP.

WHERE TABLE_NAME BUFFER_POOL from USER_TABLES SELECT = 'T';
SELECT = INDEX_NAME is BUFFER_POOL from USER_INDEXES WHERE 'IDX_OBJECT_ID';

ALTER index idx_object_id Storage (Keep BUFFER_POOL);
- the entire index into memory
select / * + index (t, idx_object_id) * / COUNT (*) Not null object_id from T WHERE IS;
- all the data will be read into memory
ALTER Table T Storage (Keep BUFFER_POOL);
SELECT / * + full (T) * / COUNT (*) from T;

- After the KEEP operation, a query by column value BUFFER_POOL KEEP, KEEP been successfully expressed

SELECT BUFFER_POOL from USER_TABLES WHERE TABLE_NAME = 'T';
SELECT = INDEX_NAME is BUFFER_POOL from USER_INDEXES WHERE 'IDX_OBJECT_ID';

PS: partially implemented posted The results
------------------------------------------------- -------------------------------------------------- ---

- not KEEP command execution, the query by the DEFAULT value BUFFER_POOL column, means no KEEP.
WHERE TABLE_NAME BUFFER_POOL from USER_TABLES SELECT = 'T';
BUFFER_POOL
-------------------
   the DEFAULT

SELECT = INDEX_NAME is BUFFER_POOL from USER_INDEXES WHERE 'IDX_OBJECT_ID';

BUFFER_POOL
------ -------------
  the DEFAULT

- KEEP after performing operation, by an inquiry BUFFER_POOL column value KEEP, KEEP been successfully expressed
select BUFFER_POOL from user_tables where  TABLE_NAME='T';

BUFFER_POOL
-------------------
   KEEP

select BUFFER_POOL from user_indexes where INDEX_NAME='IDX_OBJECT_ID';

BUFFER_POOL
-------------------
   KEEP
Check the dimensions of the law system:
select s.snap_date,
       decode(s.redosize, null, '--shutdown or end--', s.currtime) "TIME",
       to_char(round(s.seconds/60,2)) "elapse(min)",
       round(t.db_time / 1000000 / 60, 2) "DB time(min)",
       s.redosize redo,
       round(s.redosize / s.seconds, 2) "redo/s",
       s.logicalreads logical,
       round(s.logicalreads / s.seconds, 2) "logical/s",
       physicalreads physical,
       round(s.physicalreads / s.seconds, 2) "phy/s",
       s.executes execs,
       round(s.executes / s.seconds, 2) "execs/s",
       s.parse,
       round(s.parse / s.seconds, 2) "parse/s",
       s.hardparse,
       round(s.hardparse / s.seconds, 2) "hardparse/s",
       s.transactions trans,
       round(s.transactions / s.seconds, 2) "trans/s"
  from (select curr_redo - last_redo redosize,
               curr_logicalreads - last_logicalreads logicalreads,
               curr_physicalreads - last_physicalreads physicalreads,
               curr_executes - last_executes executes,
               curr_parse - last_parse parse,
               curr_hardparse - last_hardparse hardparse,
               curr_transactions - last_transactions transactions,
               round(((currtime + 0) - (lasttime + 0)) * 3600 * 24, 0) seconds,
               to_char(currtime, 'yy/mm/dd') snap_date,
               to_char(currtime, 'hh24:mi') currtime,
               currsnap_id endsnap_id,
               to_char(startup_time, 'yyyy-mm-dd hh24:mi:ss') startup_time
          from (select a.redo last_redo,
                       a.logicalreads last_logicalreads,
                       a.physicalreads last_physicalreads,
                       a.executes last_executes,
                       a.parse last_parse,
                       a.hardparse last_hardparse,
                       a.transactions last_transactions,
                       lead(a.redo, 1, null) over(partition by b.startup_time order by b.end_interval_time) curr_redo,
                       lead(a.logicalreads, 1, null) over(partition by b.startup_time order by b.end_interval_time) curr_logicalreads,
                       lead(a.physicalreads, 1, null) over(partition by b.startup_time order by b.end_interval_time) curr_physicalreads,
                       lead(a.executes, 1, null) over(partition by b.startup_time order by b.end_interval_time) curr_executes,
                       lead(a.parse, 1, null) over(partition by b.startup_time order by b.end_interval_time) curr_parse,
                       lead(a.hardparse, 1, null) over(partition by b.startup_time order by b.end_interval_time) curr_hardparse,
                       lead(a.transactions, 1, null) over(partition by b.startup_time order by b.end_interval_time) curr_transactions,
                       b.end_interval_time lasttime,
                       lead(b.end_interval_time, 1, null) over(partition by b.startup_time order by b.end_interval_time) currtime,
                       lead(b.snap_id, 1, null) over(partition by b.startup_time order by b.end_interval_time) currsnap_id,
                       b.startup_time
                  from (select snap_id,
                               dbid,
                               instance_number,
                               sum(decode(stat_name, 'redo size', value, 0)) redo,
                               sum(decode(stat_name,
                                          'session logical reads',
                                          value,
                                          0)) logicalreads,
                               sum(decode(stat_name,
                                          'physical reads',
                                          value,
                                          0)) physicalreads,
                               sum(decode(stat_name, 'execute count', value, 0)) executes,
                               sum(decode(stat_name,
                                          'parse count (total)',
                                          value,
                                          0)) parse,
                               sum(decode(stat_name,
                                          'parse count (hard)',
                                          value,
                                          0)) hardparse,
                               sum(decode(stat_name,
                                          'user rollbacks',
                                          value,
                                          'user commits',
                                          value,
                                          0)) transactions
                          from dba_hist_sysstat
                         where stat_name in
                               ('redo size',
                                'session logical reads',
                                'physical reads',
                                'execute count',
                                'user rollbacks',
                                'user commits',
                                'parse count (hard)',
                                'parse count (total)')
                         group by snap_id, dbid, instance_number) a,
                       dba_hist_snapshot b
                 where a.snap_id = b.snap_id
                   and a.dbid = b.dbid
                   and a.instance_number = b.instance_number
                 order by end_interval_time)) s,
       (select lead(a.value, 1, null) over(partition by b.startup_time order by b.end_interval_time) - a.value db_time,
               lead(b.snap_id, 1, null) over(partition by b.startup_time order by b.end_interval_time) endsnap_id
          from dba_hist_sys_time_model a, dba_hist_snapshot b
         where a.snap_id = b.snap_id
           and a.dbid = b.dbid
           and a.instance_number = b.instance_number
           and a.stat_name = 'DB time') t
 where s.endsnap_id = t.endsnap_id
 order by  s.snap_date ,time desc;
Find frequently submitted statements:
- Check for over-statement submitted (the key is to get sid easier, on behalf of the V $ SESSION can know what the process is, then you can also know that $ SQL V)
the SET LINESIZE 1000
column sid format 99999
column format A20 Program
Machine format A20 column
column LOGON_TIME format DATE
column WAIT_CLASS format A10
column format A32 Event
column format SQL_ID 9999
column format prev_sql_id 9999
column format WAIT_TIME 9999
column format SECONDS_IN_WAIT 9999
- the highest number of submitted SESSION

 the SELECT t1.sid, t1.value, T2. name
   from $ SESSTAT V T1, V T2 $ STATNAME
  WHERE t2.name like '%% commits User'
    and t1.STATISTIC # = # t2.STATISTIC
    and value> = 10000
  value desc by the Order;

- get SID either substituted into V $ SESSION and V $ SQL to analyze in
 - come SQL_ID
  the SELECT t.SID,
         t.PROGRAM,
     t.EVENT,
         t.LOGON_TIME,
         t.WAIT_TIME,
         t .SECONDS_IN_WAIT,
         t.SQL_ID,
         t.PREV_SQL_ID
   from the session V $ T
  WHERE SID in (194);

 - obtained according to the sql_id or prev_sql_id substituting the SQL
  SELECT t.sql_id,
         t.sql_text,
         t.EXECUTIONS,
         t.FIRST_LOAD_TIME,
         T. LAST_LOAD_TIME
  from v $ SQLAREA t
 the WHERE SQL_ID in ( 'ccpn5c32bmfmf');

- please look at this:
 the SELECT * from v $ ACTIVE_SESSION_HISTORY the WHERE session_id = 194

- by performing the following test script in another the session
drop purge Table T;
Create Table T (X int);

SELECT * WHERE rownum MYSTAT from V $ =. 1;
the begin
    for I in. 1 .. 100000 Loop
       INSERT INTO T values (I );
      the commit;
    End Loop;
End;
/


attached: posted part execution result
--------------------------------- -------------------------------------------------- -------------------
the SQL> SELECT t1.sid, t1.value, t2.name
  2 from $ SESSTAT V T1, V T2 $ STATNAME
  . 3 t2.name like WHERE 'User commits%%'
  . 4 and t1.STATISTIC t2.STATISTIC # # =
  . 5 and value> = 10000
  . 6 Order by desc value;
   the SID of vALUE NAME
------ ---------- -------------------------
   132     100003 user commits

SQL>   select t.SID,
  2           t.PROGRAM,
  3              t.EVENT,
  4           t.LOGON_TIME,
  5           t.WAIT_TIME,
  6           t.SECONDS_IN_WAIT,
  7           t.SQL_ID,
  8           t.PREV_SQL_ID
  9     from v$session t
 10    where sid in(132);

   SID PROGRAM              EVENT                            LOGON_TIME     WAIT_TIME SECONDS_IN_WAIT SQL_ID    PREV_SQL_ID
------ -------------------- ---------------------------------------------------------------------- --------------------------
   132 sqlplus.exe          SQL*Net message from client      13-11月-13             0              77           ccpn5c32bmfmf

SQL>   select t.sql_id,
  2           t.sql_text,
  3           t.EXECUTIONS,
  4           t.FIRST_LOAD_TIME,
  5           t.LAST_LOAD_TIME
  6    from v$sqlarea t
  7   where sql_id in ('ccpn5c32bmfmf');
SQL_ID                 SQL_TEXT                          EXECUTIONS            FIRST_LOAD_TIME        LAST_LOAD_TIME
------------------------------------------------------------------------------------------------------------------------------------
ccpn5c32bmfmfbegin     for i in 1 .. 100000 loop             1                 2013-11-13/16:13:56       13-11月-13
                         insert into t values (i);
             commit;
            end loop;
             end;
