table of Contents
random module
It generates a random number used in
import random

# 大于0且小于1之间的小数
print(random.random())
# 0.9704044132949314


# 大于等于1且小于等于3之间的整数
print(random.randint(1, 3))
# 2


# 大于等于1且小于3之间的整数
print(random.randrange(1, 3))
# 1


# 大于1小于3的小数,如1.927109612082716
print(random.uniform(1, 3))
# 2.9017299775297385


# 列表内的任意一个元素,即1或者‘23’或者[4,5]
print(random.choice([1, '23', [4, 5]]))
# 23


# random.sample([], n),列表元素任意n个元素的组合,示例n=2
print(random.sample([1, '23', [4, 5]], 2))
# ['23', [4, 5]]


lis = [1, 3, 5, 7, 9]
# 打乱l的顺序,相当于"洗牌"
random.shuffle(lis)
print(lis)
# [1, 7, 9, 5, 3]
numpy module
Commonly used in data analysis, two-dimensional array, namely a matrix for scientific computing
Create a numpy array
import numpy as np

# 创建一维的ndarray对象
arr = np.array([1, 2, 3])
print(arr, type(arr))
# [1 2 3] <class 'numpy.ndarray'>


# 创建二维的ndarray对象     最常用**
print(np.array([[1, 2, 3], [4, 5, 6]]))
# [[1 2 3]
# [4 5 6]]


# 创建三维的ndarray对象
print(np.array([[1, 2, 3], [4, 5, 6], [7, 8, 9]]))
# [[1 2 3]
# [4 5 6]
# [7 8 9]]
An array of common attributes numpy
dtype Data Type: bool_, int (8,16,32,64), float (16,32,64)
# 新建numpy数组,数据类型为float32
arr = np.array([[1, 2, 3], [4, 5, 6]], dtype=np.float32)
print(arr)

# [[1. 2. 3.]
#  [4. 5. 6.]]
dtype view the data type of the array elements
print(arr.dtype)

# float32
astype: Data Type Conversion
arr = arr.astype(np.int32)
print(arr.dtype)
print(arr)

# int32
# [[1 2 3]
#  [4 5 6]]
T: transposition of the array (interchanging rows)
print(arr.T)

# [[1. 4.]
#  [2. 5.]
#  [3. 6.]]
size: see the number of array elements
print(arr.size)

# 6
ndim: Check dimensions of the array
print(arr.ndim)

# 2
shape: See array dimension size (row, column) in the form of a tuple
print(arr.shape)

# (2, 3)
Get numpy array ranks number two
Numpy array to obtain an array of rows and columns
# 新建numpy二维数组
arr = np.array([[1, 2, 3], [4, 5, 6]])
print(arr)
[[1 2 3]
 [4 5 6]]

print(arr.shape)

# (2, 3)
Get numpy array line
# 获取numpy数组的行
print(arr.shape[0])

# 2
Gets the column numpy array
print(arr.shape[1])

# 3
Cutting numpy array
Numpy array similar to segmentation cutting list, but the list in the cutting is cutting involves numpy array of rows and columns of the cut, but both are cutting manner starting at index 0, and taking the end of the head does not take .
Take all the elements
# 新建二维数组
arr = np.array([[1, 2, 3, 4], [5, 6, 7, 8], [9, 10, 11, 12]])
print(arr)
'''[[ 1  2  3  4]
 [ 5  6  7  8]
 [ 9 10 11 12]]'''


print(arr[:, :])  # [行,列]

'''[[ 1  2  3  4]
 [ 5  6  7  8]
 [ 9 10 11 12]]'''
Taking all the elements of the first row
print(arr[:1, :])
# [[1 2 3 4]]

print(arr[0, [0, 1, 2, 3]])
# [1 2 3 4]
Taking all the elements of the first column
print(arr[:, :1])
# [[1]
#  [5]
#  [9]]


print(arr[(0, 1, 2), 0])
# [1 5 9]
Elements having a first row of the first column
print(arr[(0, 1, 2), 0])
# [1 5 9]


print(arr[0, 0])
# 1
Take larger than 5, it returns an array
print(arr[arr > 5])
# [ 6  7  8  9 10 11 12]
numpy array element replacement
Take all the elements of the first row, and let the elements of the first row are 0
arr = np.array([[1, 2, 3, 4], [5, 6, 7, 8], [9, 10, 11, 12]])
print(arr)
'''[[ 1  2  3  4]
 [ 5  6  7  8]
 [ 9 10 11 12]]'''

arr1 = arr.copy()
arr1[:1, :] = 0
print(arr1)
'''[[ 0  0  0  0]
 [ 5  6  7  8]
 [ 9 10 11 12]]'''
Take all the elements is greater than 5, and let the elements 5 is greater than 0
arr2 = arr.copy()
arr2[arr > 5] = 0
print(arr2)

'''[[1 2 3 4]
 [5 0 0 0]
 [0 0 0 0]]'''
Numpy array to be cleared
arr3 = arr.copy()
arr3[:, :] = 0
print(arr3)

'''[[0 0 0 0]
 [0 0 0 0]
 [0 0 0 0]]'''
The combined numpy array
# 新建两个二维数组
arr1 = np.array([[1, 2], [3, 4], [5, 6]])
print(arr1)
'''[[1 2]
 [3 4]
 [5 6]]'''

arr2 = np.array([[7, 8], [9, 10], [11, 12]])
print(arr2)
'''[[ 7  8]
 [ 9 10]
 [11 12]]'''
Line merge two numpy arrays
# 注意使用hstack()方法合并numpy数组,numpy数组应该有相同的行
print(np.hstack((arr1, arr2)))

'''[[ 1  2  7  8]
 [ 3  4  9 10]
 [ 5  6 11 12]]'''
Columns into two numpy arrays
# 注意使用vstack()方法合并numpy数组,numpy数组应该有相同的列
print(np.vstack((arr1, arr2)))
'''[[ 1  2]
 [ 3  4]
 [ 5  6]
 [ 7  8]
 [ 9 10]
 [11 12]]'''
Merging two arrays numpy
# 合并两个numpy数组,其中axis=1表示合并两个numpy数组的行
print(np.concatenate((arr1, arr2), axis=1))
'''[[ 1  2  7  8]
 [ 3  4  9 10]
 [ 5  6 11 12]]'''

# 合并两个numpy数组,其中axis=0表示合并两个numpy数组的列
print(np.concatenate((arr1, arr2), axis=0))
'''[[ 1  2]
 [ 3  4]
 [ 5  6]
 [ 7  8]
 [ 9 10]
 [11 12]]'''
numpy commonly used functions
array (): converting an array list, select explicitly specified dtype
arr = np.array([1, 2, 3])  # 创建一维数组
print(arr)

# [1 2 3]
arange (): range of numpy version, support for floating-point numbers
# 构造0-9的ndarray数组            [0 1 2 3 4 5 6 7 8 9]
print(np.arange(10))

# 构造1-4的ndarray数组            [1 2 3 4]
print(np.arange(1, 5))

# 构造1-19且步长为2的ndarray数组   [ 1  3  5  7  9 11 13 15 17 19]
print(np.arange(1, 20, 2))
linspace (): Similar arange (), the third parameter is the length of the array
# 构造一个等差数列,取头也取尾,从0取到20,取5个数
print(np.linspace(0, 20, 5))
# [ 0.  5. 10. 15. 20.]


# 构造一个数列,取头也取尾,从1取到100,取10个数
print(np.linspace(1, 100, 10))
# [  1.  12.  23.  34.  45.  56.  67.  78.  89. 100.]
zeros (): 0 create a full array of the specified shape and dtype
# 创建一个2*3的全0数组
print(np.ones((2, 3)))
'''[[1. 1. 1.]
 [1. 1. 1.]]'''
ones (): create a full array 1 according to a prescribed shape and dtype
# 创建一个2*3的全1数组
print(np.zeros((2, 3)))
'''[[0. 0. 0.]
 [0. 0. 0.]]'''
eye (): Create a matrix
# 构造3个主元的单位numpy数组
print(np.eye(3, 3))
'''[[1. 0. 0.]
 [0. 1. 0.]
 [0. 0. 1.]]'''
empty (): Creates a random array element
# 构造一个4*4的随机numpy数组,里面的元素是随机生成的
print(np.empty((4, 4)))
'''[[6.23042070e-307 1.42417221e-306 7.56595733e-307 3.56043054e-307]
 [7.56595733e-307 1.00131040e-307 8.34426464e-308 6.23038336e-307]
 [1.42419394e-306 6.23059726e-307 1.06810268e-306 6.89809904e-307]
 [1.42420481e-306 1.24612013e-306 8.01091099e-307 9.34603679e-307]]'''
reshape (): reshape
arr1 = np.zeros((1, 12))
print(arr1.reshape((3, 4)))
'''[[0. 0. 0. 0.]
 [0. 0. 0. 0.]
 [0. 0. 0. 0.]]'''
matplotlib module
Commonly used in histograms, bar charts, line charts, pie charts and other drawing
Basic core usage
Modified to remove a variety of text, format, the core code is as follows:
from matplotlib import pyplot as plt  # 导入模块

clas = [1,2,3,4]
students = [50, 55, 45, 60]
plt.bar(clas,students)  # bar是条形图,可换成其他图形关键字,生成(行,列)
plt.show()
The following are added bells and whistles decoration and text, but does not have much to change the core code
Bar chart
import matplotlib.pyplot as plt
from matplotlib.font_manager import FontProperties
# 设置字体   路径为电脑内中文的ttc格式字体
font = FontProperties(fname='C:\Windows\Fonts\simsun.ttc')

# 修改背景为条纹
plt.style.use('ggplot')

classes = ['3班', '4班', '5班', '6班']
classes_index = range(len(classes))
student_amounts = [66, 55, 45, 70]

# 画布设置
fig = plt.figure()
# 1,1,1表示一张画布切割成1行1列共一张图的第1个;2,2,1表示一张画布切割成2行2列共4张图的第一个(左上角)
ax1 = fig.add_subplot(1, 1, 1)

# 合成条形图,color参数设置了颜色
ax1.bar(classes_index, student_amounts,  color='r')

# 设置行标题  字体  字体大小
plt.xlabel('班级', fontproperties=font, fontsize=15)
# 设置列标题   字体  字体大小
plt.ylabel('学生人数', fontproperties=font, fontsize=15)
# 设置画布大标题   字体  字体大小
plt.title('班级-学生人数', fontproperties=font, fontsize=20)

plt.show()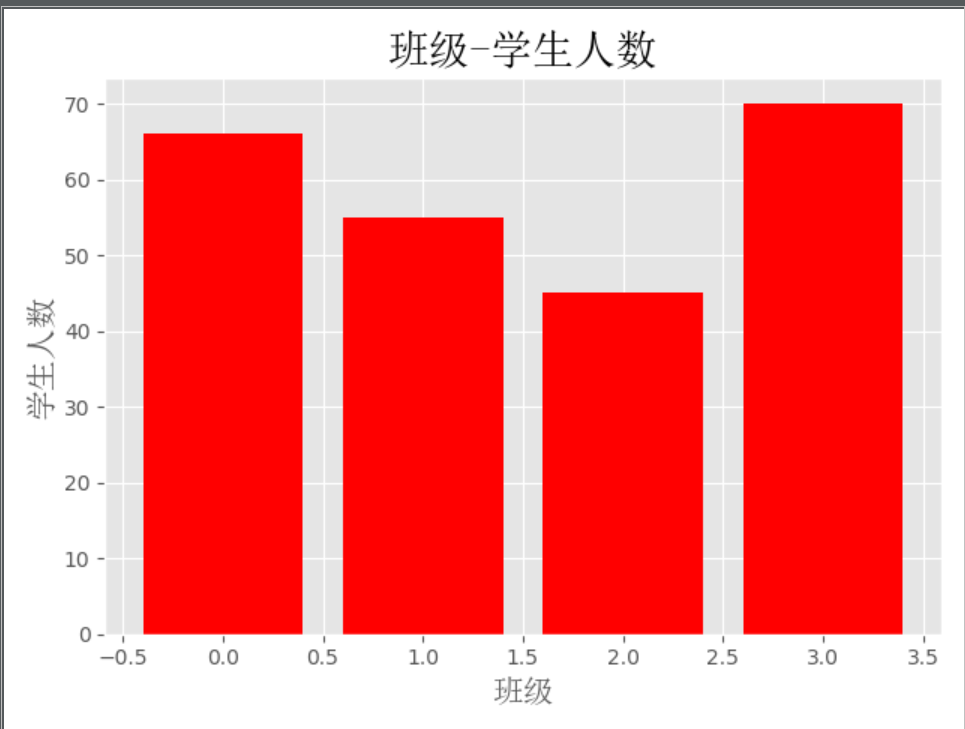
Histogram
import numpy as np
import matplotlib.pyplot as plt
from matplotlib.font_manager import FontProperties
# 设置字体   路径为电脑内中文的ttc格式字体
font = FontProperties(fname='C:\Windows\Fonts\simsun.ttc')

# 修改背景为条纹
plt.style.use('ggplot')

mu1, mu2, sigma = 50, 100, 10
# 构造均值为50的符合正态分布的数据
x1 = mu1 + sigma * np.random.randn(10000)

# 构造均值为100的符合正态分布的数据
x2 = mu2 + sigma * np.random.randn(10000)

# 设置一张画布
fig = plt.figure()

# 将画布分为1行2列  把第1列给ax1
ax1 = fig.add_subplot(121)
# bins=50表示每个变量的值分成50份,即会有50根柱子   color设置颜色
ax1.hist(x1, bins=50, color='darkgreen')

# 将画布分为1行2列  把第2列给ax2
ax2 = fig.add_subplot(122)
# bins=50表示每个变量的值分成50份,即会有50根柱子   color设置颜色
ax2.hist(x2, bins=50, color='orange')

# 设置画布大标题
fig.suptitle('两个正态分布', fontproperties=font, fontweight='bold', fontsize=15)
# 设置第一列小标题
ax1.set_title('绿色的正态分布', fontproperties=font)
# 设置第二列小标题
ax2.set_title('橙色的正态分布', fontproperties=font)

plt.show()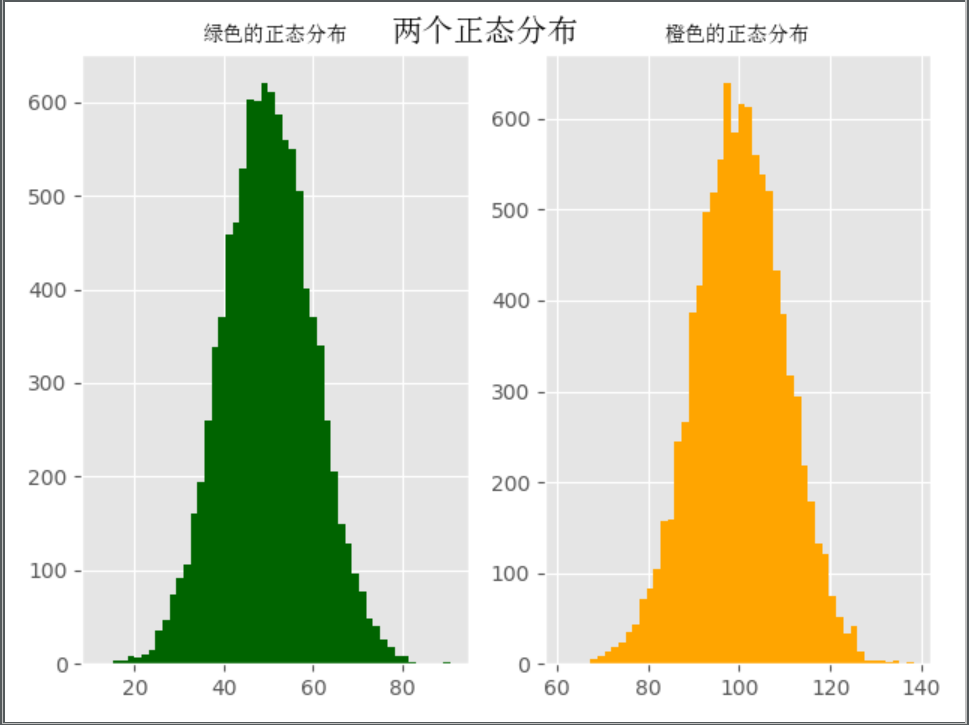
line chart
import numpy as np
from numpy.random import randn
import matplotlib.pyplot as plt
from matplotlib.font_manager import FontProperties

# 设置字体   路径为电脑内中文的ttc格式字体
font = FontProperties(fname='C:\Windows\Fonts\simsun.ttc')

# 修改背景为条纹
plt.style.use('ggplot')
# 固定随机数
np.random.seed(1)

# 使用numpy的累加和,保证数据取值范围不会在(0,1)内波动
plot_data1 = randn(40).cumsum()
plot_data2 = randn(40).cumsum()
plot_data3 = randn(40).cumsum()
plot_data4 = randn(40).cumsum()

# 设置四条折线
# marker:折线中数据点的形式, color:折线的颜色, linestyle:折线的形式, label:折线的标题'
plt.plot(plot_data1, marker='o', color='red', linestyle='-', label='红实线')
plt.plot(plot_data2, marker='x', color='orange', linestyle='--', label='橙虚线')
plt.plot(plot_data3, marker='*', color='yellow', linestyle='-.', label='黄点线')
plt.plot(plot_data4, marker='s', color='green', linestyle=':', label='绿点图')

# loc='best'给label自动选择最好的位置  loc='left/right' label靠左/靠右
plt.legend(loc='best', prop=font)
plt.show()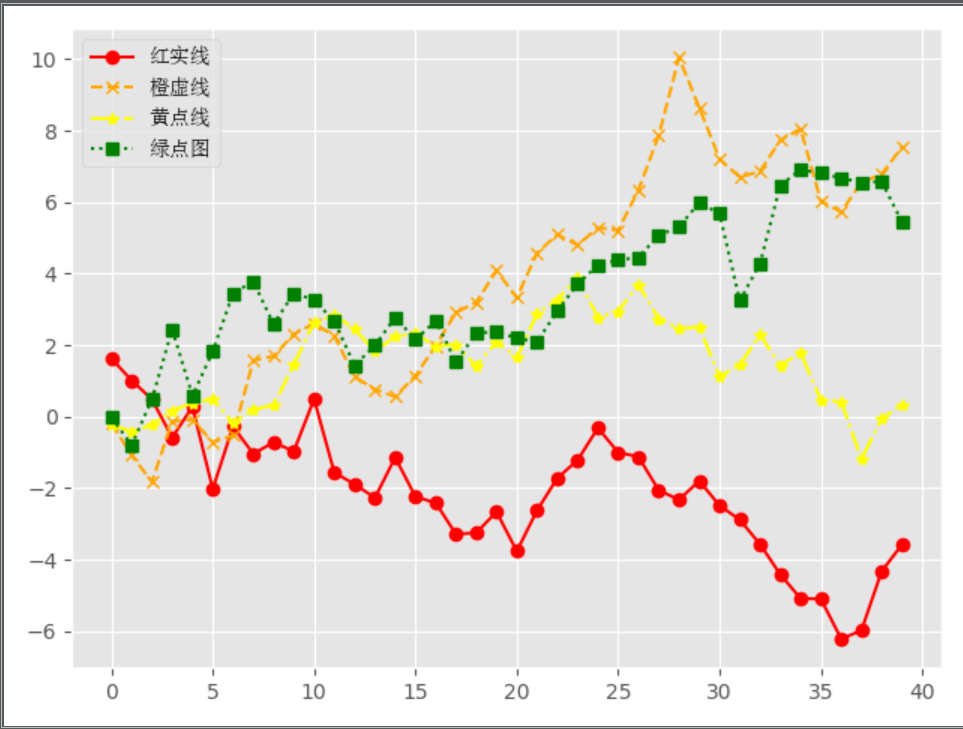
FIG straight scattergram +
import numpy as np
from numpy.random import randn
import matplotlib.pyplot as plt
from matplotlib.font_manager import FontProperties

# 设置字体   路径为电脑内中文的ttc格式字体
font = FontProperties(fname='C:\Windows\Fonts\simsun.ttc')

# 修改背景为条纹
plt.style.use('ggplot')

# 生成1-20 步长为1的数组
x = np.arange(1, 20, 1)

# 拟合一条水平散点线
np.random.seed(1)
y_linear = x + 10 * np.random.randn(19)

# 拟合一条x²的散点线
y_quad = x**2 + 10 * np.random.randn(19)

# 生成一张画布
fig = plt.figure()
# 将画布分为2行2列  把第一行第1列给ax1
ax1 = fig.add_subplot(221)
# s是散点大小
plt.scatter(x, y_linear, s=30, color='r', label='蓝点')
plt.scatter(x, y_quad, s=100, color='b', label='红点')

# 将画布分为2行2列  把第二行第2列给ax2
ax2 = fig.add_subplot(224)
plt.plot(x, y_linear, color='r')
plt.plot(x, y_quad, color='b')

# 限制x轴和y轴的范围取值
plt.xlim(min(x) - 1, max(x) + 1)
plt.ylim(min(y_quad) - 10, max(y_quad) + 10)

# 设置画布大标题
fig.suptitle('散点图+直线图', fontproperties=font, fontsize=20)
# 设置小标题
ax1.set_title('散点图', fontproperties=font)
# 单独设置label的字体
ax1.legend(prop=font)
# 设置小标题
ax2.set_title('直线图', fontproperties=font)
plt.show()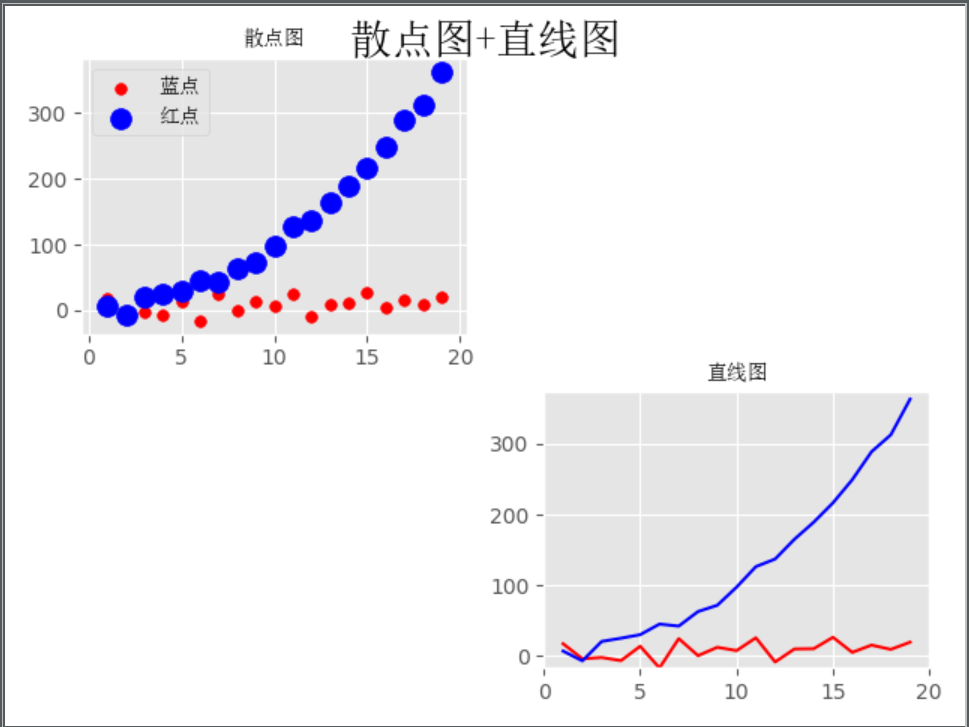
pandas module
Commonly used in the file access operation, support database (sql), html, json, pickle, csv (txt, excel), sas, stata, hdf etc.
import numpy as np
import pandas as pd

# pd从excel中读取 DataFrame数据类型
np.random.seed(10)
index = pd.date_range('2019-01-01', periods=6, freq='M')
print(index)

columns = ['c1', 'c2', 'c3', 'c4']
print(columns)

val = np.random.randn(6, 4)
print(val)

df = pd.DataFrame(index=index, columns=columns, data=val)
print(df)

# 保存文件,读出成文件
df.to_excel('date_c.xlsx')

# 读出文件
df = pd.read_excel('date_c.xlsx', index_col=[0])
print(df)

print(df.index)
print(df.columns)
print(df.values)

print(df[['c1', 'c2']])

# 按照index取值
# print(df['2019-01-31'])
print(df.loc['2019-01-31'])
print(df.loc['2019-01-31':'2019-05-31'])

# 按照values取值
print(df)
print(df.iloc[0, 0])

df.iloc[0, :] = 0
print(df)