In the last chapter , "Docker under one combat zabbix trilogy: speed experience" , we quickly installed zabbix server, and log management page to view the monitoring information zabbix server host machine, but in the actual scene, should be on application server to do the monitoring, so today we will be monitoring the actual application servers are added to the zabbix server.
The full series of articles links:
- "One of the real zabbix trilogy under Docker: speed experience" ;
- "Under Docker combat zabbix trilogy of the two: monitoring other machines" ;
- "Docker next three combat zabbix Trilogy: custom monitoring item" ;
Deployment
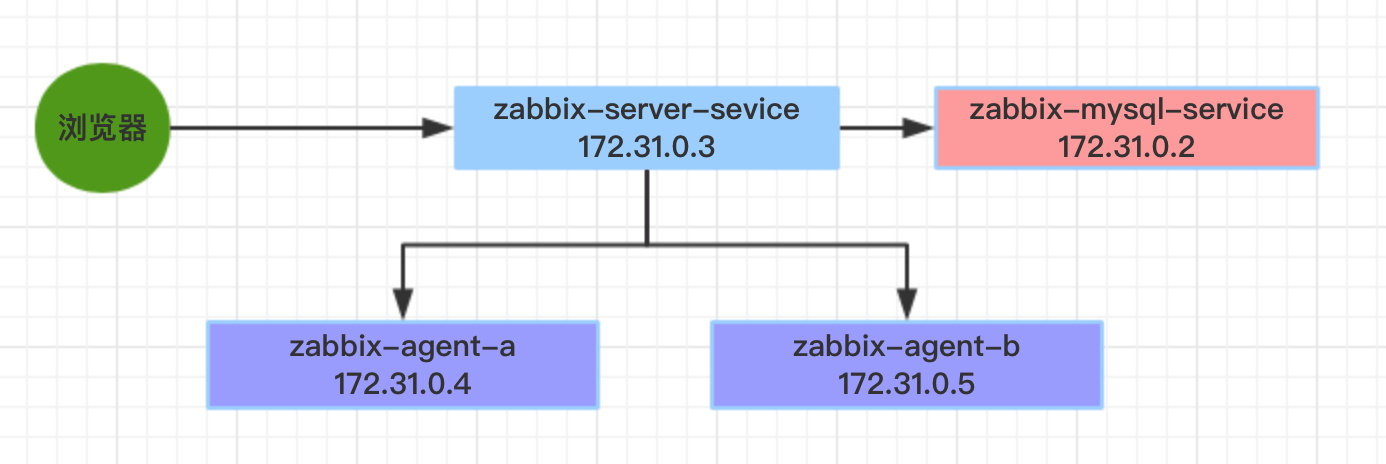
Assumed that the actual project we have two application servers, in order to monitor them, we need to separately install zabbix-agent service above and then configure them connected zabbix server, all monitoring data and monitoring configuration data is stored in zabbix server mysql , the deployment as shown below:
The real scene is installed on the application server zabbix agent service, but this practice is not the focus of the process and steps to install the agent, in order to quickly experience the service as used herein, the official agent zabbix mirror, the mirror is actually installed on ubuntu14 zabbix agent (zabbix agent installation process on the server is not detailed in this article, to install readers who are interested can go online to search for relevant information)
docker-compose.yml file
According to the deployment shown in the previous picture, our docker-compose.yml follows, mysql and zabbix server is a must, then added two zabbix agent container, names are zabbix-agent-a and zabbix-agent- b:
version: '2'
services:
  zabbix-mysql-service:
    image: daocloud.io/library/mysql:8
    container_name: zabbix-mysql-service
    environment:
      - MYSQL_ROOT_PASSWORD=888888
    restart: always
  zabbix-server-service:
    image: monitoringartist/zabbix-xxl:3.2.6
    links:
      - zabbix-mysql-service:mysqlhost
    container_name: zabbix-server-service
    restart: always
    depends_on:
      - zabbix-mysql-service
    ports:
      - "8888:80"
    environment:
      - ZS_DBHost=mysqlhost
      - ZS_DBUser=root
      - ZS_DBPassword=888888
  zabbix-agent-a:
    image: zabbix/zabbix-agent:ubuntu-3.2.6
    links:
      - zabbix-server-service:zabbixserverhost
    container_name: zabbix-agent-a
    restart: always
    depends_on:
      - zabbix-server-service
    environment:
      - ZBX_HOSTNAME=zabbix-agent-service-a
      - ZBX_SERVER_HOST=zabbixserverhost
  zabbix-agent-b:
    image: zabbix/zabbix-agent:ubuntu-3.2.6
    links:
      - zabbix-server-service:zabbixserverhost
    container_name: zabbix-agent-b
    restart: always
    depends_on:
      - zabbix-server-service
    environment:
      - ZBX_HOSTNAME=zabbix-agent-service-b
      - ZBX_SERVER_HOST=zabbixserverhost
As described above, in the configuration process zabbix agent to use ip zabbix server information, here we through links parameter, the added information zabbix server ip zabbix agent in the host file, host name is zabbixserverhost;
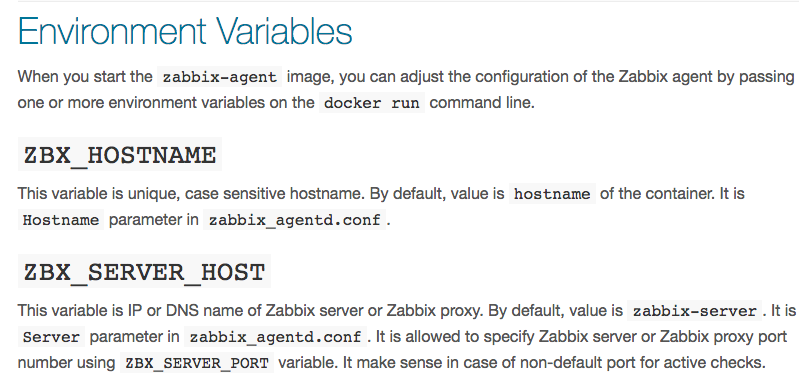
In addition, ZBX_HOSTNAME and ZBX_SERVER_HOST two environment variables, in official documents zabbix agent mirroring has been explained in the following figure, ZBX_HOSTNAME to express their identity, ZBX_SERVER_HOST is used to indicate information zabbix server's ip, where a direct link with parameters the alias to represent, will be able to find ip zabbix server through the host of the direct:
Start docker container
Open the console, execute the command in the directory where the file docker-compose.yml Docker Compose-up -d , as shown:

Enter console
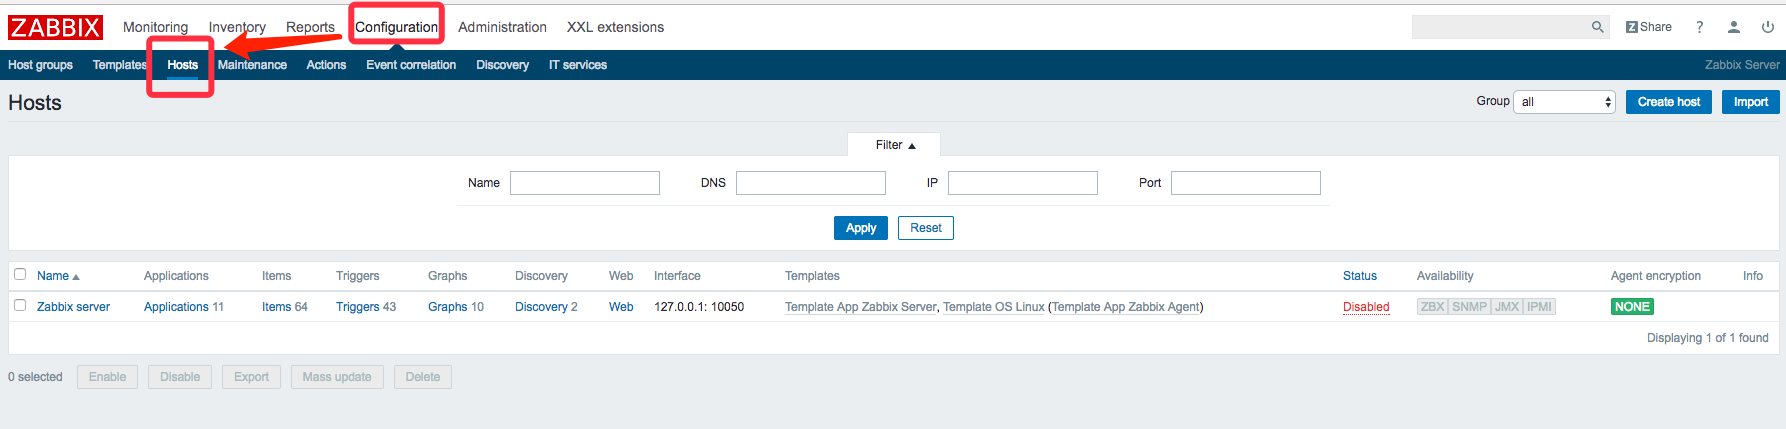
Wait for about one minute, let zabbix server initialization is completed, then the page will be able to log management, please refer to "Real life zabbix trilogy under Docker: speed experience," a text, page after logging into the hosts, as shown below:
Gets monitor the machine ip
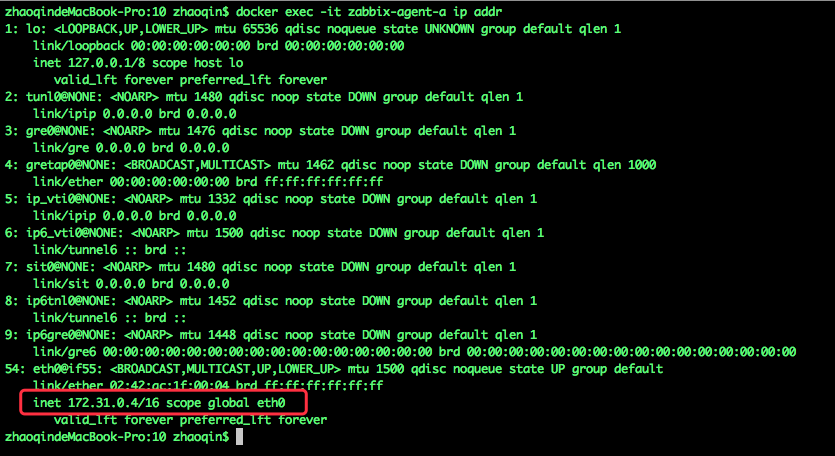
According to deployment on the front of the deployment descriptors chart, there are two machines installed zabbix agent service, then you want to join the monitoring, the first step we want machines ip finalized, the implementation of the console docker exec -it zabbix-agent- a ip addr command, the following output can be seen, the first machine ip is 172.31.0.4:
Performing console docker exec -it zabbix-agent-b ip addr command, can be seen as a second machine ip is 172.31.0.5;
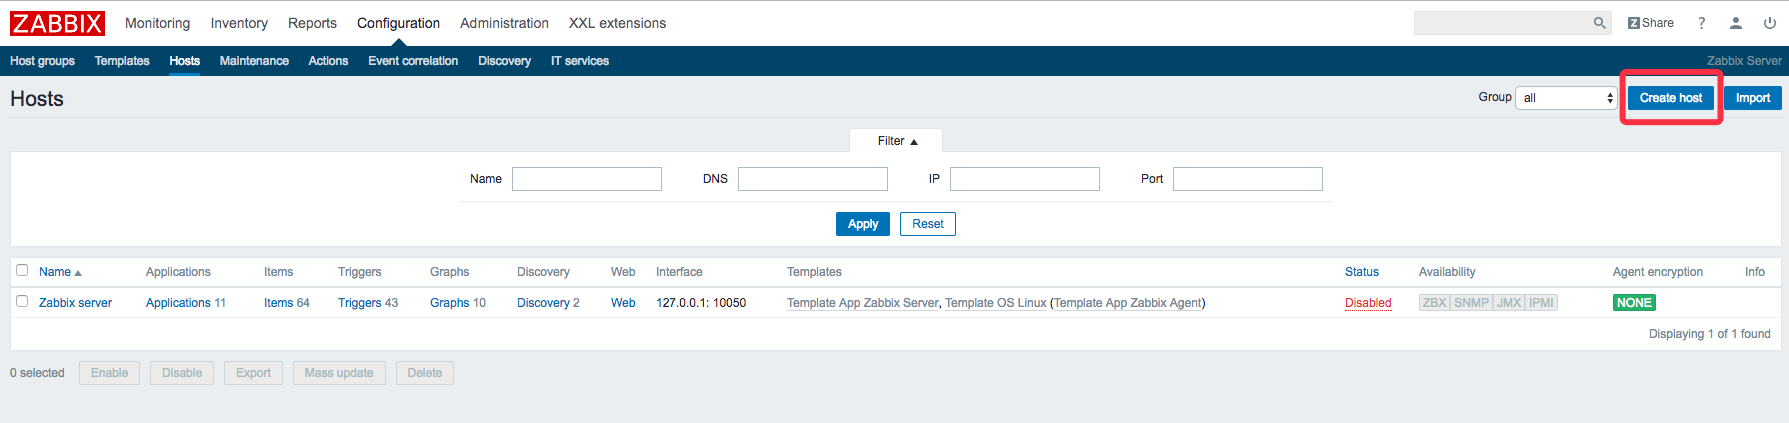
Adding Machine Monitoring
Click on the top right of the page hosts Create host button can be added to monitor the machine, as shown below:
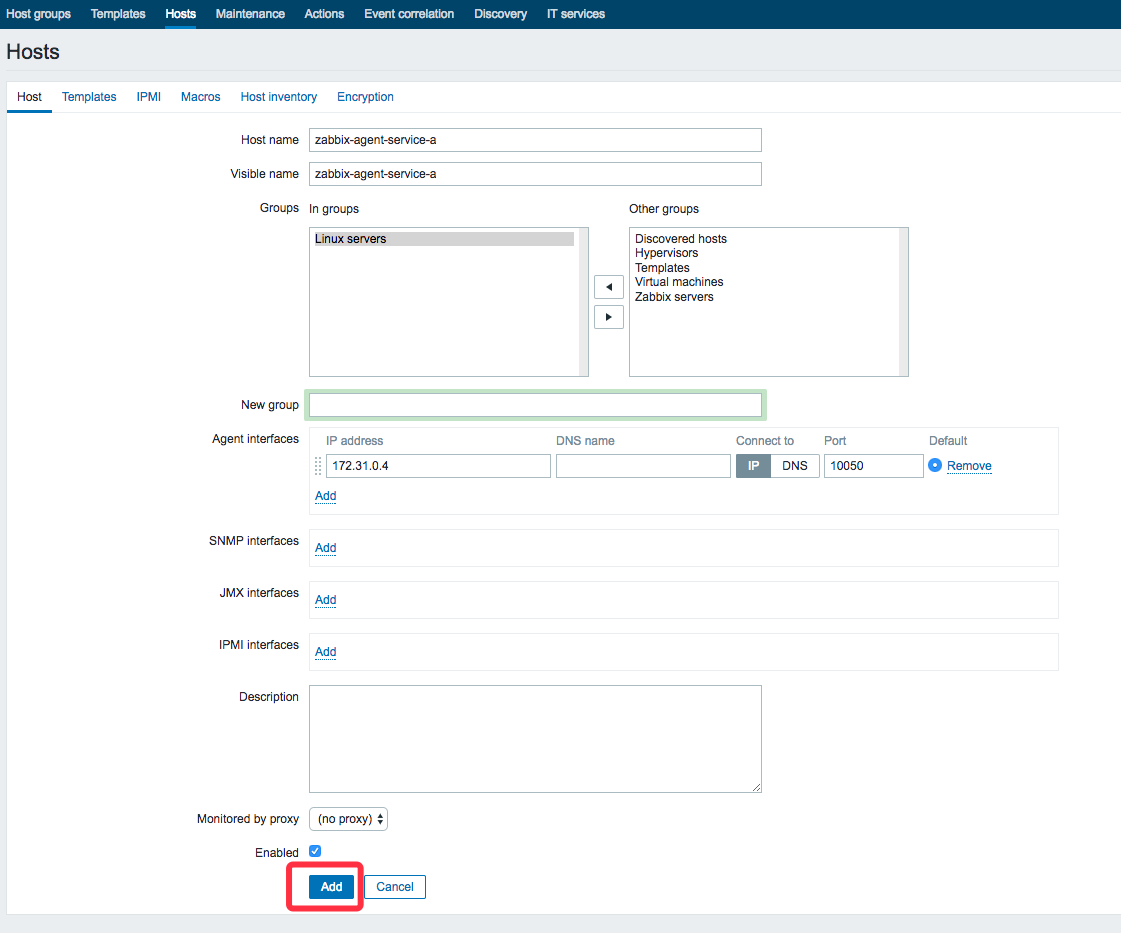
Adding machine page, fill in the following main parameters:
. A Host name: ZBX_HOSTNAME machine environment variable values: zabbix-agent-service-a;
. B Visible name: Host name and value of the same;
. C Groups: grouping machine, Pick Linux servers;
. d Agent interfaces: there is only need to fill out the IP address, that is, we have just the command Docker Exec -it zabbix-Agent-A ip addr ip obtained: 172.31.0.4;
this page only need to fill more than four points, the other Keep the default value, after completed the bottom, click "Add" button, as shown below:
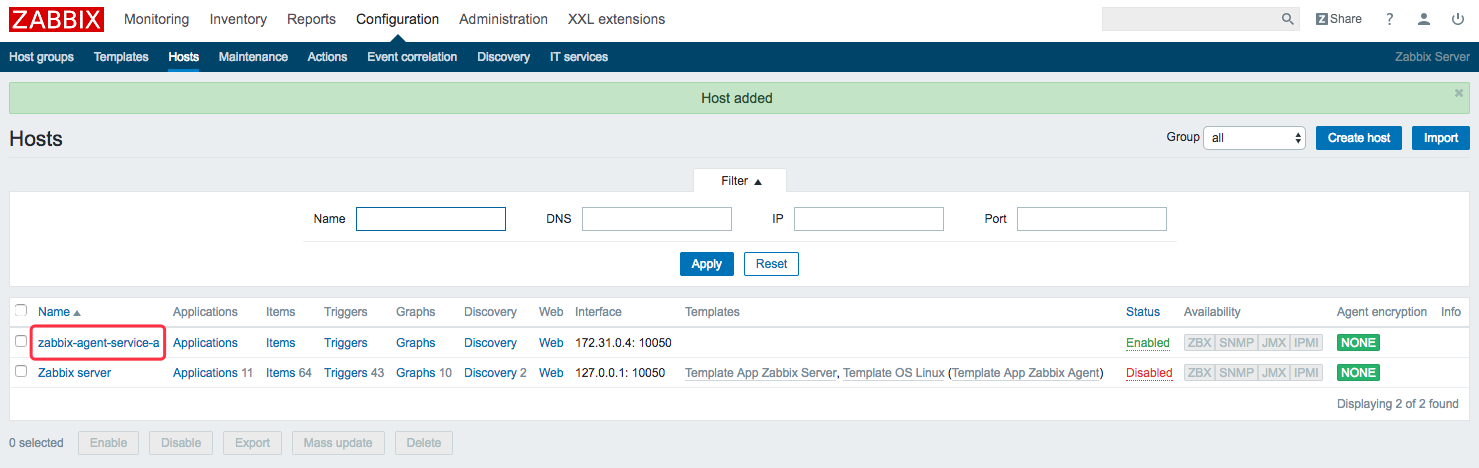
After the increase the success, the list can be seen in the new machine, as shown below:
Add monitoring items
In the machine list page, click on the name of the machine, as shown in the red box location:
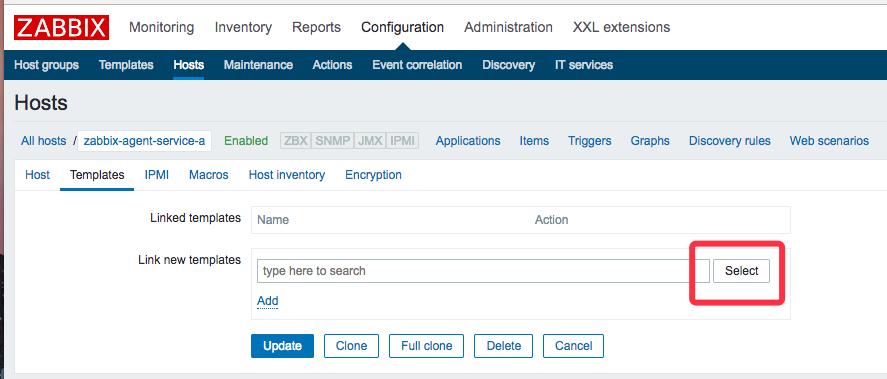
In the page that opens click on "Templates", red box shown in the following figure:
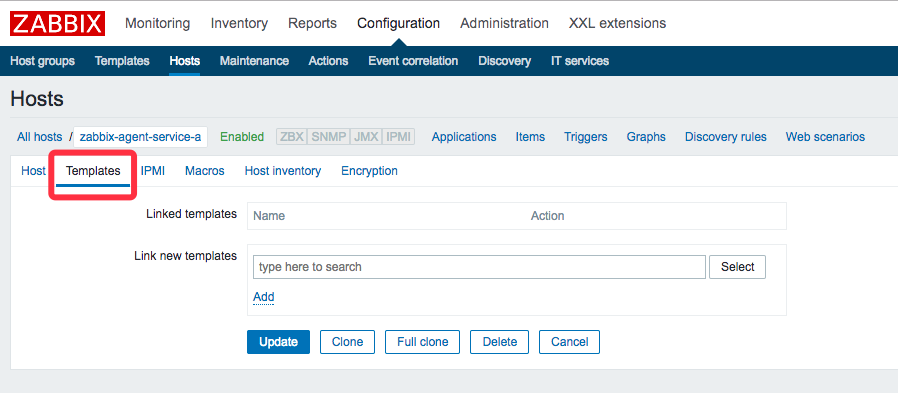
Click "Select" button, as shown in FIG red box:
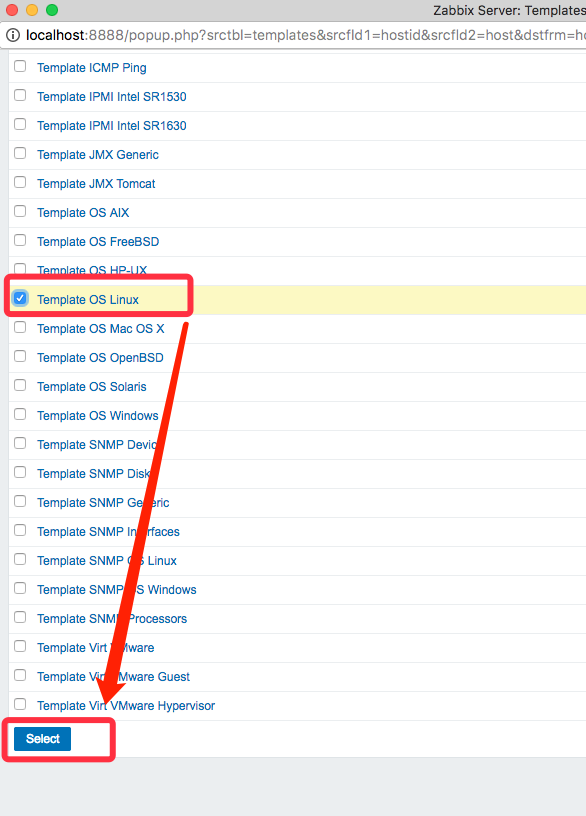
In the pop-up page, select the "Template OS Linux", and then click on the "Select" button at the bottom, so put linux commonly used term monitoring services to add bulk and the following diagram:
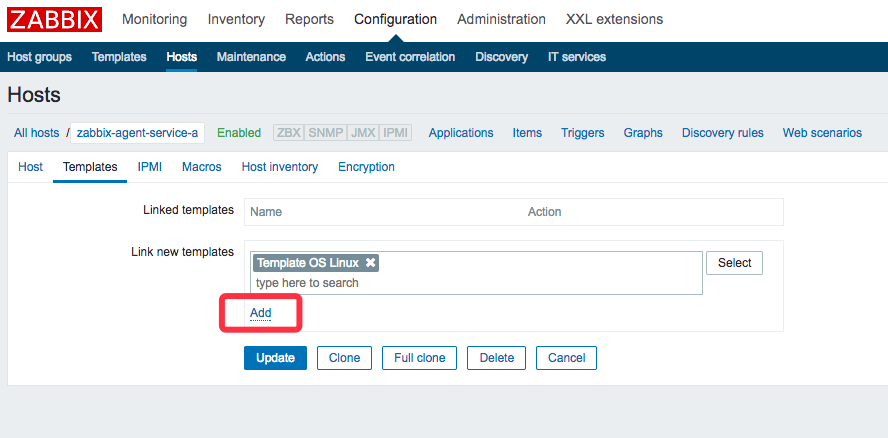
Note that the page returned, be sure to click "Add" to make the choice to just add , as follows:
Then click "Update", complete batch add monitored items, as shown below:
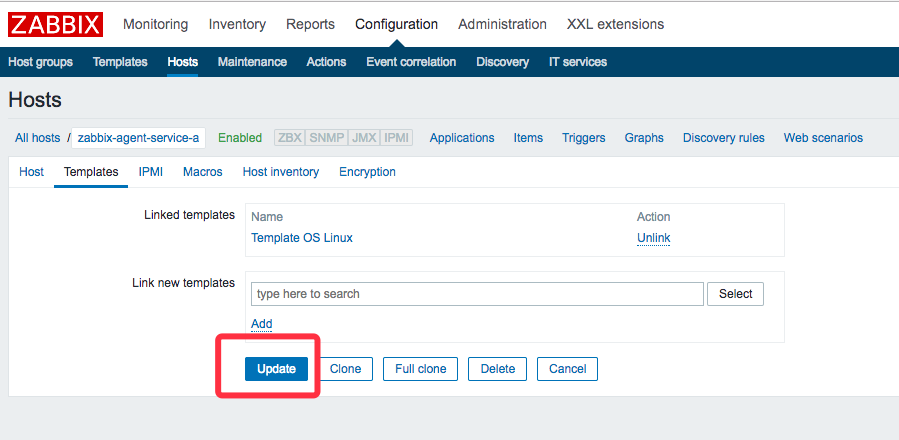
In the same manner the monitoring of another machine also add;
After waiting for about 1-2 minutes, then refresh the hosts page, you can see the list of "ZBX" icon has been changed to green, indicating that surveillance has entered into force;
View monitoring information
We take a look at the graph to monitor it, click below the red box "Graphs":
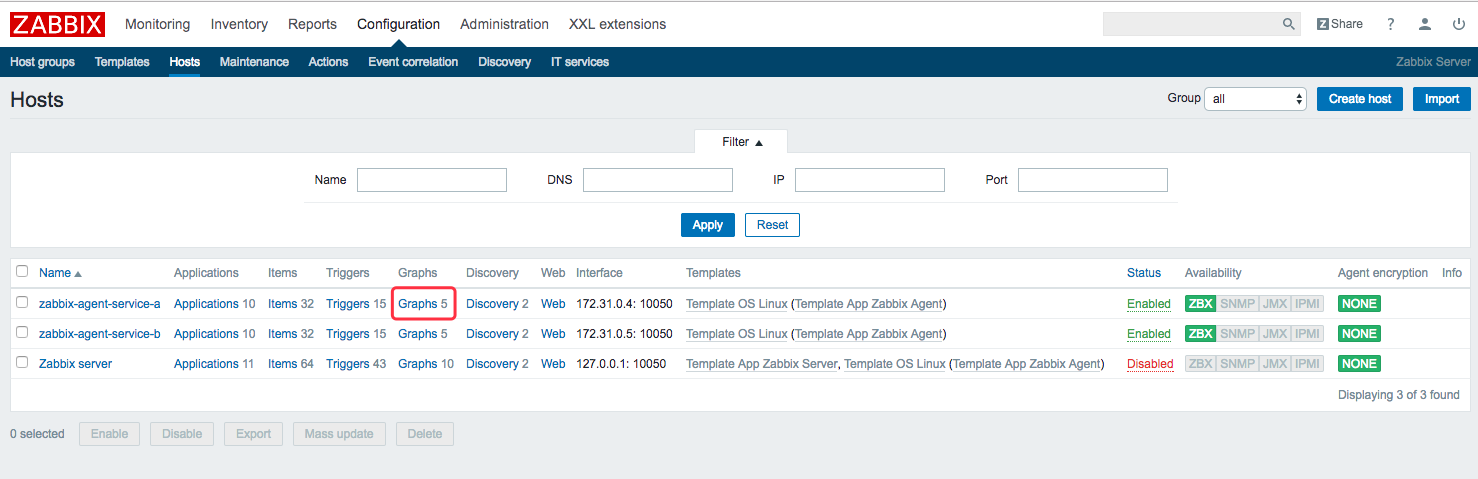
We can see there are five graphs can be viewed, as shown below, we look at the cpu load:
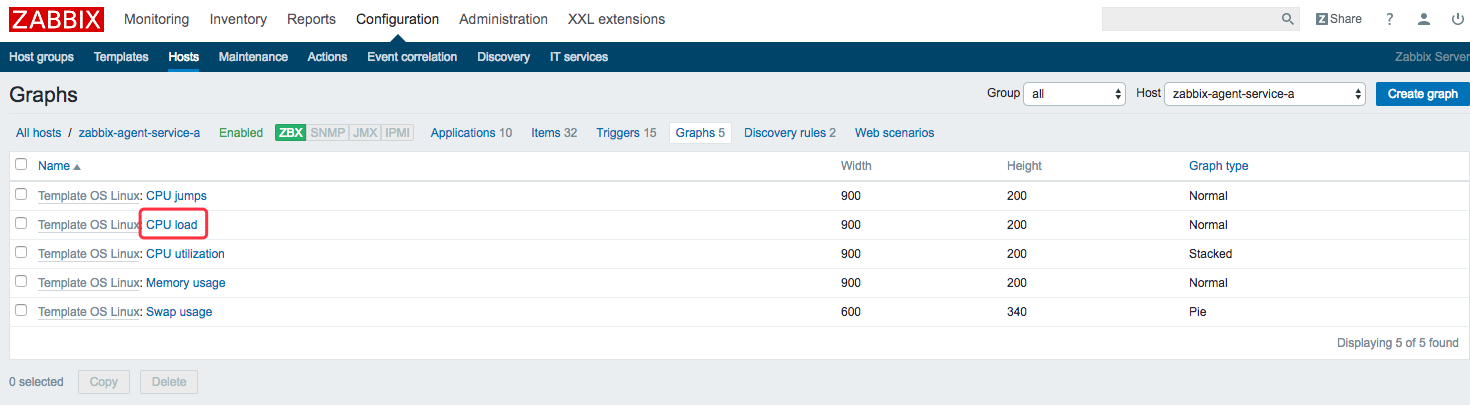
In the jump page, click on the "Previdew", you can see a graph of the cpu load, as shown below:
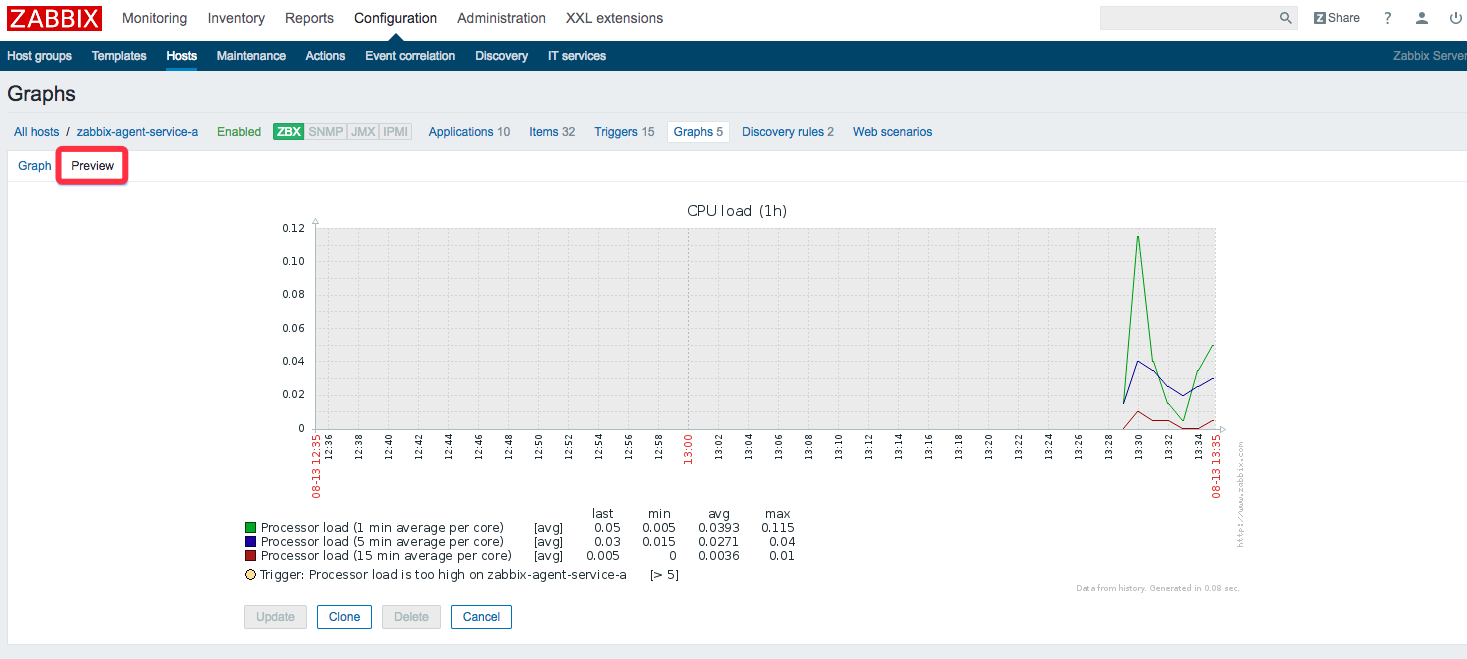
At this point, we add monitor the machine's actual combat has been completed, but in a real scenario, we addition to monitoring basic information cpu, disk, etc., but also to monitor data related to some business, such as an http service visits per minute, the next chapter "real zabbix trilogy under Docker three: custom monitoring item" , together we developed a real custom monitor.
I welcome the attention of the public number