Outline
We originally wanted to analyze performance on a server, you need to perform a series of linux commands. For linux command unfamiliar people, the more difficult
Now integrated set of shell scripts, the commonly used linux commands are included in it, one-click analysis of performance bottlenecks
Script function
1, View CPU utilization and load (top, vmstat, sar)
2, view the disk, Inode utilization and I / O load (df, iostat, iotop, sar, dstat)
3, view memory usage (free, vmstat)
4. Check TCP connections (netstat, ss)
5, view the CPU and memory footprint of up to 10 processes (top, ps)
6, view network traffic (ifconfig, iftop, iptraf)
Script as follows
#!/bin/bash
#
os_check() {
if [ -e /etc/redhat-release ]; then
REDHAT=`cat /etc/redhat-release |cut -d' ' -f1`
else
DEBIAN=`cat /etc/issue |cut -d' ' -f1`
fi
if [ "$REDHAT" == "CentOS" -o "$REDHAT" == "Red" ]; then
P_M=yum
elif [ "$DEBIAN" == "Ubuntu" -o "$DEBIAN" == "ubutnu" ]; then
P_M=apt-get
else
Operating system does not support.
exit 1
fi
}
if [ $LOGNAME != root ]; then
echo "Please use the root account operation."
exit 1
fi
if ! which vmstat &>/dev/null; then
echo "vmstat command not found, now the install."
sleep 1
os_check
$P_M install procps -y
echo "-----------------------------------------------------------------------"
fi
if ! which iostat &>/dev/null; then
echo "iostat command not found, now the install."
sleep 1
os_check
$P_M install sysstat -y
echo "-----------------------------------------------------------------------"
fi
while true; do
select input in cpu_load disk_load disk_use disk_inode mem_use tcp_status cpu_top10 mem_top10 traffic quit; do
case $input in
cpu_load)
#CPU利用率与负载
echo "---------------------------------------"
i=1
while [[ $i -le 3 ]]; do
echo -e "\033[32m 参考值${i}\033[0m"
UTIL=`vmstat |awk '{if(NR==3)print 100-$15"%"}'`
USER=`vmstat |awk '{if(NR==3)print $13"%"}'`
SYS=`vmstat |awk '{if(NR==3)print $14"%"}'`
IOWAIT=`vmstat |awk '{if(NR==3)print $16"%"}'`
echo "Util: $UTIL"
echo "User use: $USER"
echo "System use: $SYS"
echo "I/O wait: $IOWAIT"
i=$(($i+1))
sleep 1
done
echo "---------------------------------------"
break
;;
disk_load)
#硬盘I/O负载
echo "---------------------------------------"
i=1
while [[ $i -le 3 ]]; do
echo -e "\033[32m 参考值${i}\033[0m"
UTIL=`iostat -x -k |awk '/^[v|s]/{OFS=": ";print $1,$NF"%"}'`
READ=`iostat -x -k |awk '/^[v|s]/{OFS=": ";print $1,$6"KB"}'`
WRITE=`iostat -x -k |awk '/^[v|s]/{OFS=": ";print $1,$7"KB"}'`
IOWAIT=`vmstat |awk '{if(NR==3)print $16"%"}'`
echo -e" $ {} UTIL "
Echo -e" useful "
echo -e "I/O Wait: $IOWAIT"
echo -e "Read/s:\n$READ"
echo -e "Write/s:\n$WRITE"
i=$(($i+1))
sleep 1
done
echo "---------------------------------------"
break
;;
disk_use)
#硬盘利用率
DISK_LOG=/tmp/disk_use.tmp
DISK_TOTAL=`fdisk -l |awk '/^Disk.*bytes/&&/\/dev/{printf $2" ";printf "%d",$3;print "GB"}'`
USE_RATE=`df -h |awk '/^\/dev/{print int($5)}'`
for i in $USE_RATE; do
if [ $i -gt 90 ];then
PART=`df -h |awk '{if(int($5)=='''$i''') print $6}'`
echo "$PART = ${i}%" >> $DISK_LOG
fi
done
echo "---------------------------------------"
echo -e "Disk total:\n${DISK_TOTAL}"
if [ -f $DISK_LOG ]; then
echo "---------------------------------------"
cat $DISK_LOG
echo "---------------------------------------"
rm -f $DISK_LOG
else
echo "---------------------------------------"
echo "Disk use rate no than 90% of the partition."
echo "---------------------------------------"
fi
break
;;
disk_inode)
#硬盘inode利用率
INODE_LOG=/tmp/inode_use.tmp
INODE_USE=`df -i |awk '/^\/dev/{print int($5)}'`
for i in $INODE_USE; do
if [ $i -gt 90 ]; then
PART=`df -h |awk '{if(int($5)=='''$i''') print $6}'`
echo "$PART = ${i}%" >> $INODE_LOG
fi
done
if [ -f $INODE_LOG ]; then
echo "---------------------------------------"
rm -f $INODE_LOG
else
echo "---------------------------------------"
echo "Inode use rate no than 90% of the partition."
echo "---------------------------------------"
fi
break
;;
mem_use)
#内存利用率
echo "---------------------------------------"
MEM_TOTAL=`free -m |awk '{if(NR==2)printf "%.1f",$2/1024}END{print "G"}'`
USE=`free -m |awk '{if(NR==3) printf "%.1f",$3/1024}END{print "G"}'`
FREE=`free -m |awk '{if(NR==3) printf "%.1f",$4/1024}END{print "G"}'`
CACHE=`free -m |awk '{if(NR==2) printf "%.1f",($6+$7)/1024}END{print "G"}'`
echo -e "Total: $MEM_TOTAL"
echo -e "Use: $USE"
echo -e "Free: $FREE"
echo -e "Cache: $CACHE"
echo "---------------------------------------"
break
;;
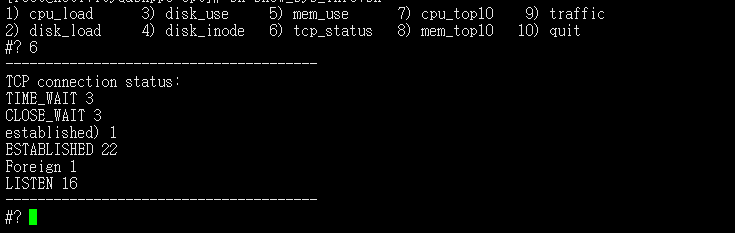
tcp_status)
#网络连接状态
echo "---------------------------------------"
COUNT=`netstat -antp |awk '{status[$6]++}END{for(i in status) print i,status[i]}'`
echo -e "TCP connection status:\n$COUNT"
echo "---------------------------------------"
# 11 from start printing cycle (process name), if i is equal to the last line, print column i and line breaks, otherwise i print columns
;;
cpu_top10)
#占用CPU高的前10个进程
echo "---------------------------------------"
CPU_LOG=/tmp/cpu_top.tmp
i=1
while [[ $i -le 3 ]]; do
#ps aux |awk '{if($3>0.1)print "CPU: "$3"% -->",$11,$12,$13,$14,$15,$16,"(PID:"$2")" |"sort -k2 -nr |head -n 10"}' > $CPU_LOG
ps aux |awk '{if($3>0.1){{printf "PID: "$2" CPU: "$3"% --> "}for(i=11;i<=NF;i++)if(i==NF)printf $i"\n";else printf $i}}' |sort -k4 -nr |head -10 > $CPU_LOG
if [[ -n `cat $CPU_LOG` ]]; then
echo -e "\ 033 [32m reference value {I} $ \ 033 [0m "
> $ CPU_LOG
CAT CPU_LOG $
the else
echo "No The Process the using the CPU."
BREAK
Fi
I $ = ((I + $. 1))
SLEEP. 1
DONE
echo "---------------------- ----------------- "
BREAK
;;
mem_top10)
# occupy high memory before 10 process
echo" ---------------- ----------------------- "
MEM_LOG = / tmp / mem_top.tmp
I =. 1
the while [[$ I -le. 3]]; do
#ps aux |awk '{if($4>0.1)print "Memory: "$4"% -->",$11,$12,$13,$14,$15,$16,"(PID:"$2")" |"sort -k2 -nr |head -n 10"}' > $MEM_LOG
ps aux |awk '{if($4>0.1){{printf "PID: "$2" Memory: "$3"% --> "}for(i=11;i<=NF;i++)if(i==NF)printf $i"\n";else printf $i}}' |sort -k4 -nr |head -10 > $MEM_LOG
if [[ -n `cat $MEM_LOG` ]]; then
echo -e "\033[32m 参考值${i}\033[0m"
cat $MEM_LOG
> $MEM_LOG
else
echo "No process using the Memory."
break
fi
i=$(($i+1))
sleep 1
done
echo "---------------------------------------"
break
;;
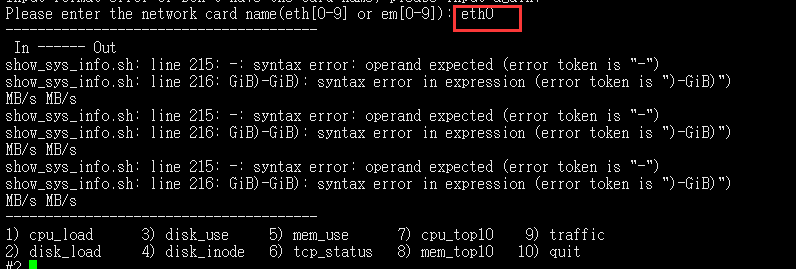
traffic)
#查看网络流量
while true; do
read -p "Please enter the network card name(eth[0-9] or em[0-9]): " eth
#if [[ $eth =~ ^eth[0-9]$ ]] || [[ $eth =~ ^em[0-9]$ ]] && [[ `ifconfig |grep -c "\<$eth\>"` -eq 1 ]]; then
if [ `ifconfig |grep -c "\<$eth\>"` -eq 1 ]; then
break
else
echo "Input format error or Don't have the card name, please input again."
fi
done
echo "---------------------------------------"
echo -e " In ------ Out"
i=1
while [[ $i -le 3 ]]; do
#OLD_IN=`ifconfig $eth |awk '/RX bytes/{print $2}' |cut -d: -f2`
#OLD_OUT=`ifconfig $eth |awk '/RX bytes/{print $6}' |cut -d: -f2`
OLD_IN=`ifconfig $eth |awk -F'[: ]+' '/bytes/{if(NR==8)print $4;else if(NR==5)print $6}'`
# CentOS6 CentOS7 ifconfig and outputs flow rate information out of different positions, CentOS6 the RX and TX line number is equal to 8, CentOS7 the line number is 5 RX, TX line number is 5, so we made a judgment.
OLD_OUT=`ifconfig $eth |awk -F'[: ]+' '/bytes/{if(NR==8)print $9;else if(NR==7)print $6}'`
sleep 1
NEW_IN=`ifconfig $eth |awk -F'[: ]+' '/bytes/{if(NR==8)print $4;else if(NR==5)print $6}'`
NEW_OUT=`ifconfig $eth |awk -F'[: ]+' '/bytes/{if(NR==8)print $9;else if(NR==7)print $6}'`
IN=`awk 'BEGIN{printf "%.1f\n",'$((${NEW_IN}-${OLD_IN}))'/1024/128}'`
OUT=`awk 'BEGIN{printf "%.1f\n",'$((${NEW_OUT}-${OLD_OUT}))'/1024/128}'`
echo "${IN}MB/s ${OUT}MB/s"
i=$(($i+1))
sleep 1
done
echo "---------------------------------------"
break
;;
quit)
exit 0
;;
*)
echo "---------------------------------------"
echo "Please enter the number."
echo "---------------------------------------"
break
;;
esac
done
done
The following operating results
# sh show_sys_info.sh
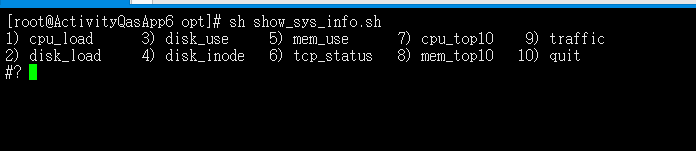
1) cpu_load: cpu analysis
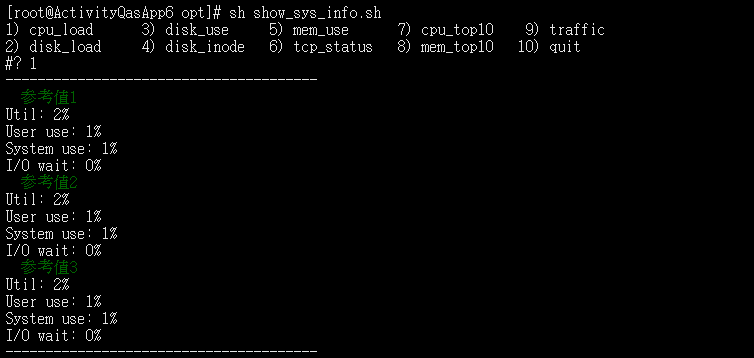
util: cpu percentage used
user use: users cpu percentage
system use: the percentage of cpu System
I / O wait: I / O wait percentage
Three refresh interval 1s
2) disk_load analyze disk

Util: percentage of the disk processed per second
vda:
the I / O the Wait: waiting time the IO
Read / s: the amount of data per disk read
vda:
the Write / S: Disk write data amount per second
vda:
3) disk_use disk usage

disk total: print the number of disks and disk partitions usage
4) disk_inode disk inodo if there is more than 90%, there will be printed
5) mem_use memory usage
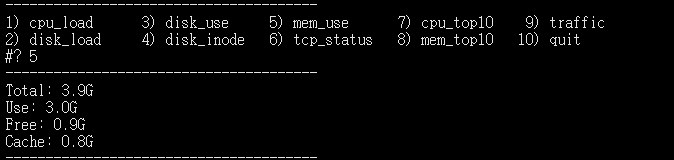
Total: Total Memory
use: memory used
free: free memory
cache: cache memory for
6) tcp_status tcp state
7) cpu_top10 occupied cpu ten largest process
8) mem_top10 memory for the ten largest process
9) traffic flow in and out to view the card