If the program linked to death, sometimes used jstack view the thread information in the process, you need to add the parameter on -F, at this time if there is a deadlock information, it may not be printed deadlock stack information, use jdb, you can view the current deadlock thread operating stack.
As a simple simulation program deadlock
package com.demo.bootdemo;

import java.util.HashMap;
import java.util.Map;

import org.springframework.context.ApplicationListener;
import org.springframework.context.event.ContextRefreshedEvent;
import org.springframework.stereotype.Component;

@Component
public class MyListeners implements ApplicationListener<ContextRefreshedEvent> {

    private Map map = new HashMap<>();
    private String lock = "aa";

    @Override
    public void onApplicationEvent(ContextRefreshedEvent arg0) {

        Thread t = new Thread(new Runnable() {

            @Override
            public void run() {
                synchronized (map) {
                    System.out.println(Thread.currentThread().getName() + ": 获得map锁");
                    try {
                        Thread.sleep(1000);
                    } catch (InterruptedException e) {
                        // TODO Auto-generated catch block
                        e.printStackTrace();
                    }
                    synchronized (lock) {
                        System.out.println(Thread.currentThread().getName() + ": 获得lock锁");
                    }
                }
            }
        }, "t-1");

        Thread t2 = new Thread(new Runnable() {

            @Override
            public void run() {
                synchronized (lock) {
                    System.out.println(Thread.currentThread().getName() + ": 获得lock锁");
                    try {
                        Thread.sleep(1000);
                    } catch (InterruptedException e) {
                        // TODO Auto-generated catch block
                        e.printStackTrace();
                    }
                    synchronized (map) {
                        System.out.println(Thread.currentThread().getName() + ": 获得map锁");
                    }
                }
            }
        }, "t-2");

        t.start();
        t2.start();
    }

}
Get pid

Suppose the current virtual machine can not be connected directly to 27709, it is necessary to use parameter -F

Deadlock can be seen that the thread is not t-1 and t-2
Use jdb connection jvm
jdb -connect sun.jvm.hotspot.jdi.SAPIDAttachingConnector: pid = 27709

Execution threads command to get a list of all threads
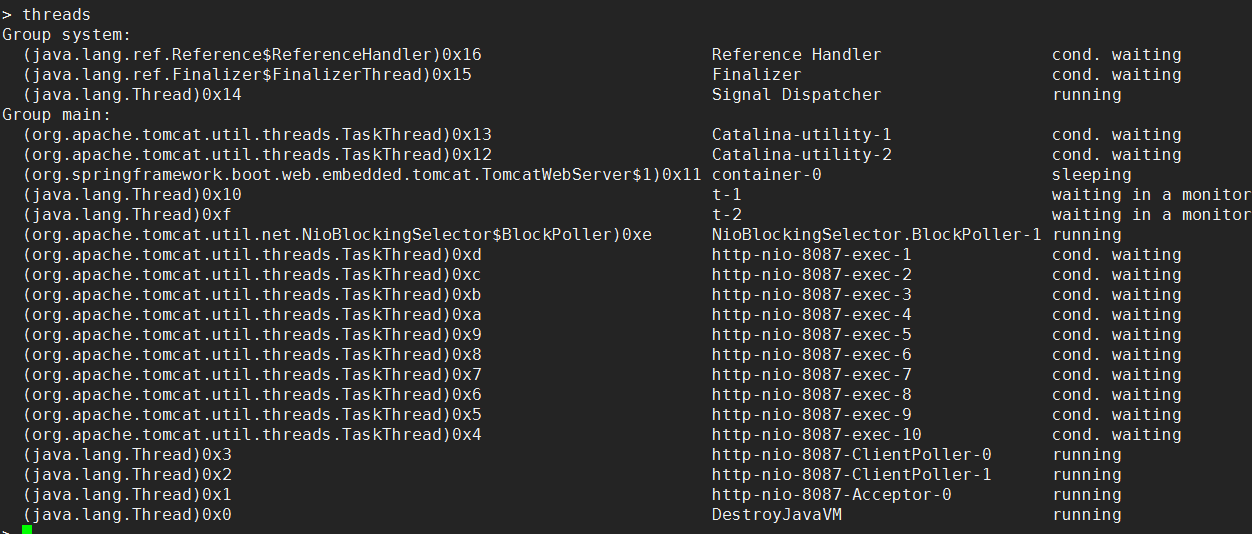
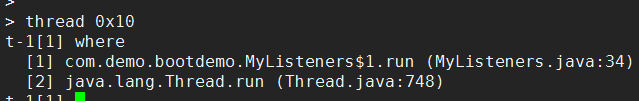
Get Thread "t-1" stack information, as shown below, in conjunction with the analog deadlock code, it is easy to see where the problem
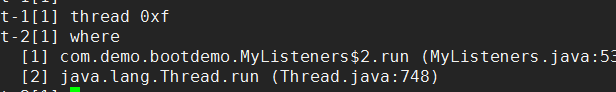
Similarly, the acquiring thread "t-2" stack information
Through the above steps, the code in question can be determined substantially.
The present embodiment is simply viewed under a rush document, there is no detailed look, added during a subsequent time, the following documents JDB
https://docs.oracle.com/javase/8/docs/technotes/guides/troubleshoot/tooldescr011.html#BABDHAHJ