First, install
Double-click kafkatool_64bit.exe installation kafka visualization tools, and C: \ Windows \ System32 \ drivers \ etc HOSTS configuration, open the HOSTS and add:
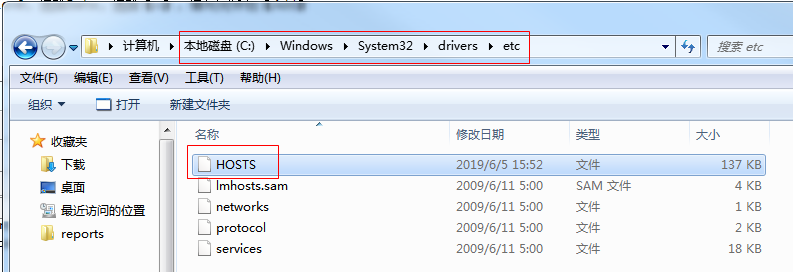
HOSTS added:
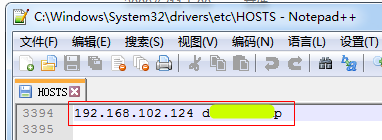
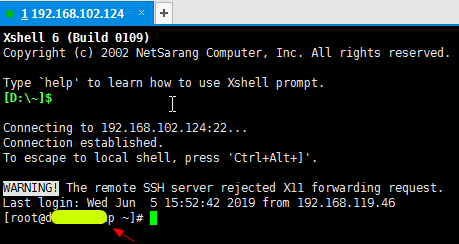
The domain HOSTS added, it is kafka install server IP user name, login linux server to check if necessary
Second, simple to use
1, find Kafka Tool 2.0 shortcut icon on the desktop, double-click into the visualization tool
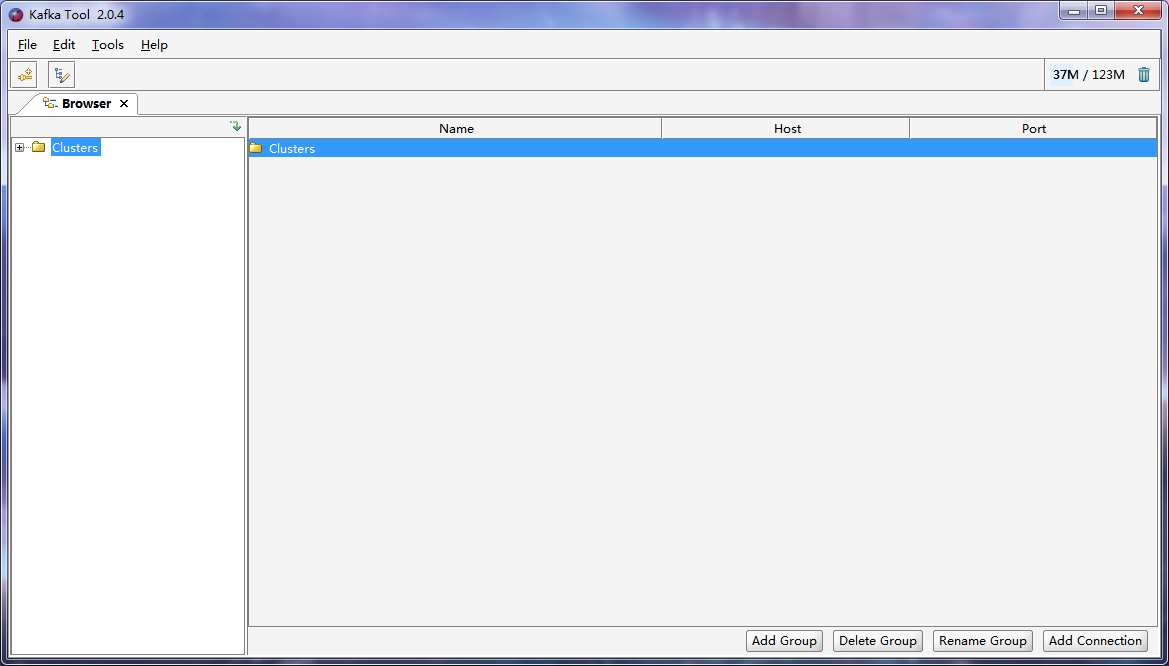
2, upper left corner of File-Add New Connection ..., add links

(1) File-Add New Connection ...- Add Cluster, shells disposed below the frame
General configuration:
Cluster name=192.168.102.124:2181
Kafka Cluster Version=0.11
Zookeeper Host=192.168.102.124
Zookeeper Port=2181
Advanced Configuration:
Bootstrap servers=192.168.102.124:9092
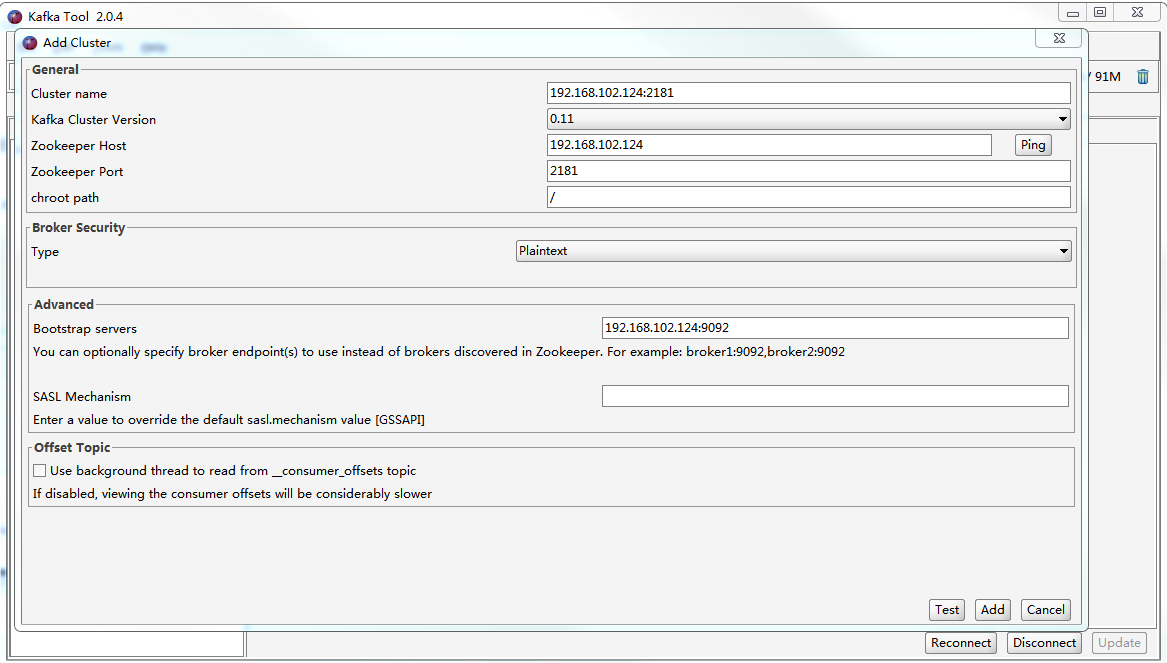
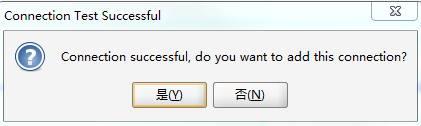
(2) do not fill in the other, [Test] success, is [point], is added to visualization tools
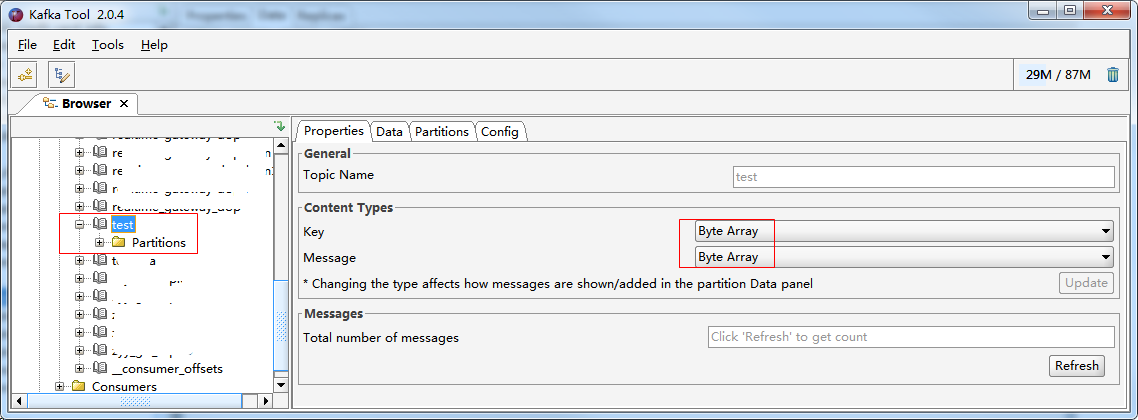
3, push push data before modifying the data format configuration, further pushing data modified
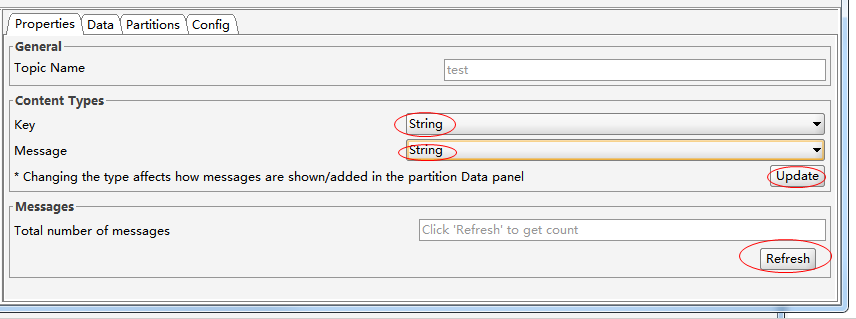
(1) pushing data modified front push data format configuration: Cluster name double-click the connection Topics, expand topic, find the target topic. Since kafka tool defaults to hexadecimal incoming, click on topic, choose Properties, Key under Content Types and select Message String, click [update] - [refresh] to use the normal string format.
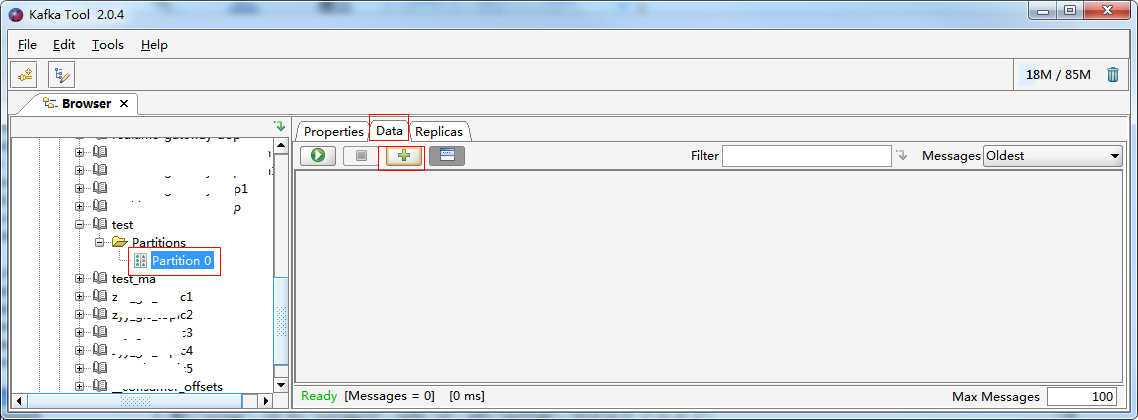
(2) Expand Partions under the topic, click Partion0, choose Data, select [+]
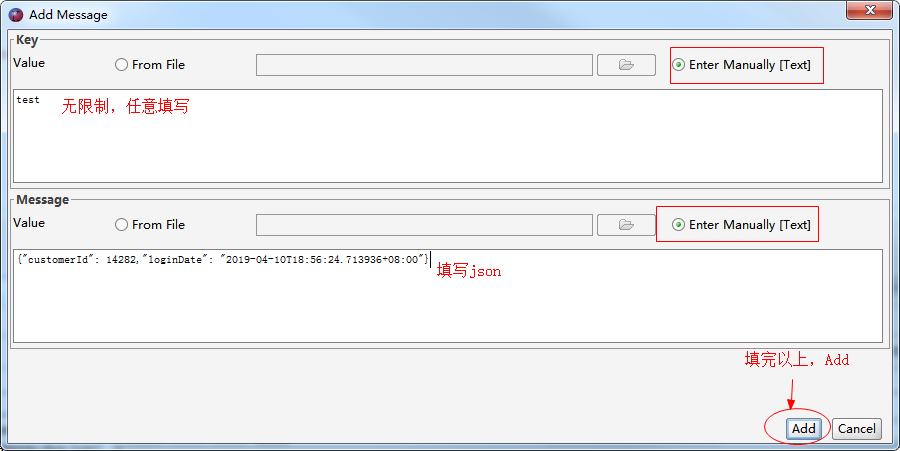
(3)推送数据:【+】,弹出Add Message框,Key下value选择Enter Manually[Text],Message下value选择Enter Manually[Text],填写完毕后【Add】
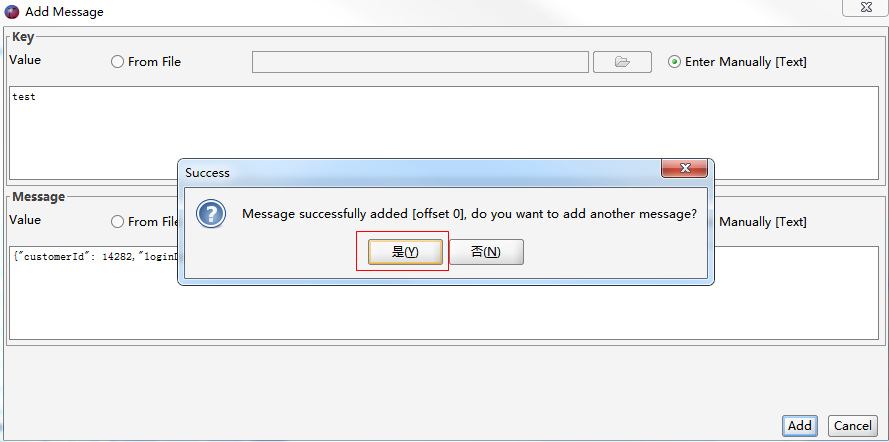
【Add】完后会弹框提示是否继续添加下一条数据,若要继续则【是】,若不需要则【否】关闭弹框
4、除了添加数据,还可以查看历史推送数据,topic下-Partitions-Partition 0,点击 按钮则在列表显示历史推送数据
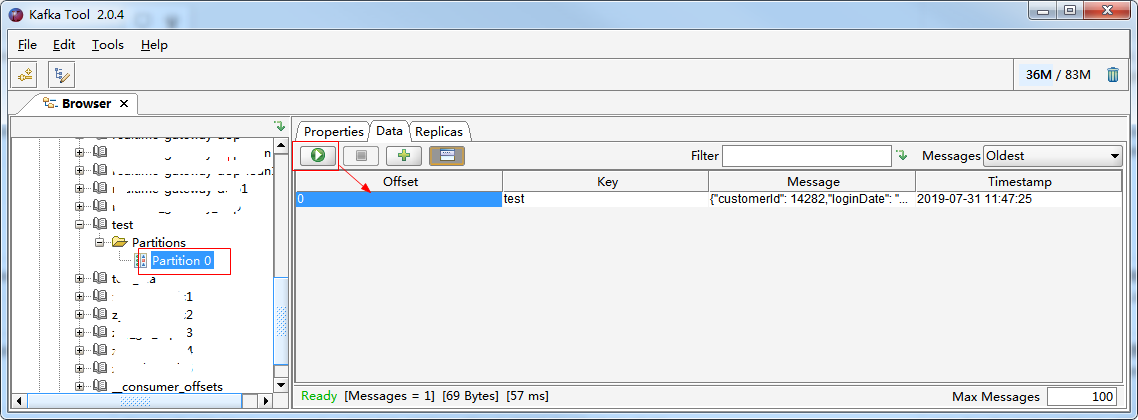
点击 ,列表下方选择TAB Message,可以看到原json

本文内容均自己编写,若觉得不够细节可以进一步参考:
https://www.cnblogs.com/frankdeng/p/9452982.html
https://www.cnblogs.com/frankdeng/p/9403883.html