Before the introduction of the performance evaluation so many classification models ( " Performance Evaluation Model classification (Classification Model Performance Evaluation Metric) " ), then in the end what indicators should choose their own model to assess it? The answer is to be selected according to the application scenario.
Recall (the Recall) : Recall contrasting with the real situation: hypothesis test set which has positive class 100, wherein if the predicted model 40 is positive type, Recall that the model is 40%. Recall also called the recall rate is equivalent to sensitivity (Sensitivity) and the real rate (True Positive Rate, TPR) .

Application of scene recall : the need for as much as possible to the desired category detected regardless of the results are accurate. For example, for earthquake prediction, we hope that each earthquake can be predicted at this time can sacrifice precision. If a total of 10 earthquakes occurred, we would rather send out an alert 1000, so it can go 10 earthquake are covered (at this time recall is 100%, precision 1%), and do not send out 100 alarms, there are eight to earthquake prediction, but missed twice (recall at this time it was 80%, precision 8%).
Precision (Precision) : precision is relative in terms of predictions of the model: hypothetical model predicted a total of 100 positive class, of which 80 are correct, then the precision is 80%.

Precision application scenarios : as far as needed to accurately detect the desired category, and do not care whether these categories are detected. For example, the prediction criminals, we want to predict the result is very accurate, even if sometimes miss some real criminals, not wronged a good person.
F1 : F1 Score is precision and recall rate averaged, but this is not taking the arithmetic mean, but take the harmonic mean. why? Because the harmonic mean closer to the smaller value, such precision or recall in which a smaller value, the harmonic mean even close to this value, this measure is more stringent.

 or
or 
F1 application scenarios : In the case where both require the same precision and high recall, F1 can be measured.
Recall and precision are the two most commonly used classification index, it will be used in addition to the following indicators:
(Note: The recall is often medically known true positive rate (True Positive Rate, TPR) .)
The false positive rate (False Positive Rate, FPR) : In medicine, also known asthe misdiagnosis rate, equal to1-- specificity (Specificity).
False negative rate (False Negative Rate, FNR) : In medicine , also known as the rate of misdiagnosis , equal to 1-- sensitivity (Sensitivity) .
In reality, people tend to recall and precision are required, but will favor one side or depending on the application scenario. For example, do disease detection, we want as much as possible to be detected disease, but also do not want to be too low accuracy of test results, as this will cause panic and unnecessary medical expenses (biased recall). Another example for detecting spam (Spam Detection), we want to detect spam is definitely spam, do not want the normal mail messages classified as spam, because it may give the customer cause great losses, but relatively , if we often spam classified as normal mail, although not too costly, but will affect the user experience (bias precision). Another example is if it is done the search, and search out the pages are keyword relevant is a good search engine, in this case, we hope that some of the high precision (bias precision). Then you should use PR curve.
PR curve : x-axis to recall, y-axis precision.
PR curve scenarios : the need to find a corresponding value in accordance with the needs of the precision and recall. If tend precison, that is, to enhance the precision in ensuring the recall of; if you prefer to recall, recall that in the case of guarantee to enhance the precision. For example, for fraud detection (Fraud Detection), if asked to predict a crowd of potential fraud as accurate as possible, it is necessary to improve precision; but if you want as many people predict potential fraud, it is to improve recall. In general, raise the threshold dichotomous classification model can improve precision, lower classification threshold can improve the recall, then you can observe the PR curve, according to their needs, find the optimal classification threshold (threshold).
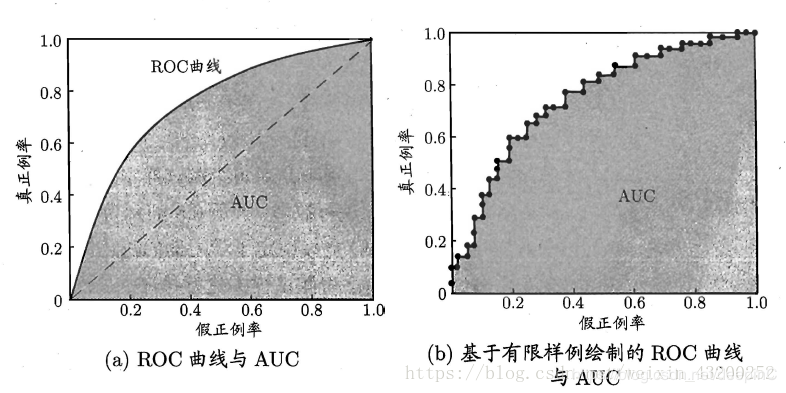
一般来说,模型的ROC-AUC值越大,模型的分类效果越好。不过如果两个模型AUC值差不多,并不代表这两个模型的效果相同。下面两幅图中两条ROC曲线相交于一点,AUC值几乎一样:当需要高Sensitivity时,模型A(细线)比B好;当需要高Speciticity时,模型B(粗线)比A好。

总结一下PR曲线和ROC曲线&AUC的区别:
1. PR曲线在正负样本比例比较悬殊时更能反映分类器的性能。当正负样本差距不大的情况下,ROC和PR的趋势是差不多的,但是当负样本很多的时候,两者就截然不同了,ROC效果依然看似很好,但是PR上反映效果一般。这就说明对于类别不平衡问题,ROC曲线通常会给出一个过于乐观的效果估计,此时还是用PR曲线更好。
2. ROC曲线由于兼顾正例与负例,适用于评估分类器的整体性能(通常是计算AUC,表示模型的排序性能);PR曲线则完全聚焦于正例,因此如果我们主要关心的是正例,那么用PR曲线比较好。
3. ROC曲线不会随着类别分布的改变而改变。然而,这一特性在一定程度上也是其缺点。因此需要根据不用的场景进行选择:比如对于欺诈检测,每个月正例和负例的比例可能都不相同,这时候如果只想看一下分类器的整体性能是否稳定,则用ROC曲线比较合适,因为类别分布的改变可能使得PR曲线发生变化,这种时候难以进行模型性能的比较;反之,如果想测试不同的类别分布对分类器性能的影响,则用PR曲线比较合适。
总的来说,我们应该根据具体的应用场景,在相应的曲线上找到最优的点,得到相对应的precision,recall,f1 score等指标,然后去调整模型的分类阈值,从而得到一个符合具体应用的模型。
附:
如何画PR曲线?
根据每个测试样本属于正样本的概率值从大到小排序,依次将这些概率值作为分类阈值,当测试样本属于正样本的概率大于或等于这个threshold时,我们认为它为正样本,否则为负样本。每次选取一个不同的threshold,我们就可以得到一组recall和precision,即PR曲线上的一点。取n组不同的分类阈值,就可以得到n个点,连接起来就成为一条曲线。threshold取值越多,PR曲线越平滑。
如何画ROC曲线?
根据每个测试样本属于正样本的概率值从大到小排序,依次将这些概率值作为分类阈值,当测试样本属于正样本的概率大于或等于这个threshold时,我们认为它为正样本,否则为负样本。每次选取一个不同的threshold,我们就可以得到一组FPR和TPR,即ROC曲线上的一点。取n组不同的分类阈值,就可以得到n个点,连接起来就成为一条曲线。threshold取值越多,ROC曲线越平滑。
如何计算AUC值?
假定ROC曲线是由坐标为 的点按序连接而形成,则AUC可估算为:
