0, background
Often do back-end service developed by the students, more or less met the CPU load is particularly high. Especially on weekends or most of the night, suddenly the group was particularly high load feedback line of machines, processes and ideas are not familiar with the positioning of students may pass rush aboard a server, positioning hundred thousand turn back.
In this regard, there are many students who collated the relevant processes or methodologies, similar to the elephant in the refrigerator a few steps, the traditional approach is generally four steps:
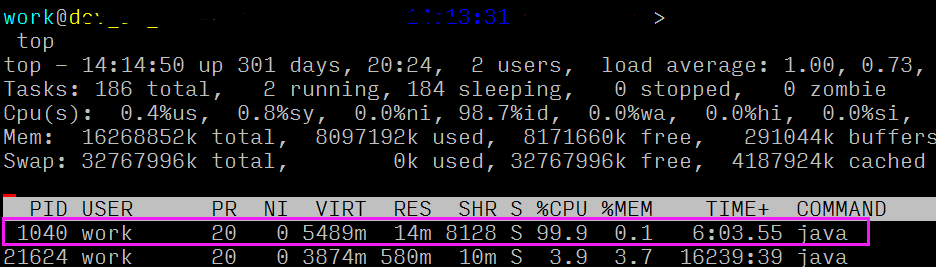
- top oder by with P: 1040 // First sort by process loads found axLoad (pid)
- top -Hp process PID: 1073 // find the thread load PID
- printf "0x% x \ n" thread PID: 0x431 // thread PID converted to hexadecimal, find jstack logs to prepare for later
- jstack process PID | vim + / hex thread PID - // example: jstack 1040 | vim + / 0x431 -
But for online problem locating it, every second counts, the above four steps too cumbersome or time-consuming, and there is no packages may become a tool, a key location, in seconds to find the line of code in question when there are problems?
of course can! Mature tool chain or not the operation and maintenance capabilities not only a developer, but also reflects a sense of efficiency for developers. Taobao oldratlee students will be above process package to a tool: Show-BUSY-the Java-Threads .sh (click to download directly, or refer to the end the link to download), these problems can easily locate online, here I two examples will look at the actual results.
Quick installation:
source <(curl -fsSL https://raw.githubusercontent.com/oldratlee/useful-scripts/master/test-cases/self-installer.sh)
1, java regular expressions back cause 100% CPU
import java.util.ArrayList;
import java.util.List;
import java.util.regex.Matcher;
import java.util.regex.Pattern;


public class RegexLoad {
    public static void main(String[] args) {
        String[] patternMatch = {"([\\w\\s]+)+([+\\-/*])+([\\w\\s]+)",
                "([\\w\\s]+)+([+\\-/*])+([\\w\\s]+)+([+\\-/*])+([\\w\\s]+)"};
        List<String> patternList = new ArrayList<String>();

        patternList.add("Avg Volume Units product A + Volume Units product A");
        patternList.add("Avg Volume Units /  Volume Units product A");
        patternList.add("Avg retailer On Hand / Volume Units Plan / Store Count");
        patternList.add("Avg Hand Volume Units Plan Store Count");
        patternList.add("1 - Avg merchant Volume Units");
        patternList.add("Total retailer shipment Count");

        for (String s :patternList ){

            for(int i=0;i<patternMatch.length;i++){
                Pattern pattern = Pattern.compile(patternMatch[i]);

                Matcher matcher = pattern.matcher(s);
                System.out.println(s);
                if (matcher.matches()) {

                    System.out.println("Passed");
                }else
                    System.out.println("Failed;");
            }

        }
    }
}
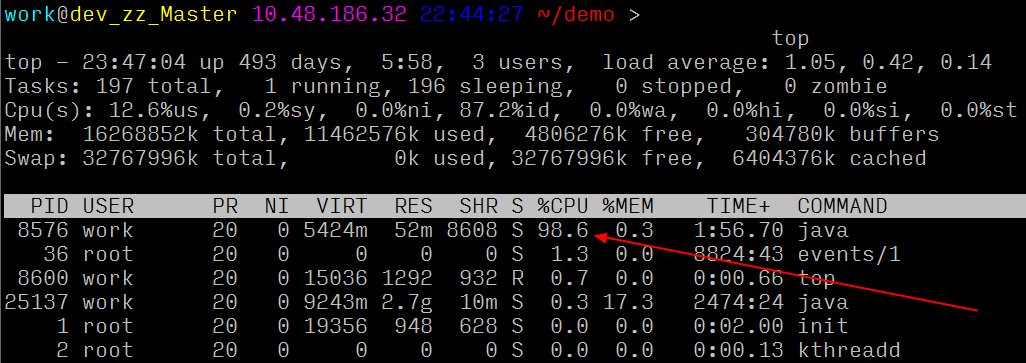
Compile and then run the above code, we will be able to observe more than java server processes a 100% CPU's:
How to use it?
show-busy-java-threads.sh
# identify the most CPU-intensive thread (default 5) from all the Java process, print out their thread stacks.show-busy-java-threads.sh -c <number of threads in the stack to display>
show-busy-java-threads.sh -c <number of threads in the stack to display> -p <Process specified by the Java>
# -F option: plus -F option when performing jstack command (mandatory jstack), generally do not need use
show-busy-java-threads.sh -p <specified Java Process> -Fshow-busy-java-threads.sh -s <full path specified command jstack>
# sudo mode for operating, can not pass JAVA_HOME environment variable to the root,
# root user, who often are not configured JAVA_HOME configuration and inconvenient,
# Explicit Specifies the path jstack commands on the contrary, appear to be more convenientshow-busy-java-threads.sh -a <output record to file>
show-busy-java-threads.sh -t <repeatedly executed the number of times> -i <perform repetition interval seconds>
# default execution time; default execution interval is 3 seconds##############################
# Note:
################# #############
# script execution if a user with the process of the current users of different Java, Java is not jstack this process.
# In order to switch to the user of the Java process, we need to add sudo to perform, that can be solved:
sudo show-busy-java-threads.sh
Example:
work@dev_zz_Master 10.48.186.32 23:45:50 ~/demo >
bash show-busy-java-threads.sh
[1] Busy(96.2%) thread(8577/0x2181) stack of java process(8576) under user(work):
"main" prio=10 tid=0x00007f0c64006800 nid=0x2181 runnable [0x00007f0c6a64a000]
   java.lang.Thread.State: RUNNABLE
        at java.util.regex.Pattern$GroupHead.match(Pattern.java:4168)
        at java.util.regex.Pattern$Loop.match(Pattern.java:4295)
        ...
        at java.util.regex.Matcher.match(Matcher.java:1127)
        at java.util.regex.Matcher.matches(Matcher.java:502)
        at RegexLoad.main(RegexLoad.java:27)

[2] Busy(1.5%) thread(8591/0x218f) stack of java process(8576) under user(work):
"C2 CompilerThread1" daemon prio=10 tid=0x00007f0c64095800 nid=0x218f waiting on condition [0x0000000000000000]
   java.lang.Thread.State: RUNNABLE

[3] Busy(0.8%) thread(8590/0x218e) stack of java process(8576) under user(work):
"C2 CompilerThread0" daemon prio=10 tid=0x00007f0c64093000 nid=0x218e waiting on condition [0x0000000000000000]
   java.lang.Thread.State: RUNNABLE

[4] Busy(0.2%) thread(8593/0x2191) stack of java process(8576) under user(work):
"VM Periodic Task Thread" prio=10 tid=0x00007f0c640a2800 nid=0x2191 waiting on condition

[5] Busy(0.1%) thread(25159/0x6247) stack of java process(25137) under user(work):
"VM Periodic Task Thread" prio=10 tid=0x00007f13340b4000 nid=0x6247 waiting on condition
work@dev_zz_Master 10.48.186.32 23:46:04 ~/demo >
It can be seen a key to locate abnormal direct line of code, it is not very convenient?
2, thread deadlocks, live program hang
import java.util.*;
public class SimpleDeadLock extends Thread {
public static Object l1 = new Object();
public static Object l2 = new Object();
private int index;
public static void main(String[] a) {
Thread t1 = new Thread1();
Thread t2 = new Thread2();
t1.start();
t2.start();
}
private static class Thread1 extends Thread {
public void run() {
synchronized (l1) {
System.out.println("Thread 1: Holding lock 1...");
try { Thread.sleep(10); }
catch (InterruptedException e) {}
System.out.println("Thread 1: Waiting for lock 2...");
synchronized (l2) {
System.out.println("Thread 2: Holding lock 1 & 2...");
}
}
}
}
private static class Thread2 extends Thread {
public void run() {
synchronized (l2) {
System.out.println("Thread 2: Holding lock 2...");
try { Thread.sleep(10); }
catch (InterruptedException e) {}
System.out.println("Thread 2: Waiting for lock 1...");
synchronized (l1) {
System.out.println("Thread 2: Holding lock 2 & 1...");
}
}
}
}
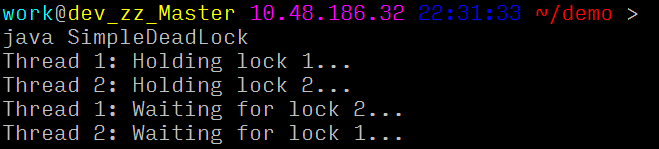
}After the implementation of the results:
How to position the tool:
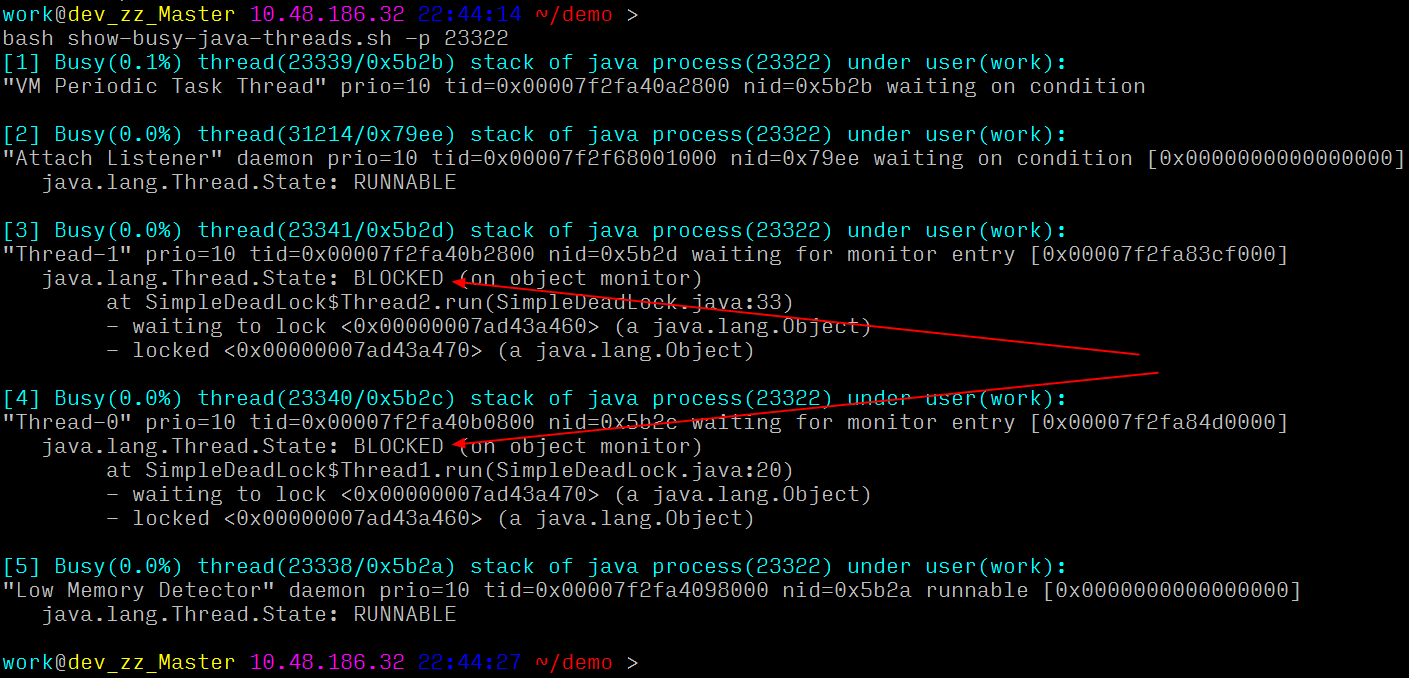
A key location: you can clearly see a thread lock to each other waiting for the other resources, leading to a deadlock, positioned directly to the line of code and the specific reasons.
By the above two examples, I think you should be on the students tools and tool can solve any problem with a deeper understanding, experiencing 100% CPU problem can no longer panic. But the more dependent we all still go to practice, practice makes perfect after all Well ~
3, free practical scripting tool spree
In addition to show-busy-java-threads.sh text mentioned, oldratlee and many students also integrate common development, operation and maintenance involved in the process of scripting tools, I simply feel under particularly useful columns:
(1)show-duplicate-java-classes
Occasionally encounter local development, tests are normal, but somehow on the line after the class anomaly, after untold hardships to find the reason turned out to be a conflict Jar! This tool can find duplicate class (Java libraries that Jar file) or Class directory (the directory category) in Java Lib.
A troublesome problem is that Java developers Jar conflict (ie multiple versions of Jar), or repeat classes. Will be a problem NoSuchMethod, etc., but also was not necessarily a problem. Jar find out duplicate class, you can take precautions.
# Find the current directory of all repeat classes Jar of
show-duplicate-java-classes# Find duplicate all Jar class in the specified directory under multiple
show-duplicate-java-classes path / to / lib_dir1 / path / to / lib_dir2# Find more specified repeat class in Class directory. Class directory specified by the -c option
show-duplicate-java-classes -c path / to / class_dir1 -c / path / to / class_dir2# 查找指定Class目录和指定目录下所有Jar中的重复类的Jar
show-duplicate-java-classes path/to/lib_dir1 /path/to/lib_dir2 -c path/to/class_dir1 -c path/to/class_dir2
例如:
# 在war模块目录下执行,生成war文件
$ mvn install
...
# 解压war文件,war文件中包含了应用的依赖的Jar文件
$ unzip target/*.war -d target/war
...
# 检查重复类
$ show-duplicate-java-classes -c target/war/WEB-INF/classes target/war/WEB-INF/lib
...
(2)find-in-jars
在当前目录下所有jar文件里,查找类或资源文件。
用法:注意,后面Pattern是grep的 扩展正则表达式。
find-in-jars 'log4j\.properties'
find-in-jars 'log4j\.xml$' -d /path/to/find/directory
find-in-jars log4j\\.xml
find-in-jars 'log4j\.properties|log4j\.xml'
示例:
$ ./find-in-jars 'Service.class$'
./WEB-INF/libs/spring-2.5.6.SEC03.jar!org/springframework/stereotype/Service.class
./rpc-benchmark-0.0.1-SNAPSHOT.jar!com/taobao/rpc/benchmark/service/HelloService.class
(3)housemd pid [java_home]
很早的时候,我们使用BTrace排查问题,在感叹BTrace的强大之余,也曾好几次将线上系统折腾挂掉。2012年淘宝的聚石写了HouseMD,将常用的几个Btrace脚本整合在一起形成一个独立风格的应用,其核心代码用的是Scala,HouseMD是基于字节码技术的诊断工具, 因此除了Java以外, 任何最终以字节码形式运行于JVM之上的语言, HouseMD都支持对它们进行诊断, 如Clojure(感谢@Killme2008提供了它的使用入门), scala, Groovy, JRuby, Jython, kotlin等.
使用housemd对java程序进行运行时跟踪,支持的操作有:
- 查看加载类
- 跟踪方法
- 查看环境变量
- 查看对象属性值
- 详细信息请参考: https://github.com/CSUG/HouseMD/wiki/UserGuideCN
(4)jvm pid
执行jvm debug工具,包含对java栈、堆、线程、gc等状态的查看,支持的功能有:
========线程相关=======
1 : 查看占用cpu最高的线程情况
2 : 打印所有线程
3 : 打印线程数
4 : 按线程状态统计线程数
========GC相关=======
5 : 垃圾收集统计(包含原因)可以指定间隔时间及执行次数,默认1秒, 10次
6 : 显示堆中各代的空间可以指定间隔时间及执行次数,默认1秒,5次
7 : 垃圾收集统计。可以指定间隔时间及执行次数,默认1秒, 10次
8 : 打印perm区内存情况*会使程序暂停响应*
9 : 查看directbuffer情况
========堆对象相关=======
10 : dump heap到文件*会使程序暂停响应*默认保存到`pwd`/dump.bin,可指定其它路径
11 : 触发full gc。*会使程序暂停响应*
12 : 打印jvm heap统计*会使程序暂停响应*
13 : 打印jvm heap中top20的对象。*会使程序暂停响应*参数:1:按实例数量排序,2:按内存占用排序,默认为1
14 : 触发full gc后打印jvm heap中top20的对象。*会使程序暂停响应*参数:1:按实例数量排序,2:按内存占用排序,默认为1
15 : 输出所有类装载器在perm里产生的对象。可以指定间隔时间及执行次数
========其它=======
16 : 打印finalzer队列情况
17 : 显示classloader统计
18 : 显示jit编译统计
19 : 死锁检测
20 : 等待X秒,默认为1
q : exit
进入jvm工具后可以输入序号执行对应命令
可以一次执行多个命令,用分号";"分隔,如:1;3;4;5;6
每个命令可以带参数,用冒号":"分隔,同一命令的参数之间用逗号分隔,如:
Enter command queue:1;5:1000,100;10:/data1/output.bin
(5)greys <PID>[@IP:PORT]
PS:目前Greys仅支持Linux/Unix/Mac上的Java6+,Windows暂时无法支持
Greys是一个JVM进程执行过程中的异常诊断工具,可以在不中断程序执行的情况下轻松完成问题排查工作。和HouseMD一样,Greys-Anatomy取名同名美剧“实习医生格蕾”,目的是向前辈致敬。代码编写的时候参考了BTrace和HouseMD两个前辈的思路。
使用greys对java程序进行运行时跟踪(不传参数,需要先greys -C pid,再greys)。支持的操作有:
- 查看加载类,方法信息
- 查看JVM当前基础信息
- 方法执行监控(调用量,失败率,响应时间等)
- 方法执行数据观测、记录与回放(参数,返回结果,异常信息等)
- 方法调用追踪渲染
- 详细信息请参考: https://github.com/oldmanpushcart/greys-anatomy/wiki
(6)sjk <cmd> <arguments> sjk --commands sjk --help <cmd>
使用sjk对Java诊断、性能排查、优化工具
- ttop:监控指定jvm进程的各个线程的cpu使用情况
- jps: 强化版
- hh: jmap -histo强化版
- gc: 实时报告垃圾回收信息
- 更多信息请参考: https://github.com/aragozin/jvm-tools
Refer:
[1] oldratlee/useful-scripts
https://github.com/oldratlee/useful-scripts
[2] awesome-scripts
https://github.com/superhj1987/awesome-scripts
[3] JDK自带工具之问题排查场景示例
[4] Java调优经验谈
[5] jvm排查工具箱jvm-tools
https://segmentfault.com/a/1190000012658814
[6] alibaba/arthas
https://github.com/alibaba/arthas/blob/7f236219ddbd040764dd821cbcbd44899dd57c90/README.md