The reason: The maximum number of open file handles in the operating system due to limited, often occurs in many concurrent users access the server's time. Because in order to execute each user's application server must load a lot of files (new a socket requires a file handle), which will lead to a lack of open file handle.
Solution:
a) Try to class labeled jar package, as a package consumes only a jar file handle, if not packaged, a consumption class to a file handle.
b) java GC can not close the file handle of open network connections, if not performed close () the file handle will always exist, it can not be closed.
It can also be considered to set the maximum number of open socket to control this problem. Operating system do the relevant settings, increase the maximum number of file handles.
ulimit -a can view the current system resource limits, ulimit -n 10240 can be modified, this modification is only valid for the current window.
------------------------------------
View data collection tomcat log, habitual first turn of the last log to see there is no unusual print, it was found that several anomalies, but most still this:

"Too manay open files" problem is very clear ah, can not open file descriptor limit is exceeded resulting in a file or create a network connection, this issue will lead to some other problems, ulimit is certainly not optimized, so check ulimit settings;
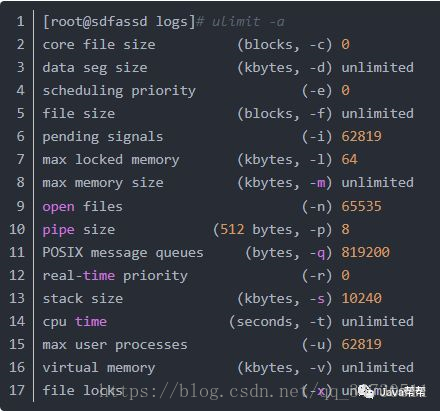
open files turned out to be 65535, the optimization has been done, is not the first to start tomcat and other services, and then fishes ulimit optimized to do? Possible, so restart the service ok, so will all the service restarted again operating normally, and reports will show data soon, and then tell the technical support, the problem has been resolved, then went to deal with other case a;
The result is less than 20 minutes, technical support, said the report has no data, so he hit the tomcat log data acquisition applications look and found a bunch of exceptions, all a mistake:
This exception is very much to see the error message, the tomcat connector is happening Broken pipe at the time of the write operation exception, tomcat connector is processing network requests, is it a network problem, but why are abnormal occurrence write, read there is no problem? To judge is not a network problem, then use wget command to access a bit in a local interface server, and found such a long time are not responding, under normal circumstances, there should be immediate response, indicating that the cause is not the network, the server the question, then use the command to view the status of the current tcpip connection:

Connection CLOSE_WAIT states actually have 3853, which is not normal, indicating that the client to close the connection, the server did not close operations connected, causing the server has been maintained in a state CLOSE_WAIT of, if not the operating system keepalive do optimization, the default will remain in this state for two hours to see the set up of the system:

It really is 7200 seconds, which explains on why for the first time to see the last tomcat logs are being given "Too manay open files" abnormal, must be within two hours, close_wait state surge, resulting in more than 65,535 file descriptors the maximum limit;
And the state should be the broken pipe caused by abnormal, what is broken pipe caused by abnormal it? Why probe closed the connection, but the data acquisition server did not close the connection? Reported abnormal is the tomcat connector, tomcat not likely to forget to call the close method to close the connection, eliminating the problem of the program, could not think of what caused the;
So pick up a probe into the acquisition server uploading data log viewer, yet there are a large number of anomalies:
Read time out are abnormal, then the problem is clear, the probe end read timeout, and disconnected, but this time the data acquisition server is still processing the request, it does not know the end of the probe has been disconnected , after the request has been processed the process results to the probe, to a broken pipe;
So this anomaly is the client read timeout closed the connection, the server again this time the client has a broken connection occurs when abnormal write data broken pipe!
探针读超时的时间是2分钟,服务器为什么这么长的时间都没有响应呢?于是使用jstack命令导出了tomcat的线程栈信息进行分析,最后发现代码中有耗时的操作加了锁,导致线程阻塞(保密原因,在这里就不贴代码了);
这里总结一下,给我发私信的有些朋友没有get到Broken piple问题的重点,并不是只有超时才会导致这个问题,只要是连接断开,再往这个断开的连接上去执行写操作,都会出现这个异常,客户端超时断开只是其中的一种情况:
另外,当看到“Too manay open files”异常的时候,通常做法除了检查ulimit系统限制外,还应该看一下进程打开的文件句柄数,cat /proc/sys/fs/file-nr命令查看系统总句柄数,当前应用打开的文件句柄数使用ls -l /proc/<pid>/fd | wc -l命令,这里还好忽略了这一步,否则可能又要花费一些时间来查找系统真正的问题;
通过这个案例可知,排查问题时,在有些情况下,你第一眼看到的异常信息未必就是问题的根源所在,而是后续一些连锁反应,尤其是当大量出现同一个异常的情况下,不要看最后一条异常日志,应该先去日志里面查找第一出现该异常的位置,看看这个异常发生之前系统的状况