I. Introduction
In depth learning model training process, often requires real-time monitoring and visualization of some data, such as the loss of value of the loss, the correct rate and other acc. In Tensorflow, the most commonly used tools none other than non Tensorboard; in Pytorch, there are similar TensorboardX, but not as good as it is said in the efficiency visdom tensor data load. visdom FaceBook is the development of a visualization tool, and its essence is a page end web server, support for Pytorch better.
Second, the installation and start-up
visdom installation is relatively simple, you can use pip commands directly.
# Visdom installation instructions
pip install visdom
After the installation command, you can start visdom execute the following command.
# Start visdom web server
python -m visdom.server
If successfully installed, it will return a web page address; if the error, the installation fails, you can download the source code to install on their own github.

After you copy the URL opens in your browser, you can see visdom the main interface.
Third, simple to use
Loss values here to listen for data loss, and data accuracy acc aspect briefly visualized images of visdom used.
3.1 monitor a single data loss
In the model training process, data loss is the most common listening, here to listen for loss of, for example, using the process of change visdom of visual loss. To make the code more compact, in order for this loop process model instead of by trained round, Loss values are randomly generated within each cycle.
from visdom Import Visdom
 Import numpy AS NP
 Import Time

# window class instantiation
Viz = Visdom ()

# Create and initialize a window
viz.line ([0.], [0], = win ' train_loss ' , the opts = dict (title = ' train_loss ' ))

for global_steps in Range (10 ):
     # random value acquiring loss
    loss np.random.randn = 0.2 * () +. 1 # updated window image
    viz.line ([loss], [global_steps ], win = ' train_loss ' , = Update ' the append '
    )
    time.sleep(0.5)
3.2 while listening loss and acc
from visdom import Visdom
import numpy as np
import time

# 将窗口类实例化
viz = Visdom()

# 创建窗口并初始化
viz.line([[0.,0.]], [0], win='train', opts=dict(title='loss&acc', legend=['loss', 'acc']))
for global_steps in range(10):
    # 随机获取loss和acc
    loss = 0.1 * np.random.randn() + 1
    acc = 0.1 * np.random.randn() + 0.5
    # 更新窗口图像
    viz.line([[loss, acc]], [global_steps], win='train', update='append')
    # 延时0.5s
    time.sleep(0.5)
3.3 可视化图像
在处理图像任务时,还可以用visdom对图像进行可视化。
from visdom import Visdom
import numpy as np
import cv2
import torch

# 使用opencv读取数据
img = cv2.imread('pkq.jpg')
# opencv按照BGR读取,而visdom默认按照RGB显示,因此要进行通道转换
img = cv2.cvtColor(img, cv2.COLOR_BGR2RGB)
# visdom类似于pytorch中的卷积模型,接收的数据都要求通道数在前
img = np.transpose(img, (2, 0, 1))
img = torch.from_numpy(img)
# 可视化图像
viz.image(img, win='pkq')

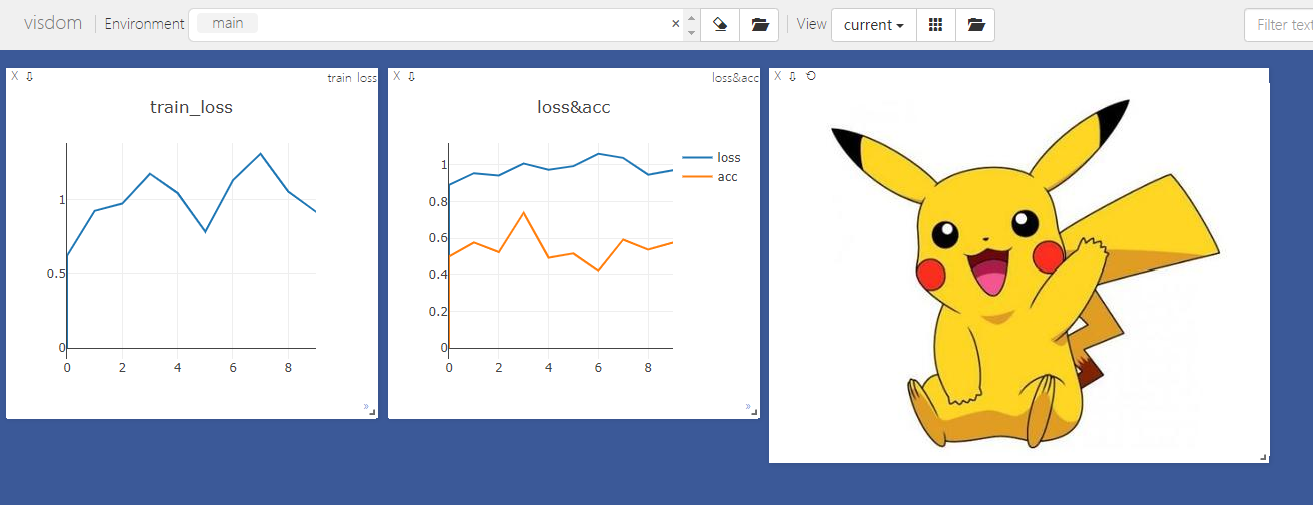
visdom可以同时在主面板中打开多个窗口,执行上面3个可视化程序后,主面板如下所示: