Fundamental
Kmeans is representative of unsupervised learning, there is no so-called Y. The main purpose of the classification, the distance between the classification is based on a sample. For example, to be divided into K classes. The steps are:
- K randomly selected points.
- Distances calculated for each point K to the centroid, into K clusters.
- K is calculated as the average of the new cluster samples centroid
- 2,3 cycle
- The same position, the distance is completed
distance
Kmeans basic principle is to calculate the distance. Generally, there are three distance options:
Euclidean distance
\[ d(x,u)=\sqrt{\sum_{i=1}^n(x_i-\mu_i)^2} \]
Manhattan distance
\[ d(x,u)=\sum_{i=1}^n(|x_i-\mu|) \]
Cosine distance
\[ cos\theta=\frac{\sum_{i=1}^n(x_i*\mu)}{\sqrt{\sum_i^n(x_i)^2}*\sqrt{\sum_1^n(\mu)^2}} \]
inertia
To its centroid within each cluster distance sum, called inertia. Adding each cluster inertia and smaller, i.e. more similar cluster. (K but the smaller the greater the inertia, the greater the pursuit k applications without benefits)
Code
Simulation data:
from sklearn.datasets import make_blobs
import matplotlib.pyplot as plt
X, y = make_blobs(n_samples=500, # 500个样本
                 n_features=2, # 每个样本2个特征
                 centers=4, # 4个中心
                 random_state=1 #控制随机性
                 )
Draw image:
color = ['red', 'pink','orange','gray']
fig, axi1=plt.subplots(1)
for i in range(4):
    axi1.scatter(X[y==i, 0], X[y==i,1],
               marker='o',
               s=8,
               c=color[i]
               )
plt.show()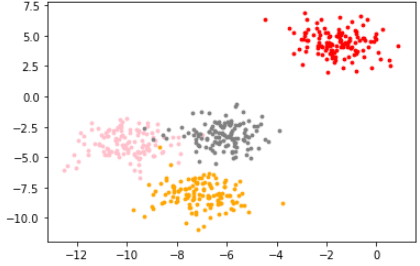
Use KMeans modeling classes:
from sklearn.cluster import KMeans
n_clusters=3
cluster = KMeans(n_clusters=n_clusters,random_state=0).fit(X)
Also can be the first fit, and then predict, but the data may not be accurate. When a large amount of data.
At this point you can view its properties: the center of mass, inertia.
centroid=cluster.cluster_centers_
centroid # 查看质心
View inertia:
inertia=cluster.inertia_
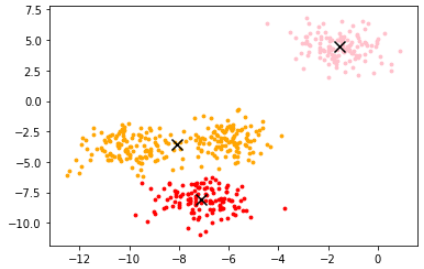
inertiaDraw location.
color=['red','pink','orange','gray']
fig, axi1=plt.subplots(1)
for i in range(n_clusters):
    axi1.scatter(X[y_pred==i, 0], X[y_pred==i, 1],
               marker='o',
               s=8,
               c=color[i])
axi1.scatter(centroid[:,0],centroid[:,1],marker='x',s=100,c='black')