
Author: Wuzhe
introduction
In the process of building modern data and business systems, observability has become crucial. Log Service (SLS) provides a large-scale, low-cost, and high-performance one-stop platform service for Log/Trace/Metric data. It also provides data collection, processing, delivery, analysis, alarm, visualization and other functions to comprehensively enhance the digital capabilities of enterprises in various scenarios such as R&D, operation and maintenance, operation and security.
Log data is naturally unstructured
Log data is one of the most basic data types in observable scenarios. Its biggest feature is that log data is naturally unstructured, which is related to a variety of factors:
- Diversity of sources: There are many types of log data, and it is difficult to have a unified schema for data from different sources.
- Data randomness: For example, abnormal event logs and user behavior logs are often naturally random and difficult to predict.
- Business complexity: Different participants have different understandings of data. For example, in the development process, it is usually developers who write logs, but it is often operations and data engineers who analyze logs. It is difficult to foresee specific analysis needs in the later period during the log writing process.

These factors lead to the fact that in many cases there may not be an ideal data model that can be used to pre-process log data. A more common approach is to directly store the original data, which can be called a Schema-on-Read approach. Or the so-called Sushi Principle: Raw data is better than cooked, since you can cook it in as many different ways as you like. This kind of "messy" raw log data also makes it more difficult for analysts, because it is often necessary to have certain prior knowledge of the data model in order to conduct better structured analysis of the data.
Inspired by Unix pipes: interactive probing
Before the emergence of various log analysis systems and platforms, the most traditional log analysis method for development and operation and maintenance personnel was to directly log in to the machine where the log file is located to grep the log, and use a series of Unix commands to analyze and process the log.
For example, if you want to check the source host of 404 in the access log, you may use this command:
grep 404 access.log | tail -n 10 | awk '{print $2}' | tr a-z A-Z
This command uses three pipe operators to connect four Unix command line tools (keyword search, log truncation, field extraction, case conversion) into a complete processing stack.
It is worth noting that when using such a command, we often do not write the complete command at once. Instead, we press Enter after writing a command, observe the execution output results, and then append through the pipeline. The next processing command continues to be executed, and so on.
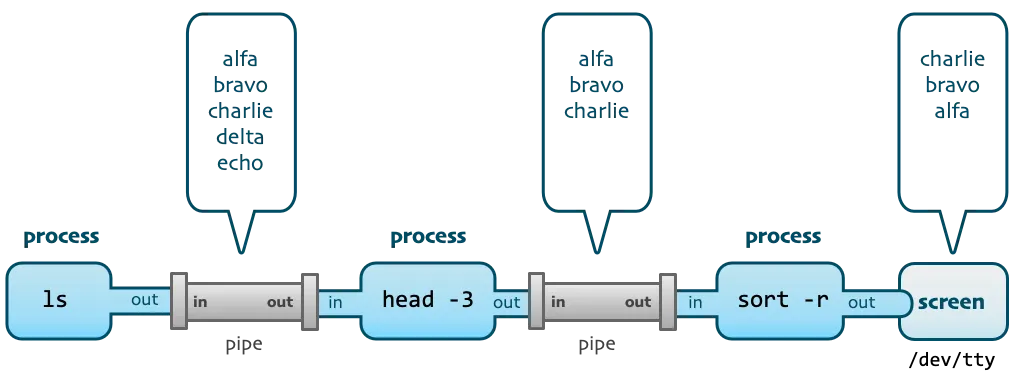
This process fully embodies the design philosophy of Unix, which combines small and beautiful tools into powerful programs through pipelines. At the same time, from the perspective of log analysis, we can get the following inspiration:
1) Interactive and progressive exploration, each execution is superimposed on the basis of the previous one.
2) During the exploration process, the full amount of data is often not processed, but a small portion of sample data is intercepted for analysis.
3) Various processing operations performed during the exploration process only affect the output of this query and do not change the original data.
It can be felt that this interactive exploration operation is a good way to explore log data. So on a cloud log platform like SLS, we expect to be able to use it when faced with massive amounts of raw log data. Similar to the Unix pipeline, when querying, the data is first explored and processed step by step through multi-level pipelines, which helps us dig out data patterns in messy and disordered logs, so that we can be more purposeful. To complete subsequent processing and cleaning, consumption and delivery, SQL aggregation analysis and other operations.
SPL-Unified processing syntax for logs
SPL (see SPL Overview [ 1] for details ), or SLS Processing Language, is a unified data processing syntax provided by SLS for scenarios that require data processing such as log query, streaming consumption, data processing, Logtail collection, and data Ingestion. This unity enables SPL to achieve the "Write Once, Run Anywhere" effect throughout the entire log processing life cycle.
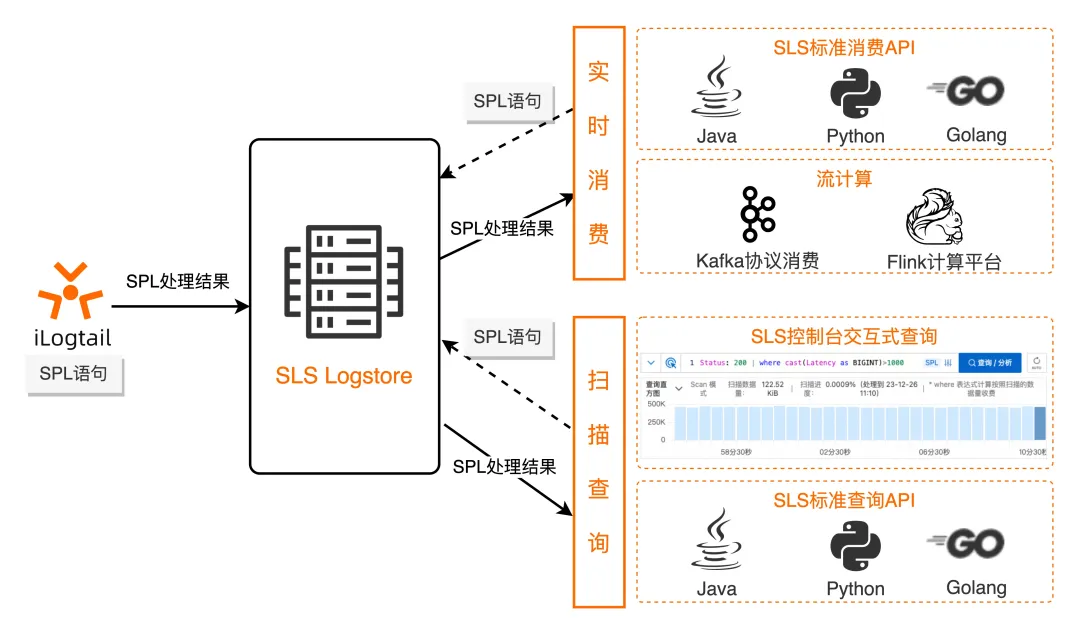
The basic syntax of SPL is as follows:
<data-source> | <spl-expr> ... | <spl-expr> ...
Where <data-source> is the data source. For log query scenarios, it refers to the index query statement.
< spl-expr > is an SPL instruction that supports regular value acquisition, field splitting, field projection, numerical calculation and other operations. For details, please refer to the introduction of SPL instructions [ 2] .
As can be seen from the syntax definition, SPL naturally supports multi-stage pipelines. For the log query scenario, after indexing the query statement, you can continuously append SPL instructions through the pipe character as needed. At each step, you can click the query to view the current processing results, thereby obtaining an experience similar to Unix pipeline processing. And compared with Unix instructions, SPL has richer operators and functions, allowing more flexible debugging and exploration analysis of logs.
Query logs using SPL
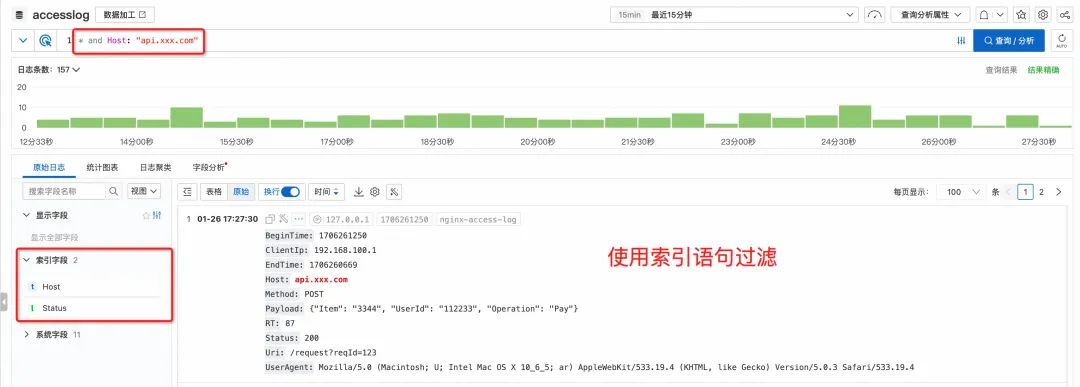
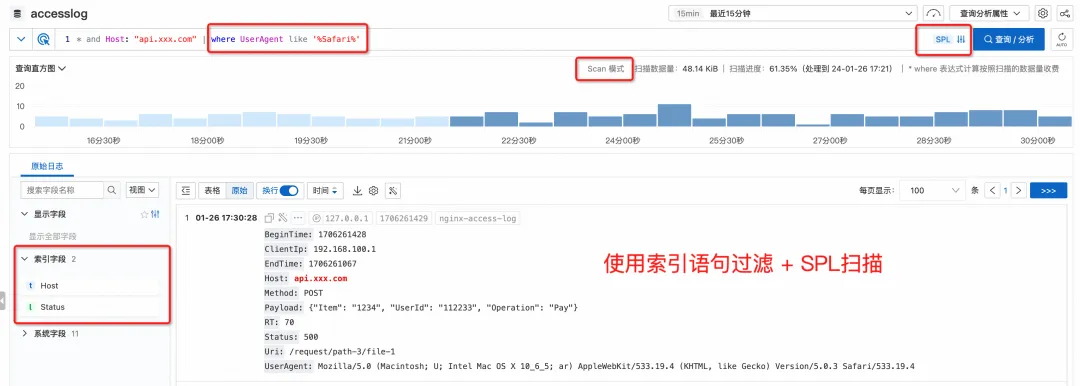
In the log query scenario, SPL works in scanning mode and can directly process unstructured raw data without being restricted by whether to create an index or the type of index. When scanning, billing is based on the actual amount of data scanned. For details, see Scanning Query Overview [ 3] .
Unified query interaction
Although scan queries and index queries have different working principles behind them, they are completely unified interactions in the user interface (console query, GetLogs API).
When querying the log, when entering the index query statement, it is queried through the index.
If you continue to enter the pipe character and SPL command, the index filtering results will be automatically processed according to the scan mode (no need to specify additionally through a "Scan Mode" button), and you will be prompted that you are currently in SPL input mode.
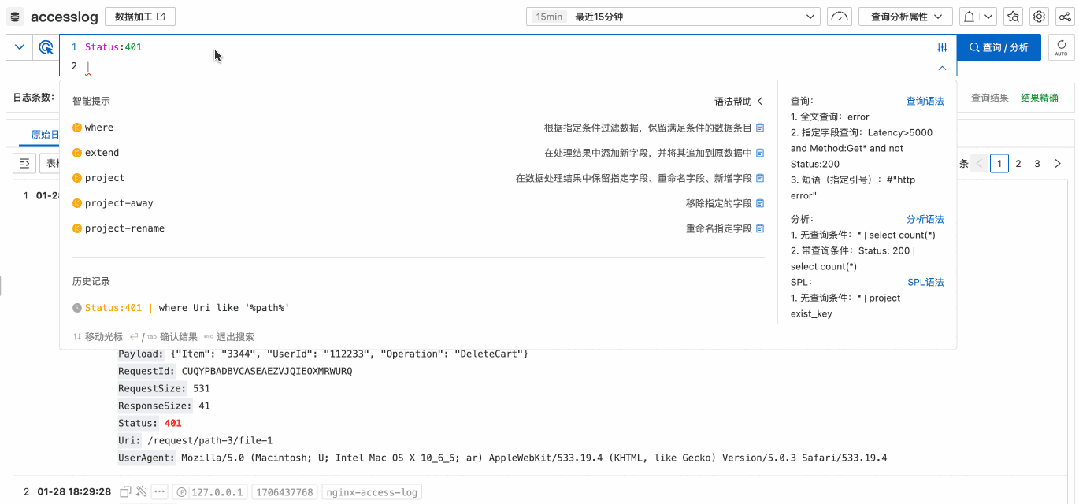
More friendly syntax tips
In addition, when querying on the console, it will automatically identify the current syntax mode and provide intelligent prompts for SPL related instructions and functions.
As you enter, the drop-down box automatically prompts the corresponding grammatical keywords and functions.
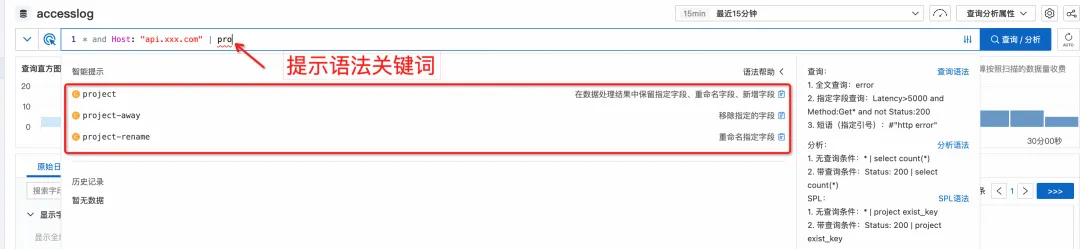
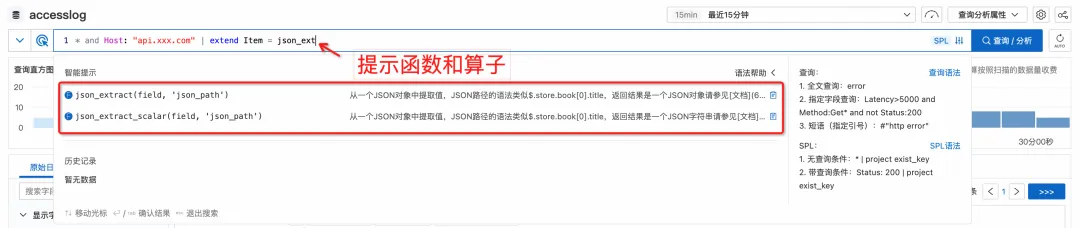
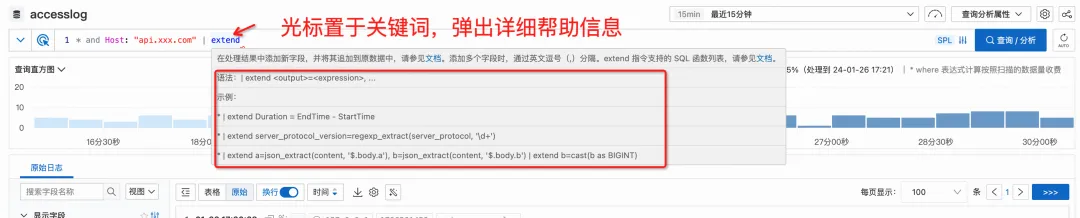
If you temporarily forget how to write a certain syntax, you don't have to leave the current interface to find the document again. Simply move the cursor over a keyword and detailed help information will pop up.
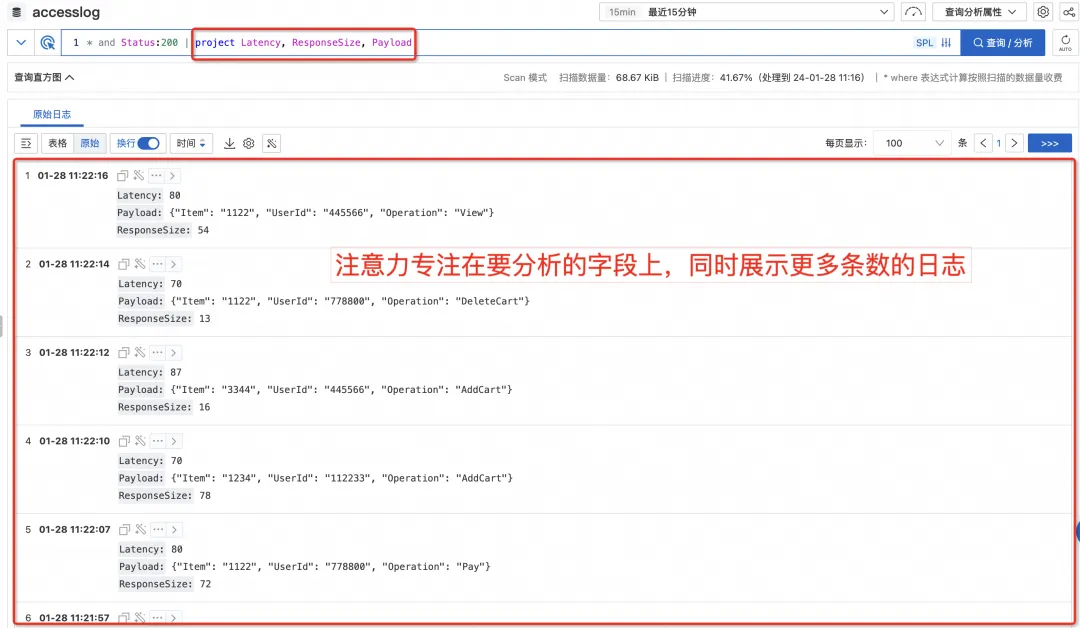
Filter fields for a more streamlined view
When logging, we generally try to put as much relevant information into the log as possible for future potential analysis needs, so we often find that there will be more fields in the final single log.
In this case, when querying the SLS console, one log takes up too much space. Even if the top bar chart and the side quick analysis bar are folded, only one or two logs can be seen at the same time in the original log area. logs, you have to scroll the mouse to turn pages to see other logs, which is more inconvenient to use.

However, in fact, when we query logs, we often search with a certain purpose. At this time, we usually only care about some of the fields. At this time, you can use the project command in SPL to keep only the fields you care about (or use the project-away command to remove fields you do not need to see. This not only removes interference, but also focuses your attention on the current fields you want to focus on. fields, and because the fields are streamlined, more logs can be previewed at the same time.)
New fields are calculated in real time
As mentioned earlier, since the analysis needs cannot be completely foreseen when writing logs, when analyzing logs, it is often necessary to process existing fields and extract new fields. This can be achieved through the Extend command of SPL.
Using the Extend directive, you can call a rich set of functions (most of which are common to SQL syntax) for scalar processing.
Status:200 | extend urlParam=split_part(Uri, '/', 3)
At the same time, new fields can also be calculated based on multiple fields, such as calculating the difference between two numeric fields. (Note that fields are treated as varchar by default. When performing numerical type calculations, you must first convert the type through cast)
Status:200 | extend timeRange = cast(BeginTime as bigint) - cast(EndTime as bigint
Flexible multi-dimensional filtering
Index queries can only be based on search methods such as keywords, phrases composed of multiple keywords, and fuzzy keywords at the end. In scan mode, you can filter according to various conditions through where quality. This is the capability that current scan queries already have. , after upgrading to SPL, where can be placed in any level of pipeline to filter the calculated new fields, thus having more flexible and powerful filtering capabilities.
For example, after calculating TimeRange based on BeginTime and EndTime, you can then judge and filter the calculated value.
Status:200
| where UserAgent like '%Chrome%'
| extend timeRange = cast(BeginTime as bigint) - cast(EndTime as bigint)
| where timeRange > 86400
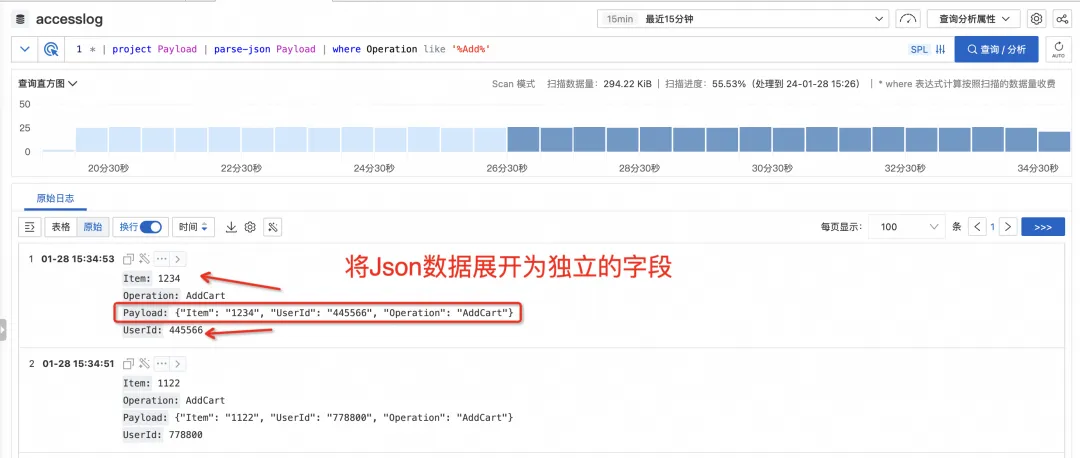
Freely expand semi-structured data
Sometimes in our logs, a certain field itself is semi-structured data such as json or csv. We can use the extend command to extract one of the subfields. However, if there are many subfields to be analyzed, it will It is necessary to write a large number of field extraction functions such as json_extract_scalar or regexp_extract, which is more inconvenient.
SPL provides instructions such as parse-json and parse-csv, which can directly fully expand json and csv type fields into independent fields, and then directly operate on these fields. It saves the cost of writing field extraction functions, which is more convenient in interactive query scenarios.
An immersive exploration experience where everything you think is what you see
Let us experience it through another animated picture. In the process of exploring the log, with the continuous input of SPL instructions through the pipeline, the data is processed step by step. At each step, the processing steps in the mind can be processed. Materialized on the query result page view, what you think is what you see, and what you see is what you get. In the step-by-step interactive exploration, we finally extract the structured information we need to analyze.
Summarize
Due to the diversity of data sources and the uncertainty of analysis requirements, log data is often directly stored as unstructured raw data, which brings certain challenges to query analysis.
SLS launches the unified log processing language SPL. In the log query scenario, data can be interactively and progressively explored through multi-level pipelines, so as to more conveniently discover data characteristics and better conduct subsequent structured analysis and Processing and consumption processes.
Currently, the function of querying support for SPL has been launched in various regions, and everyone is welcome to use it. If you have any questions or needs, you can give us feedback through work orders and support groups. SLS will continue to work hard to create an observable analysis platform that is easier to use, more stable, and more powerful.
Related Links:
[1] SPL Overview
https://help.aliyun.com/zh/sls/user-guide/spl-overview
[2] Introduction to SPL instructions
https://help.aliyun.com/zh/sls/user-guide/spl-instruction?spm=a2c4g.11186623.0.0.197c59d4pRrjml
[3] Scan query overview
https://help.aliyun.com/zh/sls/user-guide/scan-based-query-overview
Reference links:
[1] The Sushi Principle
https://www.datasapiens.co.uk/blog/the-sushi-principle
[2] Unix Commands, Pipes, and Processes
https://itnext.io/unix-commands-pipes-and-processes-6e22a5fbf749
[3] SPL Overview
https://help.aliyun.com/zh/sls/user-guide/spl-overview
[4] Scan query overview
https://help.aliyun.com/zh/sls/user-guide/scan-based-query-overview
[5] SLS architecture upgrade - lower cost, higher performance, more stable and easy to use
Linus took it upon himself to prevent kernel developers from replacing tabs with spaces. His father is one of the few leaders who can write code, his second son is the director of the open source technology department, and his youngest son is an open source core contributor. Robin Li: Natural language will become a new universal programming language. The open source model will fall further and further behind Huawei: It will take 1 year to fully migrate 5,000 commonly used mobile applications to Hongmeng. Java is the language most prone to third-party vulnerabilities. Rich text editor Quill 2.0 has been released with features, reliability and developers. The experience has been greatly improved. Ma Huateng and Zhou Hongyi shook hands to "eliminate grudges." Meta Llama 3 is officially released. Although the open source of Laoxiangji is not the code, the reasons behind it are very heart-warming. Google announced a large-scale restructuring