Article directory
pyecharts official documentation:
https://pyecharts.org/#/zh-cn/intro
pyecharts official documentation
Note! The following is rendered in jupyter notebook, not pycharm
Be sure to read the official documents carefully!!!
Be sure to read the official documents carefully!!!
Be sure to read the official documents carefully!!!
Common chart types in pyecharts
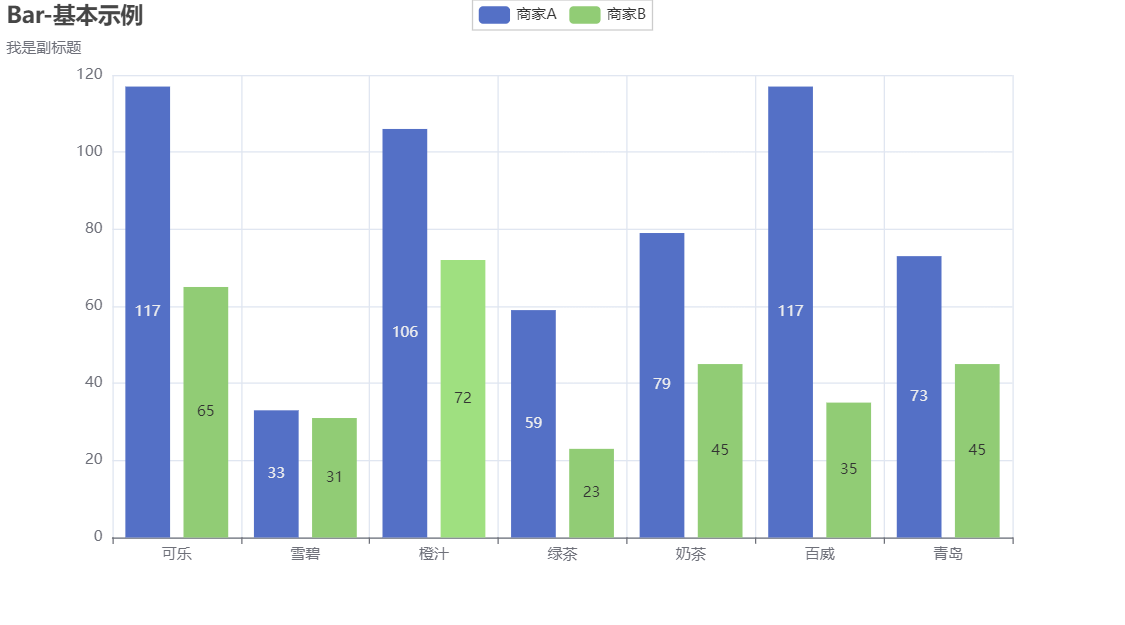
1. Bar chart
from pyecharts import options as opts
from pyecharts.charts import Bar
from pyecharts.faker import Faker

c=(
    Bar()
    .add_xaxis(Faker.choose())
    .add_yaxis("商家A",Faker.values())
    .add_yaxis("商家B",Faker.values())

    # 全局配置项
    .set_global_opts(title_opts=opts.TitleOpts(title="Bar-基本示例", subtitle="我是副标题"))
)

c.render_notebook()
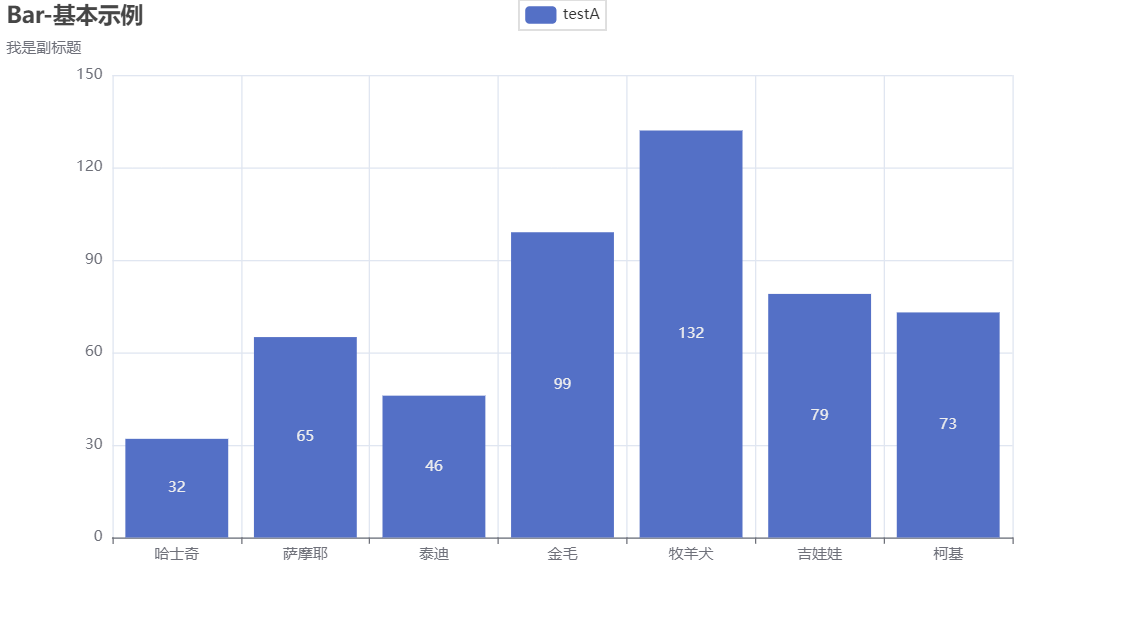
import pandas as pd

s= pd.Series(data=[32,65,46,99,132,79,73],
             index=['哈士奇','萨摩耶','泰迪','金毛','牧羊犬','吉娃娃','柯基']
            )
s
"""
哈士奇     32
萨摩耶     65
泰迪      46
金毛      99
牧羊犬    132
吉娃娃     79
柯基      73
dtype: int64
"""
from pyecharts import options as opts
from pyecharts.charts import Bar

"""
默认情况下, pyecharts对pandas数据结构是不能识别的

需要使用 tolist() 将数据转化成列表
"""

c=(
    Bar()
    .add_xaxis(s.index.tolist())
    .add_yaxis("testA",s.values.tolist())

    # 全局配置项
    .set_global_opts(title_opts=opts.TitleOpts(title="Bar-基本示例", subtitle="我是副标题"))
)

c.render_notebook()
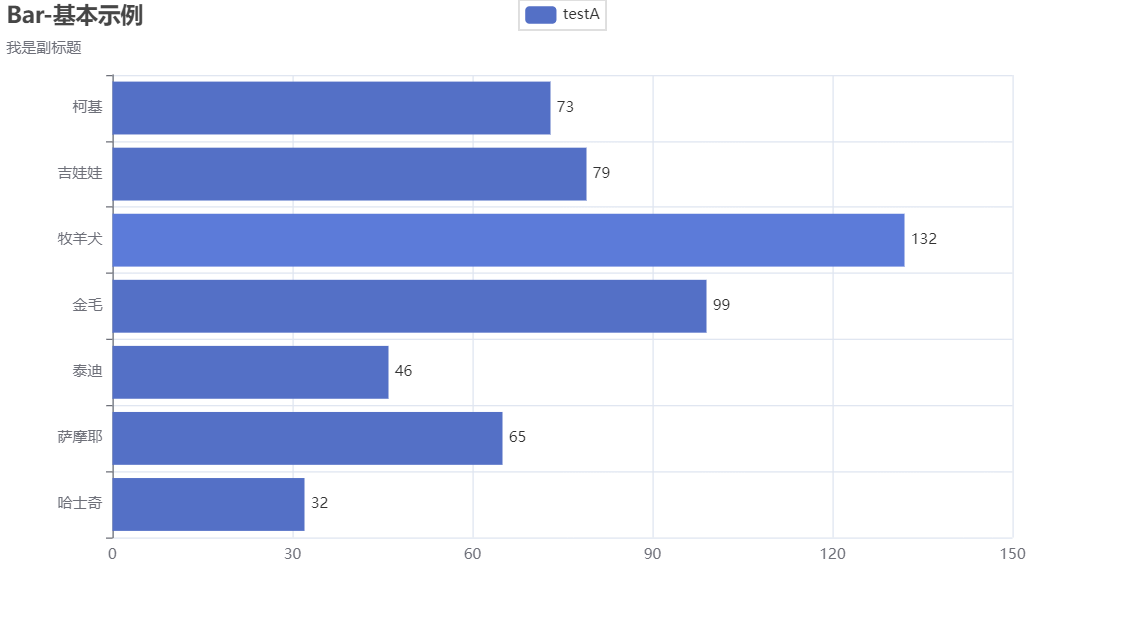
2 Horizontal bar chart
from pyecharts import options as opts
from pyecharts.charts import Bar


def bar_pic():
    c = (
        Bar()
        .add_xaxis(s.index.tolist())  # 添加X轴
        .add_yaxis("testA", s.values.tolist()).reversal_axis()  # 翻转XY轴

        # 全局配置项
        .set_global_opts(
            title_opts=opts.TitleOpts(title="Bar-基本示例", subtitle="我是副标题"))

        # 系列配置项
        .set_series_opts(
            label_opts=opts.LabelOpts(position='right'))   # s.values的数据显示位置

    )
    return c


# c.render_notebook()

bar_pic().render_notebook()
3 Line chart
import pyecharts.options as opts
from pyecharts.charts import Line
from pyecharts.faker import Faker


x = ['2022-{:0>2d}'.format(s) for s in range(1, 13)]  # 增加
y1 = [5, 10, 26, 30, 35, 30, 20, 26, 40, 46, 40, 50]  # 增加
y2 = [8, 20, 24, 36, 40, 36, 40, 45, 50, 53, 48, 58]  # 增加

c = (
    Line()
    .add_xaxis(x)
    .add_yaxis("商家A", y1, is_smooth=False)  # 折线
    .add_yaxis("商家B", y2, is_smooth=True)  # 平滑
    .set_global_opts(
        title_opts=opts.TitleOpts(title="Line-smooth"),
        # 坐标轴配置项
        xaxis_opts=opts.AxisOpts(
            axislabel_opts=opts.LabelOpts(
                rotate=-45  #旋转
            )
        )

    )
)
c.render_notebook()

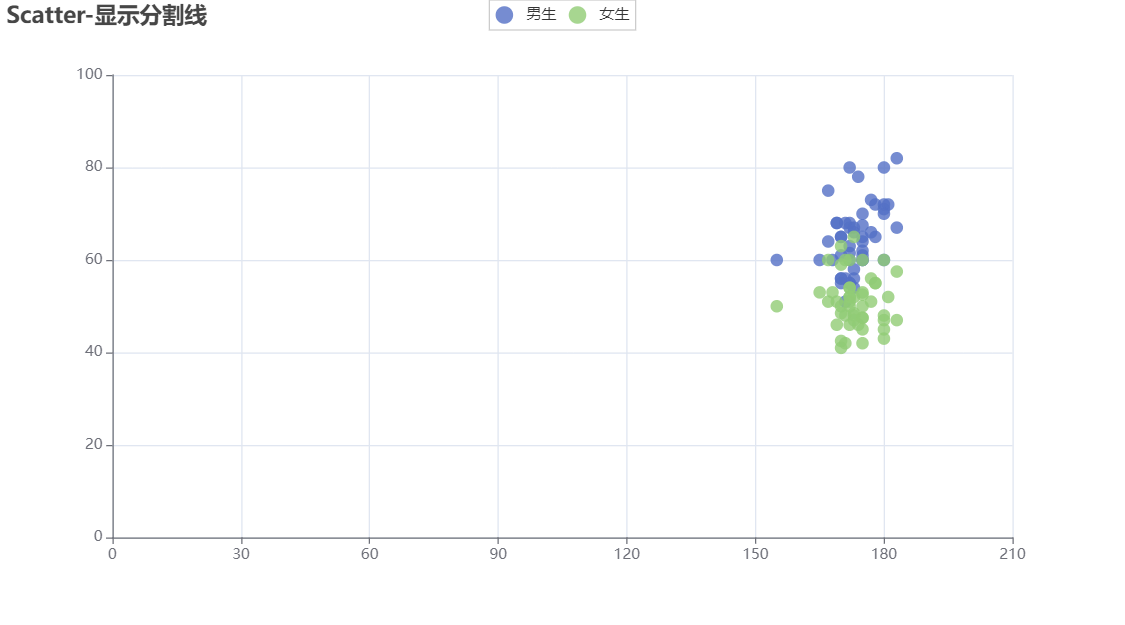
4 Scatter plot
Import a local Excel file here
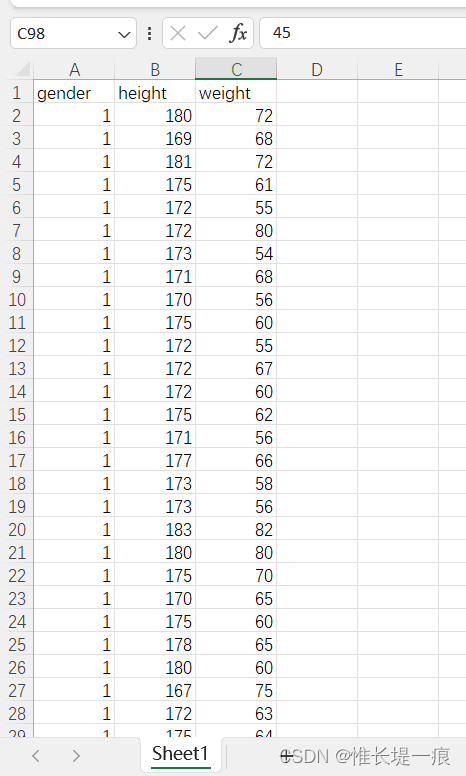
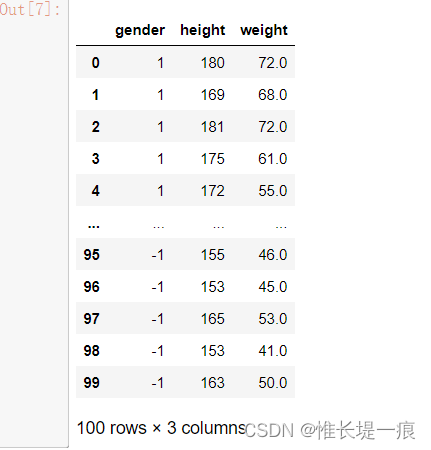
df=pd.read_excel('./data/testdata.xlsx')

df
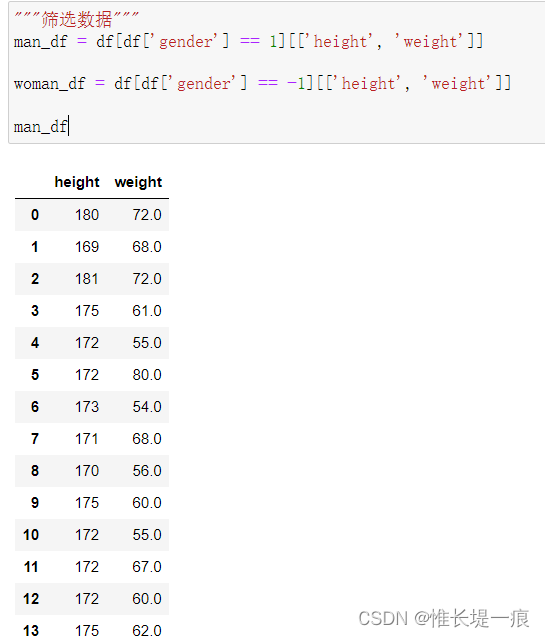
"""筛选数据"""
man_df = df[df['gender'] == 1][['height', 'weight']]

woman_df = df[df['gender'] == -1][['height', 'weight']]

man_df
man_df['height'].values
"""
array([180, 169, 181, 175, 172, 172, 173, 171, 170, 175, 172, 172, 172,
       175, 171, 177, 173, 173, 183, 180, 175, 170, 175, 178, 180, 167,
       172, 175, 180, 177, 173, 180, 173, 175, 170, 178, 171, 174, 170,
       169, 165, 167, 172, 170, 183, 172, 175, 168, 170, 155], dtype=int64)
"""
from pyecharts import options as opts
from pyecharts.charts import Scatter  # 散点图对象
from pyecharts.faker import Faker


c = (
    Scatter()
    .add_xaxis(man_df['height'])  # 对于x轴, 数值类型的数据直接传Series
    # .add_xaxis(list(range(0, 200)))
    .add_yaxis("男生", man_df['weight'].tolist(), label_opts=opts.LabelOpts(is_show=False))
    .add_yaxis("女生", woman_df['weight'].tolist(), label_opts=opts.LabelOpts(is_show=False))


    .set_global_opts(
        title_opts=opts.TitleOpts(title="Scatter-显示分割线"),
        xaxis_opts=opts.AxisOpts(splitline_opts=opts.SplitLineOpts(is_show=True)),
        yaxis_opts=opts.AxisOpts(splitline_opts=opts.SplitLineOpts(is_show=True)),
    )
)
c.render_notebook()
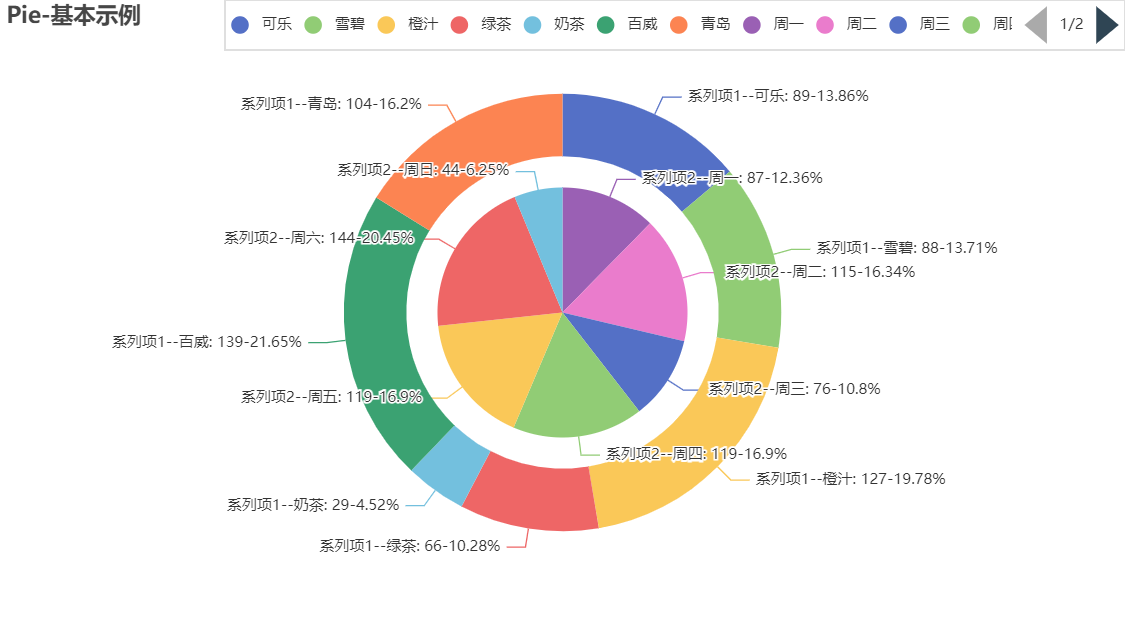
5 pie chart
from pyecharts import options as opts
from pyecharts.charts import Pie
from pyecharts.faker import Faker

c = (
    Pie()
    .add("系列项1", [list(z) for z in zip(Faker.choose(), Faker.values())],
         # radius如果给的是一个字符串, 设置饼图的半径,  如果传列表, 第一项是内半径, 第二项是外半径
        radius=['50%', '70%'],
        )

    .add("系列项2", [list(z) for z in zip(Faker.choose(), Faker.values())],
         # radius如果给的是一个字符串, 设置饼图的半径,  如果传列表, 第一项是内半径, 第二项是外半径
        radius='40%',
        )


    .set_global_opts(
        title_opts=opts.TitleOpts(title="Pie-基本示例"),
        legend_opts=opts.LegendOpts(
            type_='scroll',
            pos_left='20%',
            legend_icon='circle', #图例样式
#             orient='virtical',
            page_icon_size=30
        )
    )
    .set_series_opts(
        # 标签格式化器   {a}(系列名称),{b}(数据项名称),{c}(数值), {d}(百分比)
        label_opts=opts.LabelOpts(formatter="{a}--{b}: {c}-{d}%")
    )
)
c.render_notebook()
[list(z) for z in zip(Faker.choose(), Faker.values())]
"""
[['周一', 86],
 ['周二', 140],
 ['周三', 132],
 ['周四', 122],
 ['周五', 56],
 ['周六', 86],
 ['周日', 124]]
"""
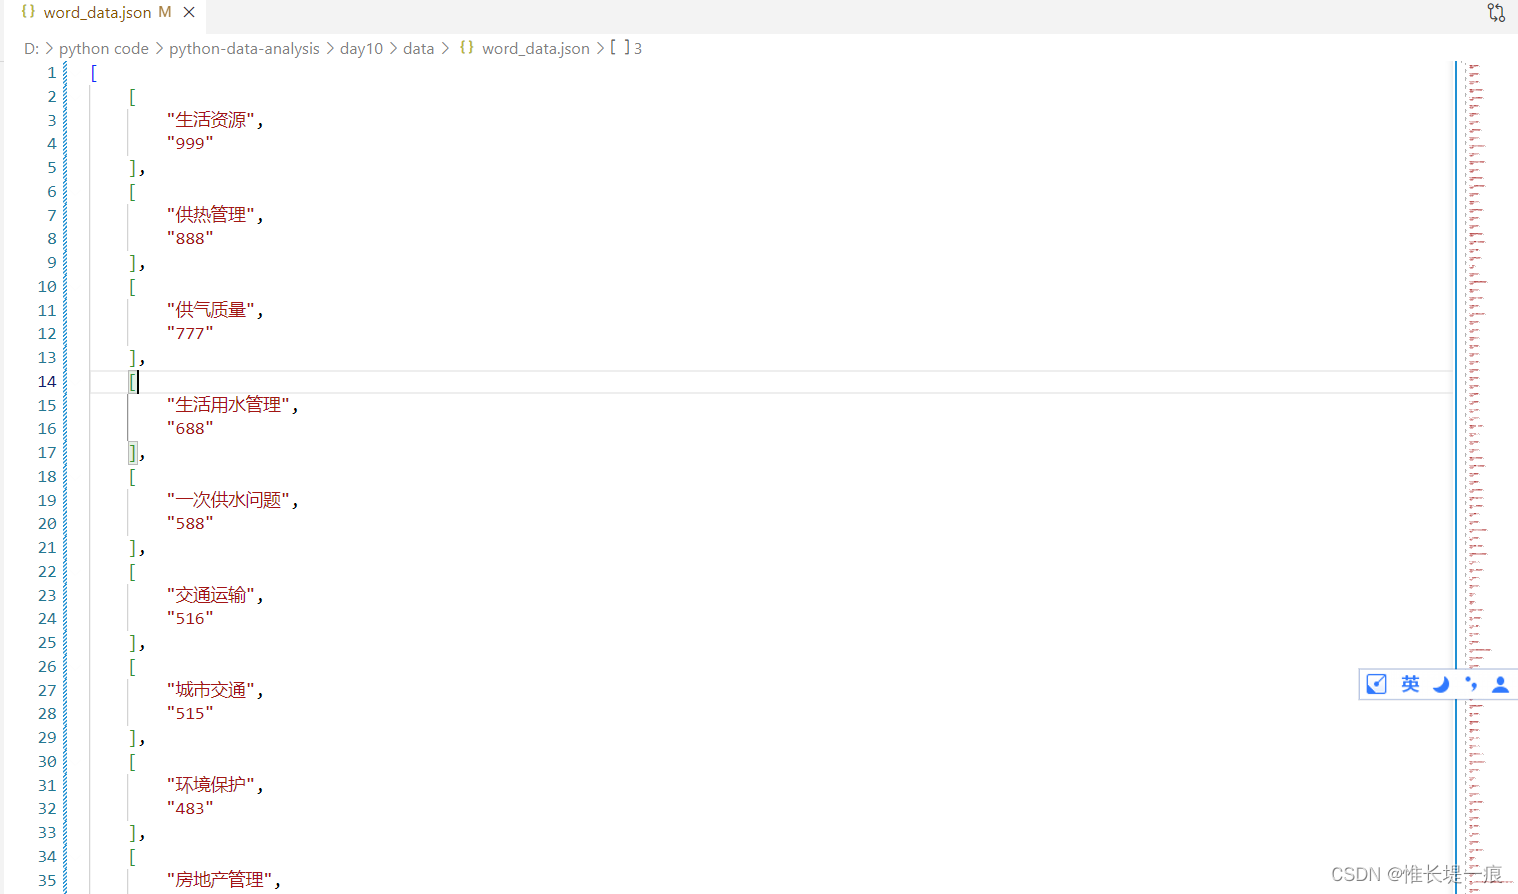
6 word cloud diagram
Local json file to generate a word cloud diagram
from pyecharts import options as opts
from pyecharts.charts import WordCloud
import json
# 本地的文件
data = json.loads(open('./data/word_data.json', encoding='utf-8').read())

c = (
    WordCloud()
    .add(
        "",
        data,
        shape='cardioid',
        word_size_range=[20, 100],
        textstyle_opts=opts.TextStyleOpts(font_family="cursive"),
    )
    .set_global_opts(title_opts=opts.TitleOpts(title="WordCloud-自定义文字样式"))
)


c.render_notebook()

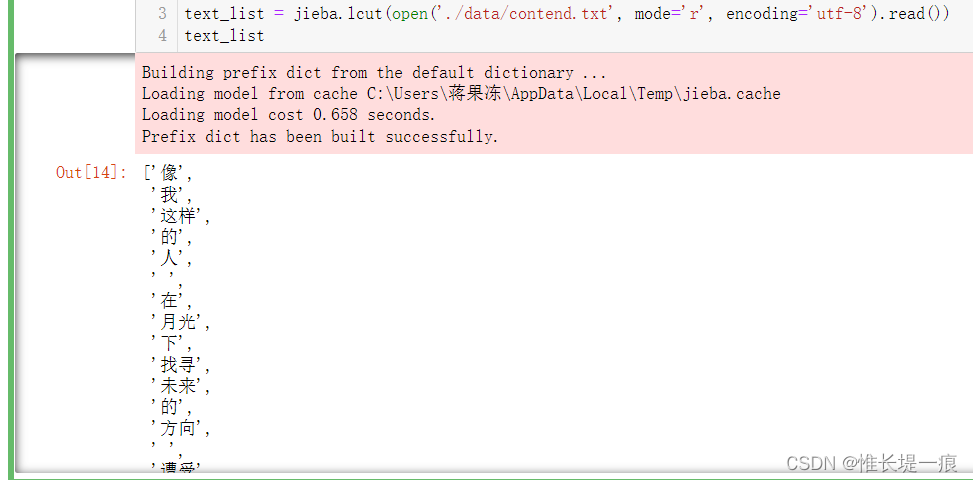
Use jieba to count the number of times a word appears and draw a word cloud diagram according to a certain shape

# 在终端安装第三方中文分词库
pip install jieba
import jieba

text_list = jieba.lcut(open('./data/contend.txt', mode='r', encoding='utf-8').read())
text_list
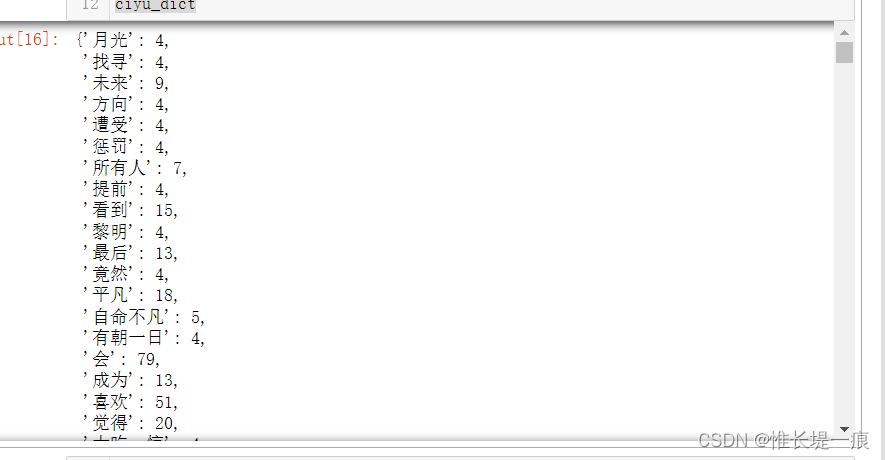
"""统计词语出现的次数"""
ciyu_dict = {

    }
for text in text_list:
    if text not in ciyu_dict.keys():
        ciyu_dict[text] = 1
    else:
        ciyu_dict[text] += 1

ciyu_dict
\nThere are useless words in the output , and there are also
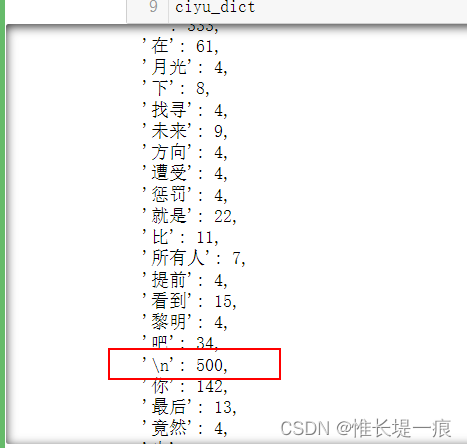
words that have no reference value and need to be deleted.
"""去除无用词语, 指的是没有情感取向的词语"""
not_use = open('./data/cn_stopwords.txt', mode='r', encoding='utf-8').readlines()
not_use = [txt.strip() for txt in not_use]

keys = list(ciyu_dict.keys())
for key in keys:
    if key in not_use:
        del ciyu_dict[key]

del ciyu_dict[' ']  # 删除空格
del ciyu_dict['\n']  # 删除\n
ciyu_dict
"""指定形状绘制词云图"""
c = (
    WordCloud()
    .add(
        "文章",
        data_pair=list(ciyu_dict.items()),
        word_size_range=[6, 66],  # 字体大小范围
        textstyle_opts=opts.TextStyleOpts(font_family="cursive"),
        mask_image='./data/music.png'  # 指定图片形状
    )
    .set_global_opts(title_opts=opts.TitleOpts(title="WordCloud-自定义文字样式"))
)


c.render_notebook()


7 Geo
from pyecharts import options as opts
from pyecharts.charts import Geo
from pyecharts.faker import Faker

c = (
    Geo()
    .add_schema(maptype="china")  # 中国地图
    .add("geo", [list(z) for z in zip(Faker.provinces, Faker.values())])
    .set_series_opts(label_opts=opts.LabelOpts())
    .set_global_opts(
        visualmap_opts=opts.VisualMapOpts(is_piecewise=True),  # 是否分段
        title_opts=opts.TitleOpts(title="Geo-VisualMap(分段型)"),
    )
)
c.render_notebook()

8 Map
from pyecharts import options as opts
from pyecharts.charts import Map
from pyecharts.faker import Faker

c = (
    Map()
    .add("商家A", [list(z) for z in zip(Faker.provinces, Faker.values())], "china")
    .set_series_opts(label_opts=opts.LabelOpts())
    .set_global_opts(title_opts=opts.TitleOpts(title="Map-基本示例"))
)
c.render_notebook()
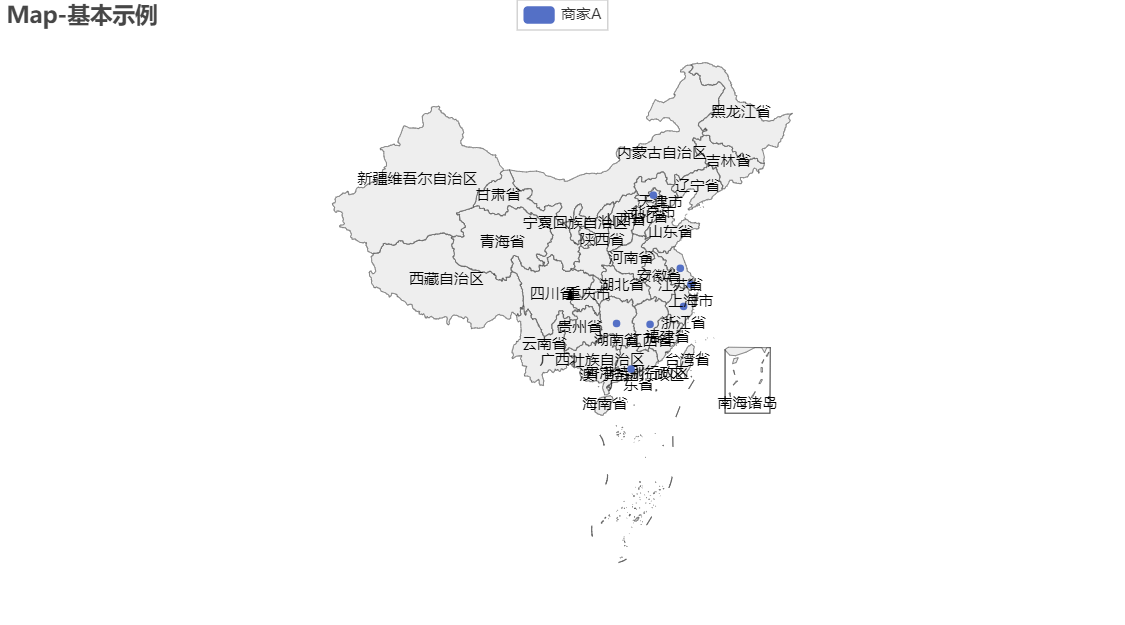
[list(z) for z in zip(Faker.provinces, Faker.values())]

"""
[['广东省', 61],
 ['北京市', 113],
 ['上海市', 73],
 ['江西省', 50],
 ['湖南省', 143],
 ['浙江省', 96],
 ['江苏省', 50]]
"""
9 Distribution method
9.1 Stacking multiple images
from pyecharts import options as opts
from pyecharts.charts import Bar, Line
from pyecharts.faker import Faker

v1 = [2.0, 4.9, 7.0, 23.2, 25.6, 76.7, 135.6, 162.2, 32.6, 20.0, 6.4, 3.3]
v2 = [2.6, 5.9, 9.0, 26.4, 28.7, 70.7, 175.6, 182.2, 48.7, 18.8, 6.0, 2.3]
v3 = [2.0, 2.2, 3.3, 4.5, 6.3, 10.2, 20.3, 23.4, 23.0, 16.5, 12.0, 6.2]

# 绘制的柱状图
bar = (
    Bar()
    .add_xaxis(Faker.months)
    .add_yaxis("蒸发量", v1)
    .add_yaxis("降水量", v2)
    .extend_axis(
    	#设置y轴属性,设置了y轴的标签格式为"{value} °C",并且y轴的刻度间隔为5。
        yaxis=opts.AxisOpts(
            axislabel_opts=opts.LabelOpts(formatter="{value} °C"), interval=5
        )
    )
    .set_series_opts(label_opts=opts.LabelOpts(is_show=False))
    .set_global_opts(
        title_opts=opts.TitleOpts(title="Overlap-bar+line"),
        #设置y轴属性,设置了y轴的标签格式为"{value} ml"
        yaxis_opts=opts.AxisOpts(axislabel_opts=opts.LabelOpts(formatter="{value} ml"))
    )
)

# 绘制折线图
# yaxis_index 值需要设置为1 , 因为层叠多图需要新增轴
line = Line().add_xaxis(Faker.months).add_yaxis("平均温度", v3, yaxis_index=1)
bar.overlap(line)   # 在柱状图的基础上绘制折线图

bar.render_notebook()
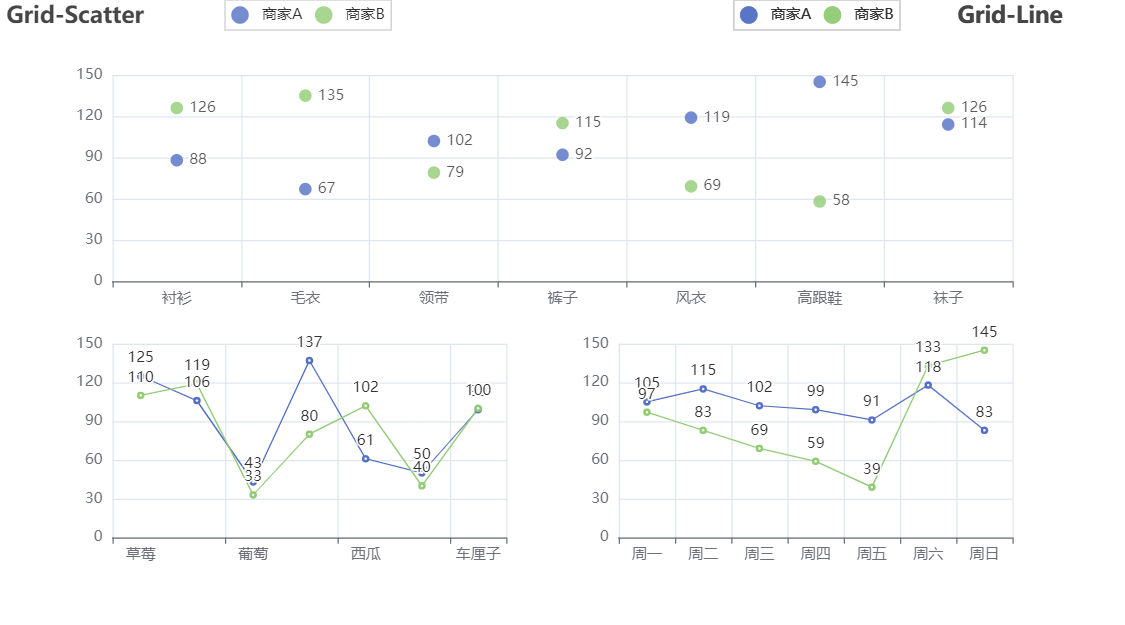
9.2 Parallel multiple graphs
from pyecharts import options as opts
from pyecharts.charts import Line, Scatter, Grid  # Grid 并行多图对象
from pyecharts.faker import Faker

scatter = Scatter()
scatter.add_xaxis(Faker.choose())
scatter.add_yaxis("商家A", Faker.values())
scatter.add_yaxis("商家B", Faker.values())
scatter.set_global_opts(
    title_opts=opts.TitleOpts(title="Grid-Scatter"),
    legend_opts=opts.LegendOpts(pos_left="20%"),
)

line = Line()
line.add_xaxis(Faker.choose())
line.add_yaxis("商家A", Faker.values())
line.add_yaxis("商家B", Faker.values())
line.set_global_opts(
    title_opts=opts.TitleOpts(title="Grid-Line", pos_right="5%"),
    legend_opts=opts.LegendOpts(pos_right="20%"),
)
line2 = Line()
line2.add_xaxis(Faker.choose())
line2.add_yaxis("商家A", Faker.values())
line2.add_yaxis("商家B", Faker.values())
line2.set_global_opts(
    title_opts=opts.TitleOpts(title="Grid-Line", pos_right="5%"),
    legend_opts=opts.LegendOpts(pos_right="20%"),
)

grid = Grid()
grid.add(scatter, grid_opts=opts.GridOpts(pos_bottom='55%'))
grid.add(line, grid_opts=opts.GridOpts(pos_top='55%', pos_left='55%'))
grid.add(line2, grid_opts=opts.GridOpts(pos_top='55%', pos_right='55%'))

grid.render_notebook()
9.3 Sequential multiple graphs
from pyecharts import options as opts
from pyecharts.charts import Bar, Geo, Page  # 导入顺序多图功能
from pyecharts.faker import Faker

bar = (
    Bar()
    .add_xaxis(Faker.choose())
    .add_yaxis("商家A", Faker.values())
    .add_yaxis("商家B", Faker.values())
    .set_global_opts(legend_opts=opts.LegendOpts(pos_left="20%"))
)

geo = (
    Geo()
    .add_schema(maptype="china")
    .add("geo", [list(z) for z in zip(Faker.provinces, Faker.values())])
    .set_series_opts(label_opts=opts.LabelOpts(is_show=False))
    .set_global_opts(
        visualmap_opts=opts.VisualMapOpts(),
        title_opts=opts.TitleOpts(title="Grid-Geo-Bar"),
    )
)

page = Page()
page.add(bar)
page.add(geo)

page.render_notebook()

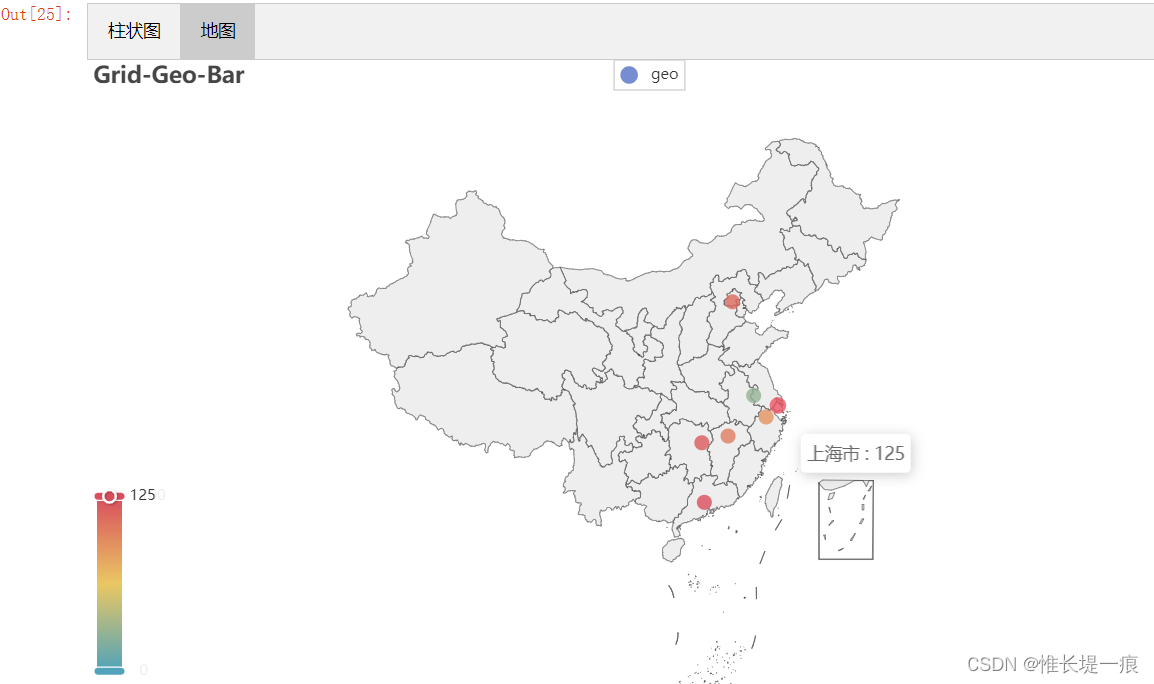
from pyecharts import options as opts
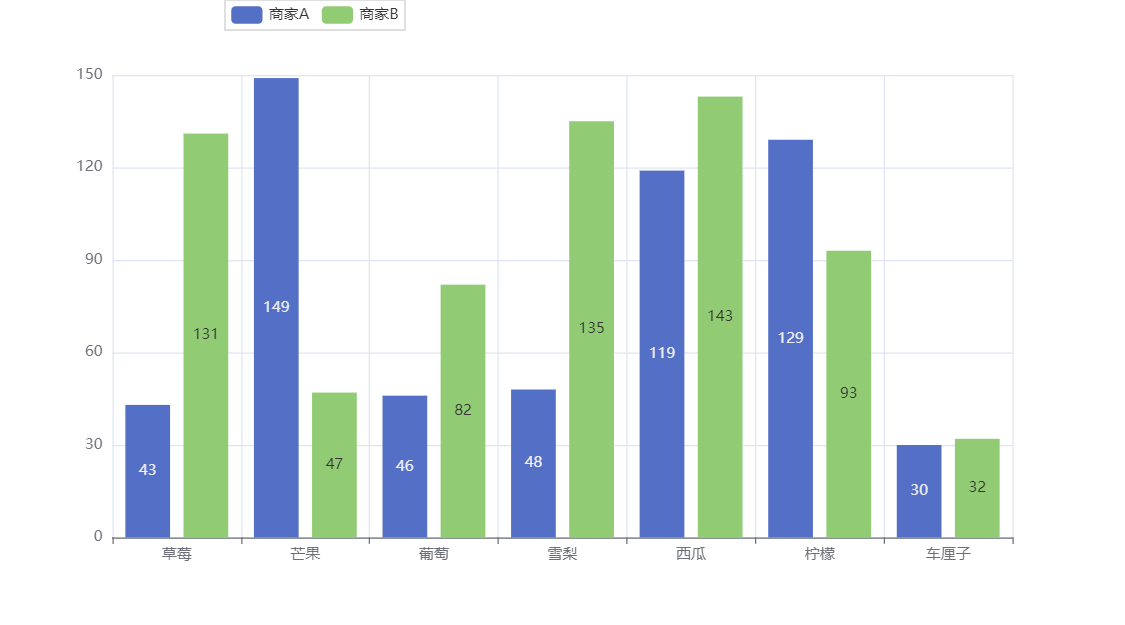
from pyecharts.charts import Bar, Geo, Tab # 导入选项卡多图功能
from pyecharts.faker import Faker
bar = (
Bar()
.add_xaxis(Faker.choose())
.add_yaxis("商家A", Faker.values())
.add_yaxis("商家B", Faker.values())
.set_global_opts(legend_opts=opts.LegendOpts(pos_left="20%"))
)
geo = (
Geo()
.add_schema(maptype="china")
.add("geo", [list(z) for z in zip(Faker.provinces, Faker.values())])
.set_series_opts(label_opts=opts.LabelOpts(is_show=False))
.set_global_opts(
visualmap_opts=opts.VisualMapOpts(),
title_opts=opts.TitleOpts(title="Grid-Geo-Bar"),
)
)
tab = Tab()
tab.add(bar, '柱状图')
tab.add(geo, '地图')
tab.render_notebook()
Click on "Histogram" or "Map" to switch

9.4 Timeline carousel chart
from pyecharts import options as opts
from pyecharts.charts import Bar, Timeline  # 时间线轮播功能
from pyecharts.faker import Faker

x = Faker.choose()  # 随机获取坐标轴数据

tl = Timeline()  # 创建一个时间线轮播组件

for i in range(2015, 2020):
    bar = Bar()
    bar.add_xaxis(x)
    y_a = Faker.values()
    y_b = Faker.values()
    bar.add_yaxis("商家A", y_a)
    bar.add_yaxis("商家B", y_b)
    bar.set_global_opts(title_opts=opts.TitleOpts("某商店{}年营业额".format(i)))
    tl.add(bar, "{}年".format(i))

tl.render_notebook()