1. Data preparation
#Data preparation
data("ToothGrowth")
ToothGrowth$dose = factor(ToothGrowth$dose)
head(ToothGrowth)

Use the database that comes with R for testing. The data includes len, supp, and dose, where len is used as the specific value y, and the other two groups are used as factor data for analysis and graphing.
2. Basic grammar
1. Single set of data
library(ggplot2)
p = ggplot(ToothGrowth, aes(x = dose, y = len))
p + geom_boxplot() #图1
2. Multiple sets of data
Use supp as the grouping basis. supp includes OJ and VC.
p + geom_boxplot(aes(fill = supp), position = position_dodge(1))#图2


3. Basic advancement
The following changes are all based on Figure 1 (single set of data) . The same applies to changes in multiple sets of data.
1. Exchange of horizontal and vertical coordinates
p + geom_boxplot() + coord_flip()
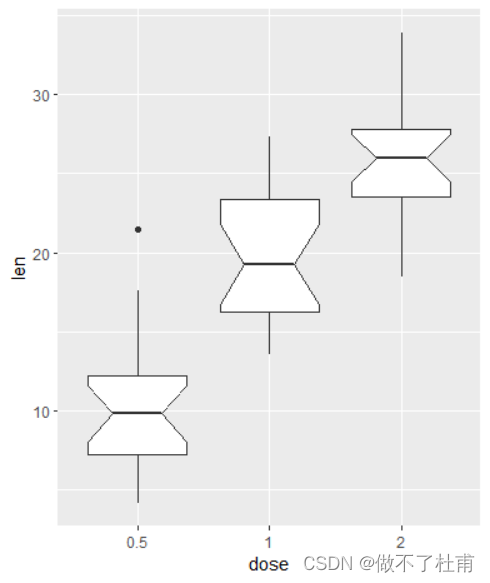
2. Dumbbell box diagram
p + geom_boxplot(notch = TRUE)
The notch parameter is TRUE for a dumbbell shape, and FALSE for a square box shape.

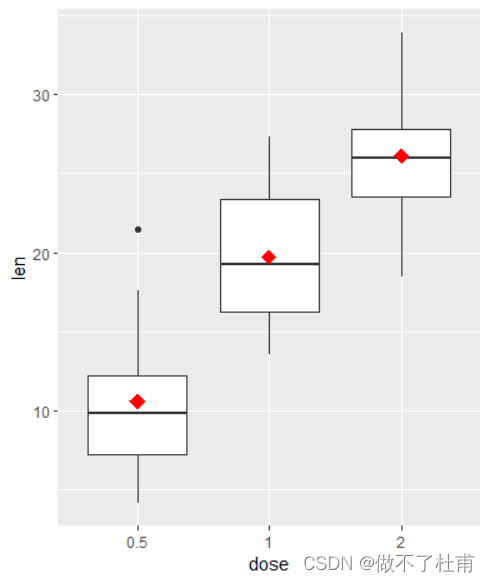
3. Add average points
p + geom_boxplot() + stat_summary(fun.y = mean, geom = "point",
shape = 18, size = 4, color = "red")
Shape is the type of added points, which has been introduced in detail in the article Detailed explanation of scatter plots .
4. Customize the abscissa
p + geom_boxplot() +
scale_x_discrete(limits=c("0.5", "2"))
It can be seen that when specifying the abscissa, some unwanted groups can be removed. For example, above we removed a group of data with dose=1.5.

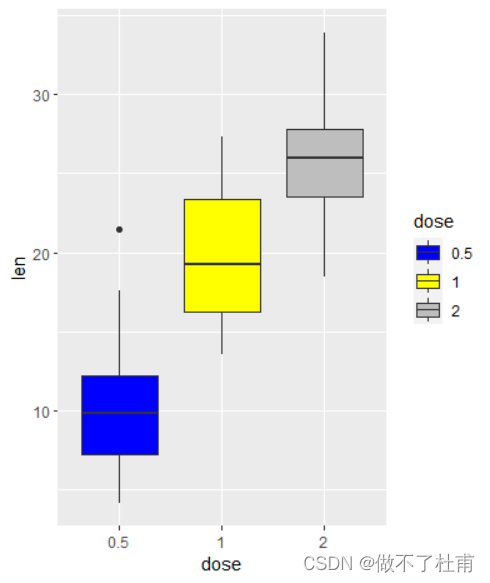
5. Customize cabinet color
#Basic default color for different cabinet colors (internal)
p + geom_boxplot(aes(fill = dose))
#Customize each box color
#Fill color
p + geom_boxplot(aes(fill = dose)) +
scale_fill_manual(values=c("blue", "yellow", "grey"))#Line color
p + geom_boxplot(aes(color = dose)) +
scale_color_manual(values=c("blue", "yellow", "grey"))#Box plot of multiple sets of data
p + geom_boxplot(aes(fill = supp), position = position_dodge(1)) +
scale_fill_manual(values=c("yellow", "grey"))
Small conclusion:
In ggplot2 plotting, the parameter fill represents the internal fill color.
The color parameter indicates the color of the line (border).