TimeGPT provides a powerful multi-series forecasting solution that involves analyzing multiple data series simultaneously instead of a single series. The tool can be fine-tuned using an extensive family, allowing you to tailor the model to your specific needs or tasks.
# Import the colab_badge module from the nixtlats.utils package
from nixtlats.utils import colab_badge
# 导入colab_badge模块,用于在Colab中显示徽章
colab_badge('docs/tutorials/6_multiple_series')
# 导入load_dotenv函数,用于加载.env文件中的环境变量
from dotenv import load_dotenv
# 加载环境变量配置文件
load_dotenv()
True
# 导入pandas和TimeGPT模块
import pandas as pd
from nixtlats import TimeGPT
/home/ubuntu/miniconda/envs/nixtlats/lib/python3.11/site-packages/statsforecast/core.py:25: TqdmWarning: IProgress not found. Please update jupyter and ipywidgets. See https://ipywidgets.readthedocs.io/en/stable/user_install.html
  from tqdm.autonotebook import tqdm
# 定义TimeGPT对象,传入token参数,该参数默认值为os.environ.get("TIMEGPT_TOKEN")
# 这里使用了自己提供的token,用于身份验证和访问TimeGPT API

timegpt = TimeGPT(
    token = 'my_token_provided_by_nixtla'
)
# 创建一个TimeGPT对象,用于生成时间相关的文本。
timegpt = TimeGPT()
The following dataset contains prices from different electricity markets. Let's see how to make predictions. The main parameter of the forecasting method is the input data frame containing the historical values of the time series to be forecasted. This data frame can contain information from many time series. Use the "unique_id" column to identify different time series in the dataset.
# 从指定的URL读取csv文件,并将其存储在DataFrame中
df = pd.read_csv('https://raw.githubusercontent.com/Nixtla/transfer-learning-time-series/main/datasets/electricity-short.csv')

# 显示DataFrame的前几行数据
df.head()
| unique_id | ds | y | |
|---|---|---|---|
| 0 | BE | 2016-12-01 00:00:00 | 72.00 |
| 1 | BE | 2016-12-01 01:00:00 | 65.80 |
| 2 | BE | 2016-12-01 02:00:00 | 59.99 |
| 3 | BE | 2016-12-01 03:00:00 | 50.69 |
| 4 | BE | 2016-12-01 04:00:00 | 52.58 |
Let's StatsForecastplot this series using
# 调用timegpt模块中的plot函数,并传入df参数
timegpt.plot(df)

We just need to pass the dataframe to the function and we can create forecasts for all time series in one go.
# 使用timegpt库中的forecast函数对数据进行预测
# 参数df表示输入的数据框
# 参数h表示预测的时间步长,这里设置为24
# 参数level表示置信水平,这里设置为[80, 90]
timegpt_fcst_multiseries_df = timegpt.forecast(df=df, h=24, level=[80, 90])

# 输出预测结果的前几行
timegpt_fcst_multiseries_df.head()
INFO:nixtlats.timegpt:Validating inputs...
INFO:nixtlats.timegpt:Preprocessing dataframes...
INFO:nixtlats.timegpt:Inferred freq: H
INFO:nixtlats.timegpt:Restricting input...
INFO:nixtlats.timegpt:Calling Forecast Endpoint...
| unique_id | ds | TimeGPT | TimeGPT-lo-90 | TimeGPT-lo-80 | TimeGPT-hi-80 | TimeGPT-hi-90 | |
|---|---|---|---|---|---|---|---|
| 0 | BE | 2016-12-31 00:00:00 | 46.151176 | 36.660475 | 38.337019 | 53.965334 | 55.641878 |
| 1 | BE | 2016-12-31 01:00:00 | 42.426598 | 31.602227 | 33.976717 | 50.876478 | 53.250968 |
| 2 | BE | 2016-12-31 02:00:00 | 40.242889 | 30.439966 | 33.634981 | 46.850798 | 50.045813 |
| 3 | BE | 2016-12-31 03:00:00 | 38.265339 | 26.841481 | 31.022096 | 45.508582 | 49.689197 |
| 4 | BE | 2016-12-31 04:00:00 | 36.618801 | 18.541384 | 27.981348 | 45.256255 | 54.696218 |
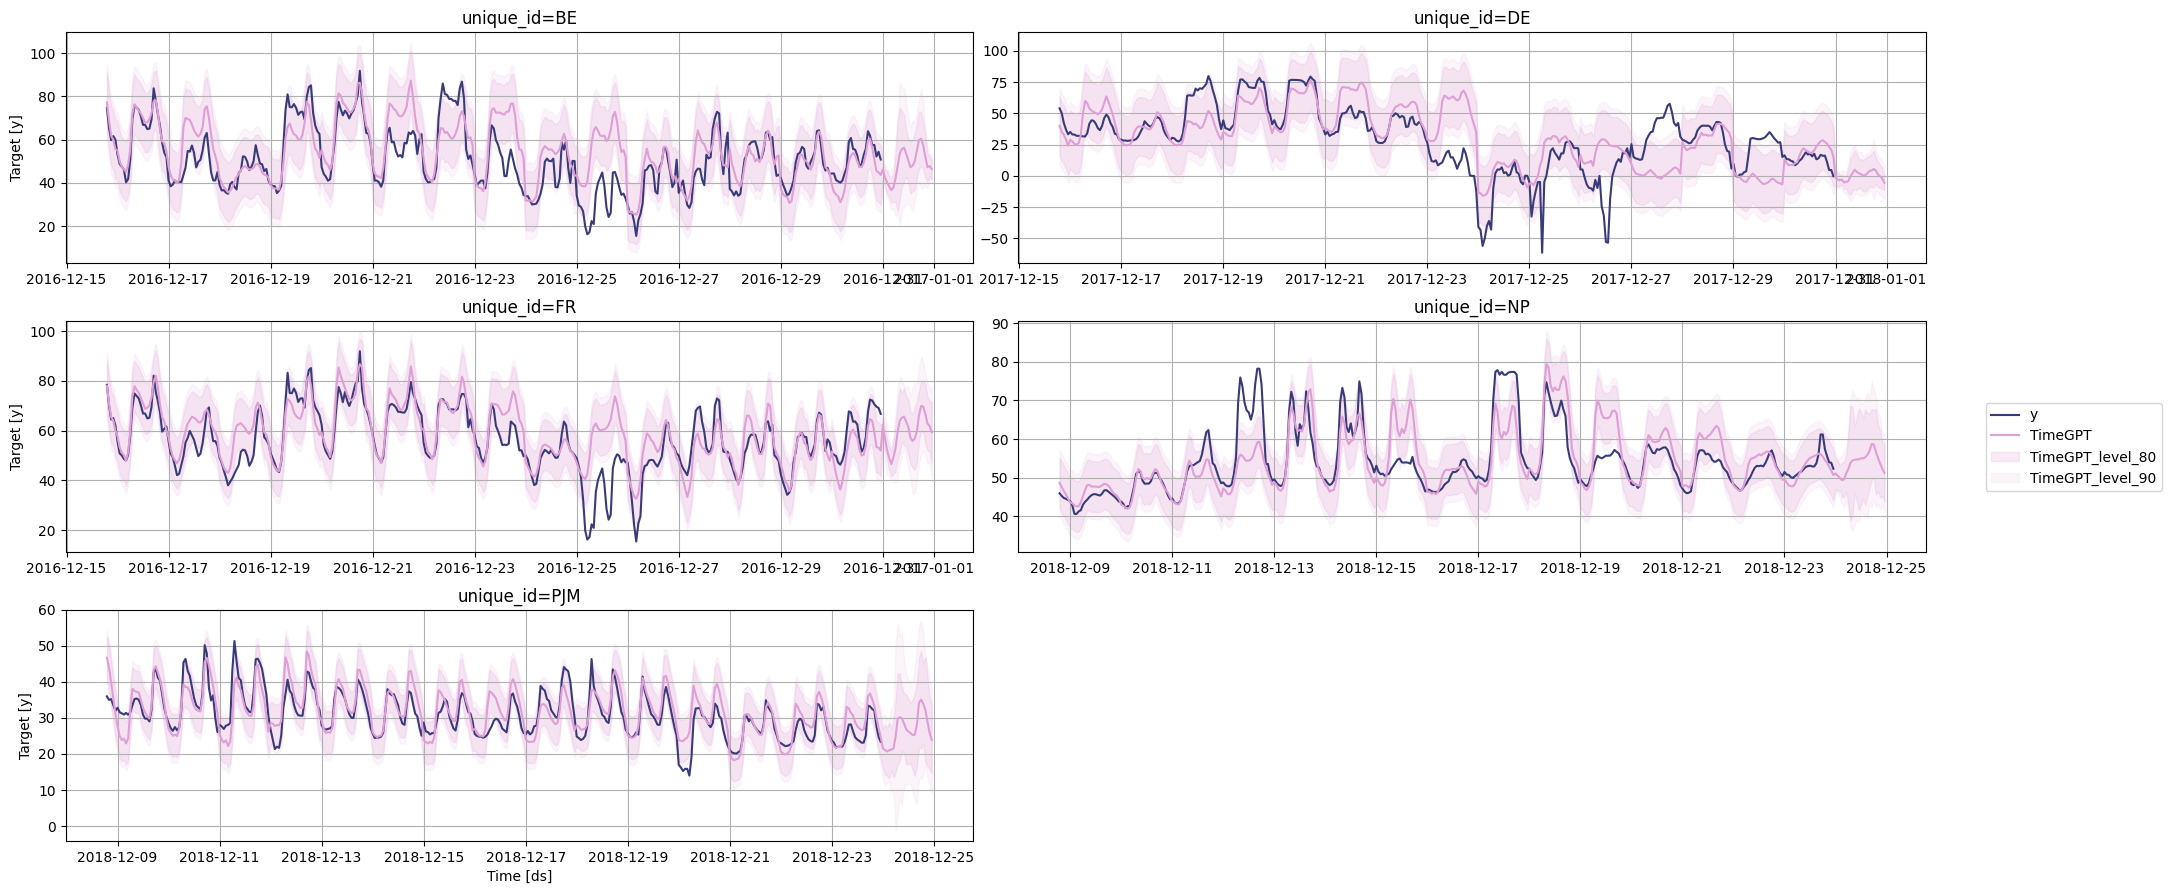
# 绘制时间序列图
timegpt.plot(df, timegpt_fcst_multiseries_df, max_insample_length=365, level=[80, 90])
historical forecast
You can also add_history=Truecalculate prediction intervals for historical forecasts by adding parameters.
# 使用timegpt库中的forecast函数对数据进行预测
# 参数df表示输入的数据框
# 参数h表示预测的时间步长,这里设置为24
# 参数level表示置信水平,这里设置为[80, 90]
# 参数add_history表示是否添加历史数据,这里设置为True
timegpt_fcst_multiseries_with_history_df = timegpt.forecast(df=df, h=24, level=[80, 90], add_history=True)

# 打印预测结果的前几行
timegpt_fcst_multiseries_with_history_df.head()
INFO:nixtlats.timegpt:Validating inputs...
INFO:nixtlats.timegpt:Preprocessing dataframes...
INFO:nixtlats.timegpt:Inferred freq: H
INFO:nixtlats.timegpt:Calling Forecast Endpoint...
INFO:nixtlats.timegpt:Calling Historical Forecast Endpoint...
| unique_id | ds | TimeGPT | TimeGPT-lo-80 | TimeGPT-lo-90 | TimeGPT-hi-80 | TimeGPT-hi-90 | |
|---|---|---|---|---|---|---|---|
| 0 | BE | 2016-12-06 00:00:00 | 55.756325 | 42.066469 | 38.185585 | 69.446180 | 73.327064 |
| 1 | BE | 2016-12-06 01:00:00 | 52.820198 | 39.130342 | 35.249458 | 66.510054 | 70.390938 |
| 2 | BE | 2016-12-06 02:00:00 | 46.851078 | 33.161222 | 29.280338 | 60.540934 | 64.421818 |
| 3 | BE | 2016-12-06 03:00:00 | 50.640884 | 36.951029 | 33.070145 | 64.330740 | 68.211624 |
| 4 | BE | 2016-12-06 04:00:00 | 52.420395 | 38.730539 | 34.849655 | 66.110251 | 69.991134 |
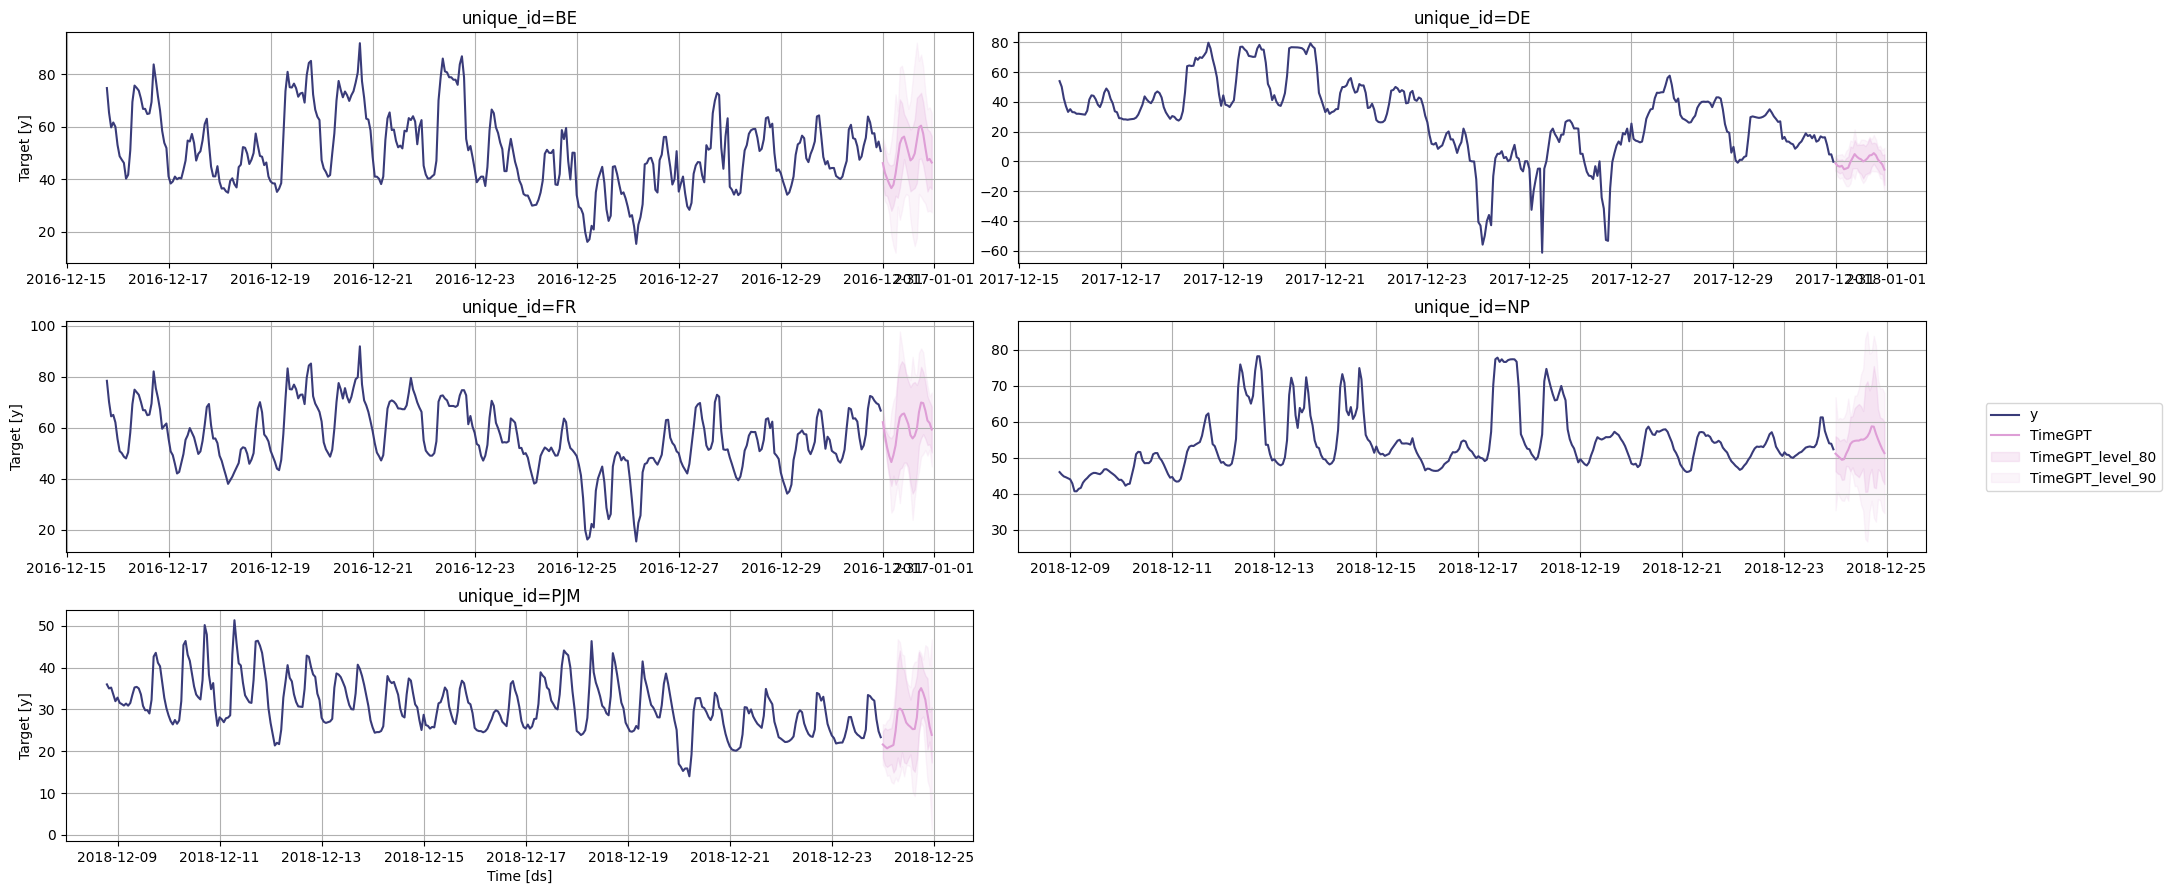
# 绘制时间序列图
timegpt.plot(
    df,  # 数据框,包含要绘制的时间序列数据
    timegpt_fcst_multiseries_with_history_df.groupby('unique_id').tail(365 + 24),  # 根据唯一ID分组的数据框,包含历史数据和预测数据
    max_insample_length=365,  # 最大的历史数据长度
    level=[80, 90],  # 置信水平
)