Preface
Please read the official pwntools issues first to ensure that other people's answers still cannot solve the problem:
docker gdb attach #1140
Long version without reading:
First usepwn version to confirm your pwntools version. If it is 4.6.0 and earlier versions, this problem exists. If so, find a directory to download the latest version: git clone --depth 1 git://github.com/Gallopsled/pwntools, and then use pip install --upgrade --editable ./pwntools directly without cd to switch directories. This statement will automatically uninstall the current pwntools and install the development version. The problem of infinite waiting in Waiting for debugger was just fixed 4 days ago (2021-7-15) when this blog was published...
background
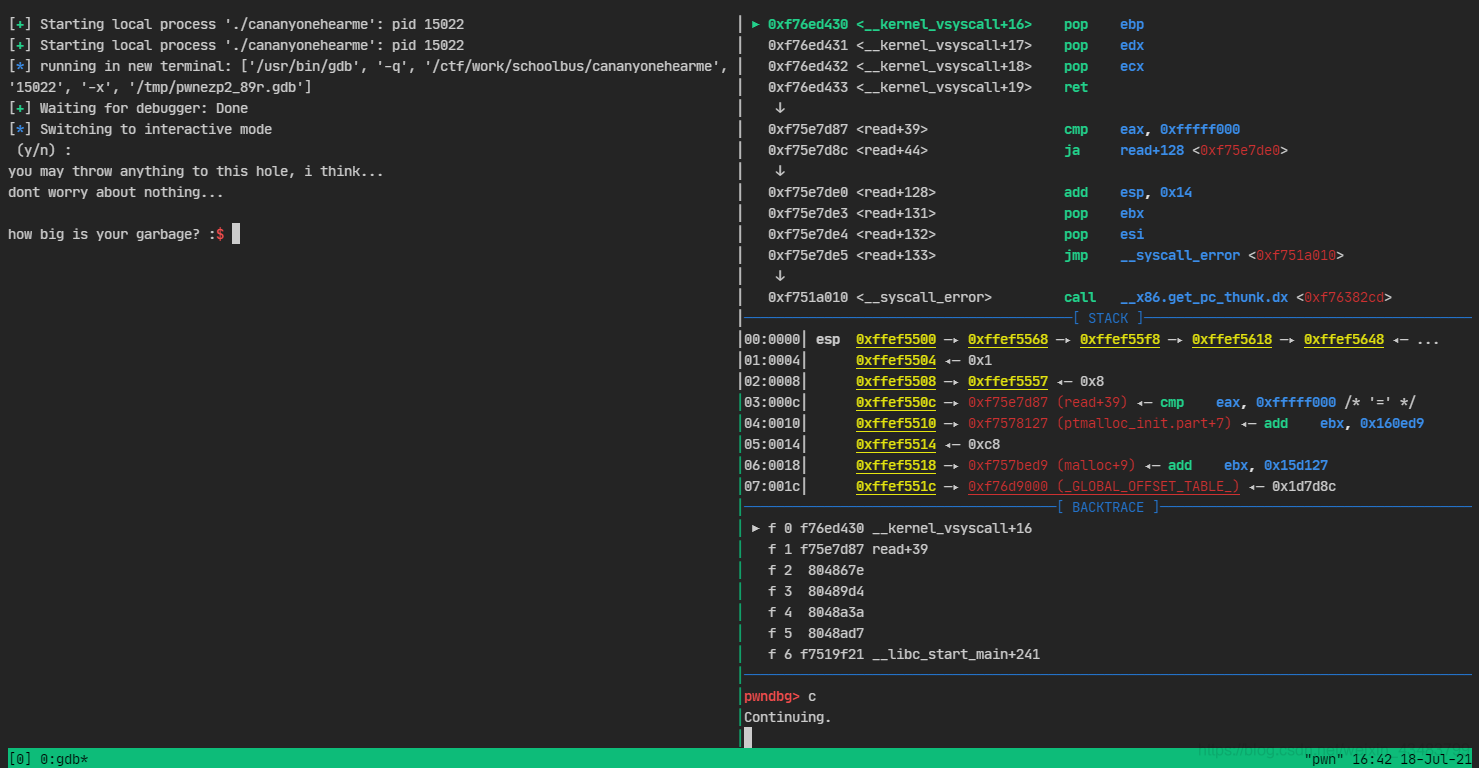
Use ssh to connect to the centos server, use pwndocker of c01dkit/pwndocker, and open tmux, use context.terminal = ['tmux','splitw','-h'] and gdb.attach(xxxx) to appear Waiting for debugger , and then wait indefinitely, even if gdb attaches to the program normally. The screenshot is as follows:
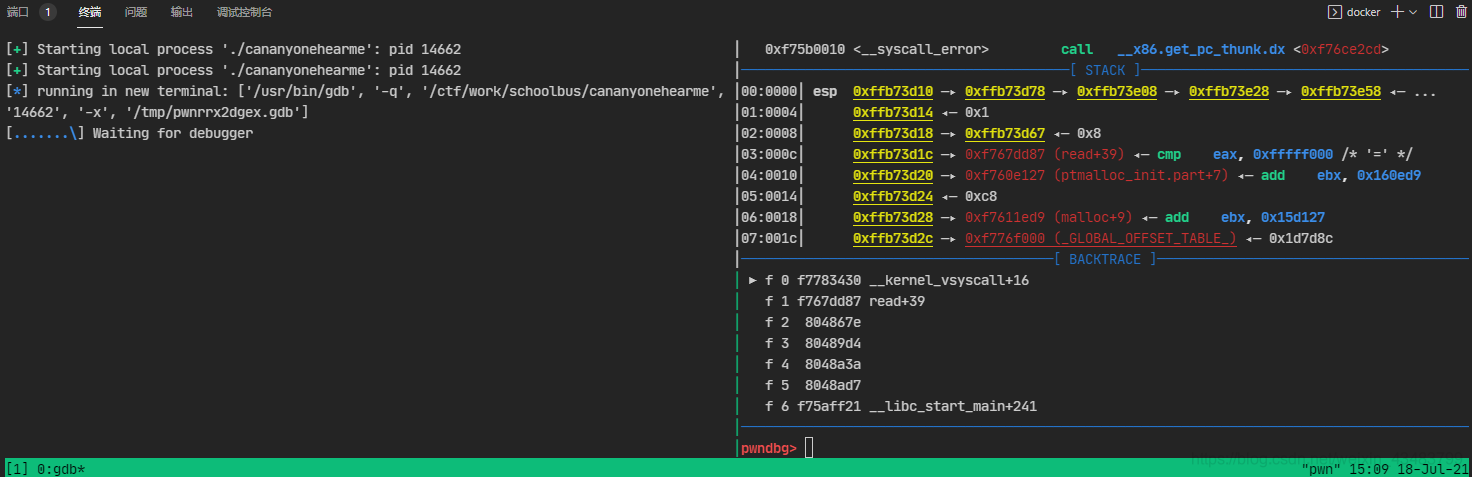
Under normal circumstances, if the debugger does not return within 15s, the program will report a failure. But no matter how long I wait, I never return.
Solutions
Debugging found that this is due to the wait_for_debugger function of /usr/local/lib/python3.6/dist-packages/pwnlib/util/proc.py in
while t.timeout and tracer(pid) is None:
This loop is executed infinitely. By adding debugging statements outside this while, we can find that the problem with the source code here is that countdown does not count down as expected, causing an infinite loop.
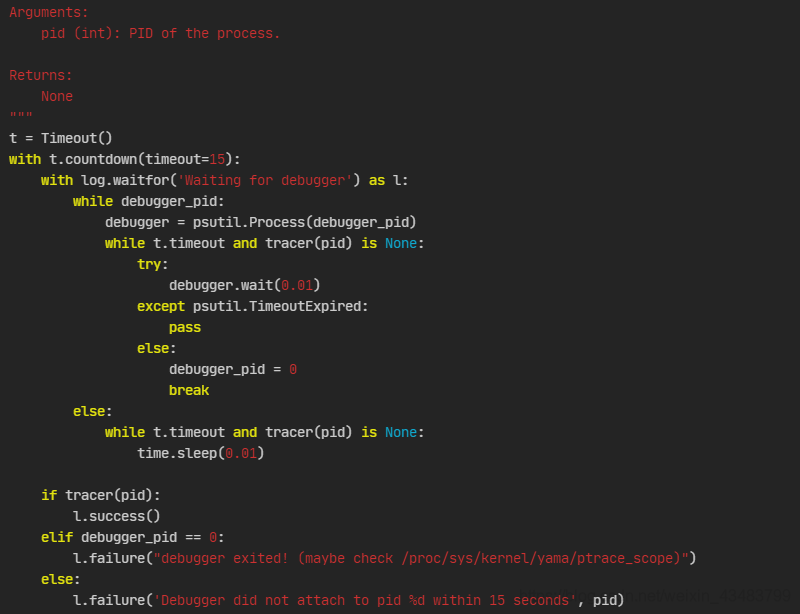
If you are interested, you can read it /usr/local/lib/python3.6/dist-packages/pwnlib/timeout.py Regarding the implementation of the countdown, we will not start by changing the timeout here (because what we need to solve is not the infinite loop, but the solution to the infinite loop. Reason for loop)
tracer
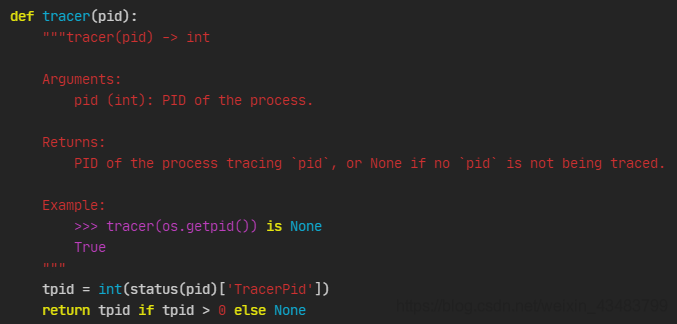
Further debugging (run a program on the console, use ps -aux to check its pid, and use the tracer function of proc.py under pwnlib.util of pwntools to manually check the pid information) found that there is a problem with the tracer function. Under the circumstances mentioned in the background, the return value of this function is always None. The function is implemented as follows (in /usr/local/lib/python3.6/dist-packages/pwnlib/util/proc.py):
status
The status it calls is also in this file, and the implementation method is as follows:
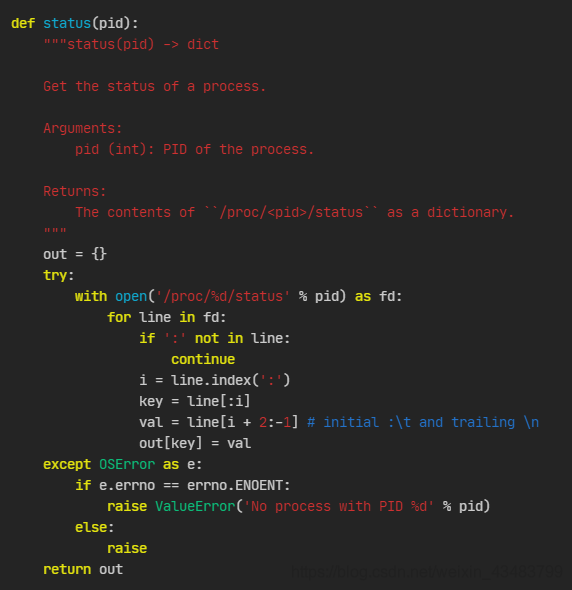
It can be seen that it goes to /proc/<pid>/status to check the specific information, and then makes it Dictionary and return. The tracer function then extracts the TracerPid field from the dictionary to see whether the binary program has been traced by gdb. Here is an example of a /proc/14792/status file (a question from buuctf). Note that the TracerPid field in the status file is 0 because gdb debugging is not enabled.
#运行程序后,先ps -aux一下
root@pwn:/usr/local/lib/python3.6/dist-packages/pwnlib/util# ps -aux
USER       PID %CPU %MEM    VSZ   RSS TTY      STAT START   TIME COMMAND
root         1  0.0  0.0  21764  2000 pts/0    Ss+  Jul17   0:00 bash
root     13799  0.0  0.0  21884  2268 pts/1    Ss+  02:39   0:00 /bin/bash
root     14375  0.0  0.0  21888  2312 pts/2    Ss   13:39   0:00 /bin/bash
root     14390  0.0  0.0  21888  2320 pts/3    Ss   13:39   0:00 /bin/bash
root     14792  0.0  0.0   4504   384 pts/3    S+   15:51   0:00 ./bjdctf_2020_babystack
root     14795  0.1  0.0  21896  2212 pts/4    Ss+  15:52   0:00 /bin/bash
root     14811  0.0  0.0  37660  1572 pts/2    R+   15:53   0:00 ps -aux
# 然后查看该文件的status
root@pwn:/usr/local/lib/python3.6/dist-packages/pwnlib/util# cat /proc/14792/status
Name:   bjdctf_2020_bab
Umask:  0022
State:  S (sleeping)
Tgid:   14792
Ngid:   0
Pid:    14792
PPid:   14390
TracerPid:      0
Uid:    0       0       0       0
Gid:    0       0       0       0
FDSize: 256
Groups:
VmPeak:     4504 kB
VmSize:     4504 kB
VmLck:         0 kB
VmPin:         0 kB
VmHWM:       384 kB
VmRSS:       384 kB
RssAnon:              64 kB
RssFile:             320 kB
RssShmem:              0 kB
VmData:      168 kB
VmStk:       132 kB
VmExe:         4 kB
VmLib:      2112 kB
VmPTE:        36 kB
VmSwap:        0 kB
Threads:        1
SigQ:   0/127718
SigPnd: 0000000000000000
ShdPnd: 0000000000000000
SigBlk: 0000000000000000
SigIgn: 0000000000000000
SigCgt: 0000000000000000
CapInh: 0000001fffffffff
CapPrm: 0000001fffffffff
CapEff: 0000001fffffffff
CapBnd: 0000001fffffffff
CapAmb: 0000000000000000
NoNewPrivs:     0
Seccomp:        0
Speculation_Store_Bypass:       thread vulnerable
Cpus_allowed:   00ffffff
Cpus_allowed_list:      0-23
Mems_allowed:   00000000,00000000,00000000,00000000,00000000,00000000,00000000,00000000,00000000,00000000,00000000,00000000,00000000,00000000,00000000,00000000,00000000,00000000,00000000,00000000,00000000,00000000,00000000,00000000,00000000,00000000,00000000,00000000,00000000,00000000,00000000,00000003
Mems_allowed_list:      0-1
voluntary_ctxt_switches:        1
nonvoluntary_ctxt_switches:     1
Then open a window and usegdb -p 14792 to track this program. The results are as follows:
#这里已经attach了一个gdb,看一下程序运行情况
root@pwn:/usr/local/lib/python3.6/dist-packages/pwnlib/util# ps -aux
USER       PID %CPU %MEM    VSZ   RSS TTY      STAT START   TIME COMMAND
root         1  0.0  0.0  21764  2000 pts/0    Ss+  Jul17   0:00 bash
root     13799  0.0  0.0  21884  2268 pts/1    Ss+  02:39   0:00 /bin/bash
root     14375  0.0  0.0  21888  2312 pts/2    Ss   13:39   0:00 /bin/bash
root     14390  0.0  0.0  21888  2320 pts/3    Ss   13:39   0:00 /bin/bash
root     14792  0.0  0.0   4504   400 pts/3    t+   15:51   0:00 ./bjdctf_2020_babystack
root     14795  0.0  0.0  21896  2212 pts/4    Ss   15:52   0:00 /bin/bash
root     14812  7.5  0.1 180148 65140 pts/4    S+   15:53   0:01 gdb -p 14792
root     14819  0.0  0.0  37660  1568 pts/2    R+   15:53   0:00 ps -aux
#然后再看一下status
root@pwn:/usr/local/lib/python3.6/dist-packages/pwnlib/util# cat /proc/14792/status
Name:   bjdctf_2020_bab
Umask:  0022
State:  t (tracing stop)
Tgid:   14792
Ngid:   0
Pid:    14792
PPid:   14390
TracerPid:      14812  #这里已经更新,变成了gdb的pid。
Uid:    0       0       0       0
Gid:    0       0       0       0
FDSize: 256
Groups:
VmPeak:     4504 kB
VmSize:     4504 kB
VmLck:         0 kB
VmPin:         0 kB
VmHWM:       400 kB
VmRSS:       400 kB
RssAnon:              64 kB
RssFile:             336 kB
RssShmem:              0 kB
VmData:      168 kB
VmStk:       132 kB
VmExe:         4 kB
VmLib:      2112 kB
VmPTE:        36 kB
VmSwap:        0 kB
Threads:        1
SigQ:   0/127718
SigPnd: 0000000000000000
ShdPnd: 0000000000000000
SigBlk: 0000000000000000
SigIgn: 0000000000000000
SigCgt: 0000000000000000
CapInh: 0000001fffffffff
CapPrm: 0000001fffffffff
CapEff: 0000001fffffffff
CapBnd: 0000001fffffffff
CapAmb: 0000000000000000
NoNewPrivs:     0
Seccomp:        0
Speculation_Store_Bypass:       thread vulnerable
Cpus_allowed:   00ffffff
Cpus_allowed_list:      0-23
Mems_allowed:   00000000,00000000,00000000,00000000,00000000,00000000,00000000,00000000,00000000,00000000,00000000,00000000,00000000,00000000,00000000,00000000,00000000,00000000,00000000,00000000,00000000,00000000,00000000,00000000,00000000,00000000,00000000,00000000,00000000,00000000,00000000,00000003
Mems_allowed_list:      0-1
voluntary_ctxt_switches:        2
nonvoluntary_ctxt_switches:     1
So the essence of the tracer function is to read information from the system file to see which program is tracking this program. Then after adding debugging statements to the python file and checking using the same method, it was found that the tracer pid can indeed be obtained. The wait_for_debugger function here uses a check every 0.1s. (I originally thought that this method could not get the tracer pid, but later I found that it was indeed possible. The first few times I ran the tracing program, it was None, and then it was the normal pid.)
the real reason
Observing the program carefully, I found that there is a problem with the program logic design...even if the correct pid is obtained, wait_for_debugger will enter an infinite loop. It's okay to exit after timeout, but I don't know why I can't exit after timeout is broken (hhh)
Simply putwhile debugger_pid:This loop cannot be exited, because when everything is normaldebugger_pid = 0 will not be executed, so this is an infinite loop!
#/usr/local/lib/python3.6/dist-packages/pwnlib/util/proc.py

def wait_for_debugger(pid, debugger_pid=None):
    """wait_for_debugger(pid, debugger_pid=None) -> None

    Sleeps until the process with PID `pid` is being traced.
    If debugger_pid is set and debugger exits, raises an error.

    Arguments:
        pid (int): PID of the process.

    Returns:
        None
    """
    t = Timeout()
    with t.countdown(timeout=15):
        with log.waitfor('Waiting for debugger') as l:
            while debugger_pid:
                debugger = psutil.Process(debugger_pid)
                while t.timeout and tracer(pid) is None:
                    try:
                        debugger.wait(0.01)
                    except psutil.TimeoutExpired:
                        pass
                    else:
                        debugger_pid = 0
                        break
            else:
                while t.timeout and tracer(pid) is None:
                    time.sleep(0.01)

        if tracer(pid):
            l.success()
        elif debugger_pid == 0:
            l.failure("debugger exited! (maybe check /proc/sys/kernel/yama/ptrace_scope)")
        else:
            l.failure('Debugger did not attach to pid %d within 15 seconds', pid)
After wandering around for a long time, I finally discovered the cause of the endless loop.
solution
Then just modify the source code slightly. That is, if you find the tracer, you don't need to be in the while, just exit the loop and it's done~
vim /usr/local/lib/python3.6/dist-packages/pwnlib/util/proc.py, and then replace the wait_for_debugger function with the following one. (Actually, only a small change was made, so just manually modify two or three lines)
#/usr/local/lib/python3.6/dist-packages/pwnlib/util/proc.py

def wait_for_debugger(pid, debugger_pid=None):
    """wait_for_debugger(pid, debugger_pid=None) -> None

    Sleeps until the process with PID `pid` is being traced.
    If debugger_pid is set and debugger exits, raises an error.

    Arguments:
        pid (int): PID of the process.

    Returns:
        None
    """
    t = Timeout()
    with t.countdown(timeout=15):
        with log.waitfor('Waiting for debugger') as l:
            while debugger_pid:
                debugger = psutil.Process(debugger_pid)
                #while t.timeout and tracer(pid) is None:
                if tracer(pid) is not None: break
                try:
                    debugger.wait(0.01)
                except psutil.TimeoutExpired:
                    pass
                else:
                    debugger_pid = 0
            else:
                while t.timeout and tracer(pid) is None:
                    time.sleep(0.01)

        if tracer(pid):
            l.success()
        elif debugger_pid == 0:
            l.failure("debugger exited! (maybe check /proc/sys/kernel/yama/ptrace_scope)")
        else:
            l.failure('Debugger did not attach to pid %d within 15 seconds', pid)
final effect
As shown in the picture below, the infinite loop of waiting for debugger is solved!
Summarize
There will also be problems with the code written by DLs... Don't blindly worship it. I originally planned to submit an issue, but found that it could not be uploaded to github, so I will discuss it another day.
Supplement on July 19, 2021: I went to github today and found that this bug wasfixed four days ago...Okay T_T