This article is to teach you how to learn dynamic debugging. Then I also wrote an article about dynamic debugging. It is either the questions above buu or two simple stack overflow problems. Those two questions are quite distinctive. Everyone can go and take a look.
Daily 3 PWN courses and 2 extracurricular courses (Day 2.5)-CSDN Blog
First find a simple jarvisoj_level0 to debug, and then we will look at the complex pwn1_sctf_2016
I heard that I won’t take the pwn exam anymore, so I only finished jarvisoj_level0. Now I’m switching careers to learn reverse engineering.
So, work is suspended~~~Private Marseille!
Requires environment gdb and pwotool+pwndbg
yearbooks_level0
Recall first
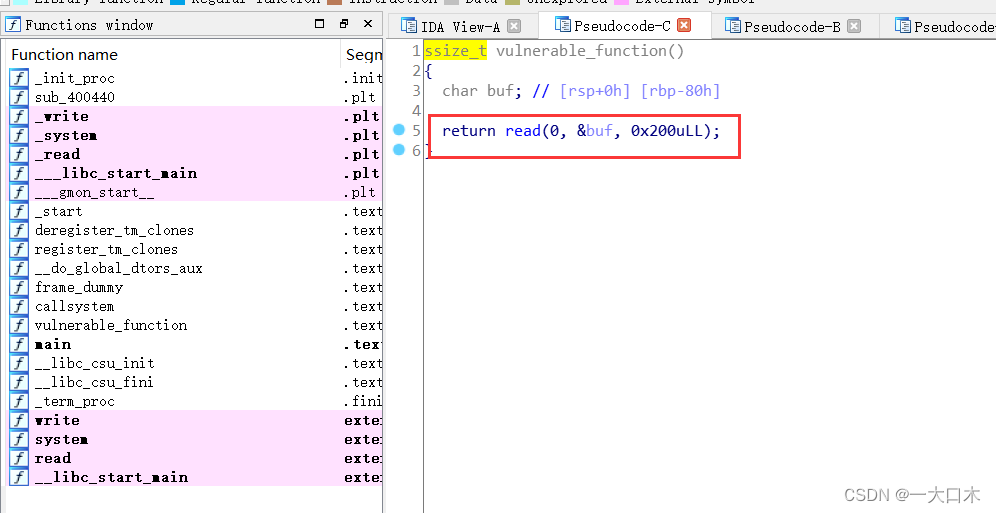
After entering, press f5 to view the decompiled code.

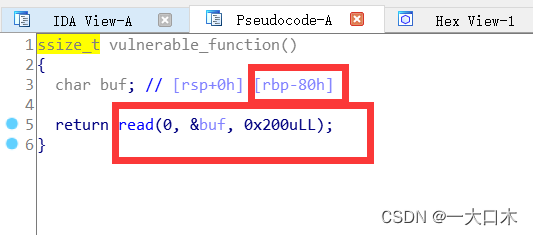
Take a look at the function vulnerable_function
Find the backdoor shift+f12
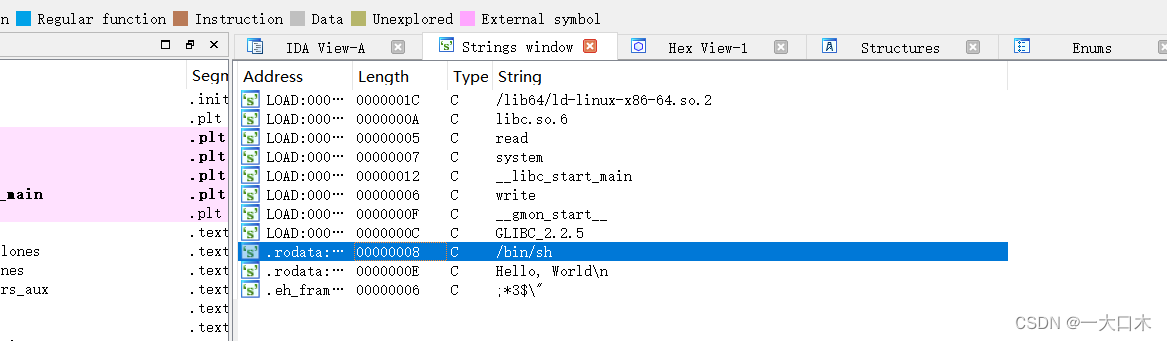
Double click to follow
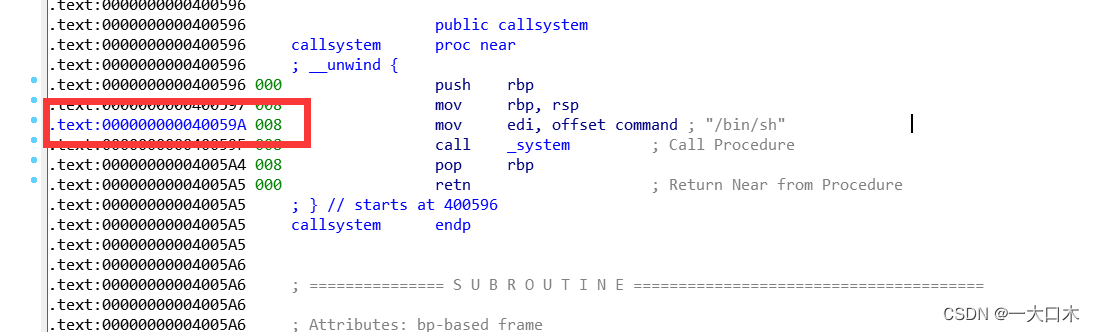
Record address 0x40059A
You may have recalled it, but it was read overflow. I wrote about the problem solving ideas on another blog. You can check it out.
3 PWNs a day (second day)-CSDN Blog
Dynamic debugging
Now we proceed to dynamic debugging
The normal process of dynamic analysis, gdb opens the file
Two ways to view the size of a variable
Method 1 (breakpoint of regular main + honest viewing)
b main set breakpoint
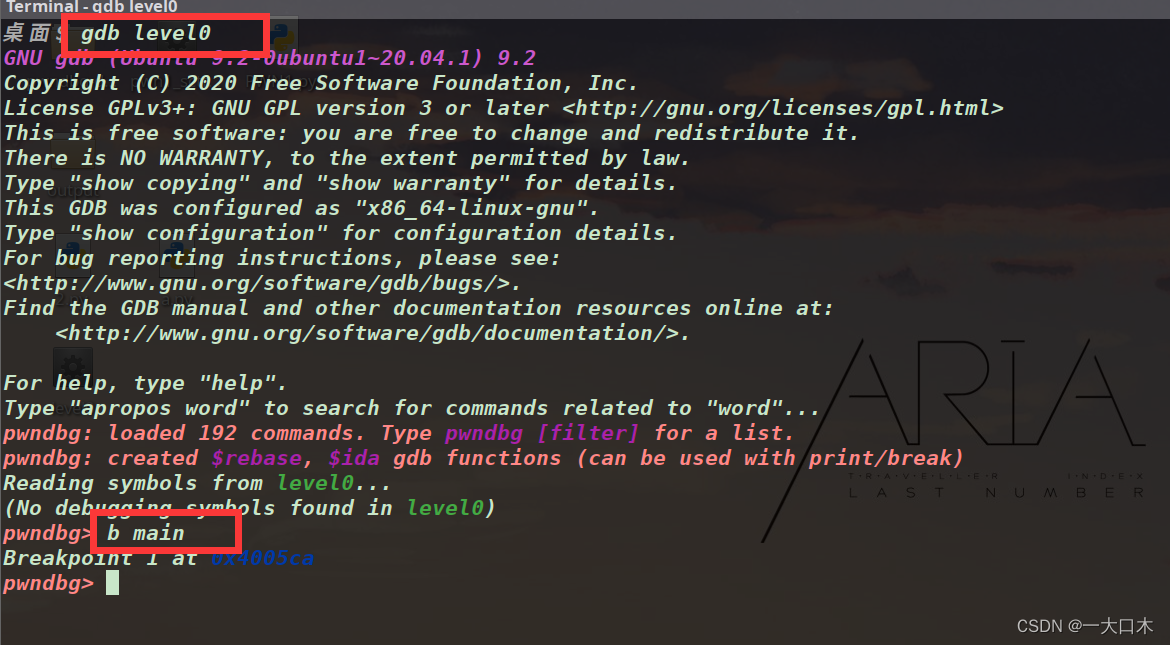
Ah, he said that I don’t have enough permissions. Wait for me. First, chmod +x level0.
Then do it again, run it, and we can see the assembly and stack of the main function.
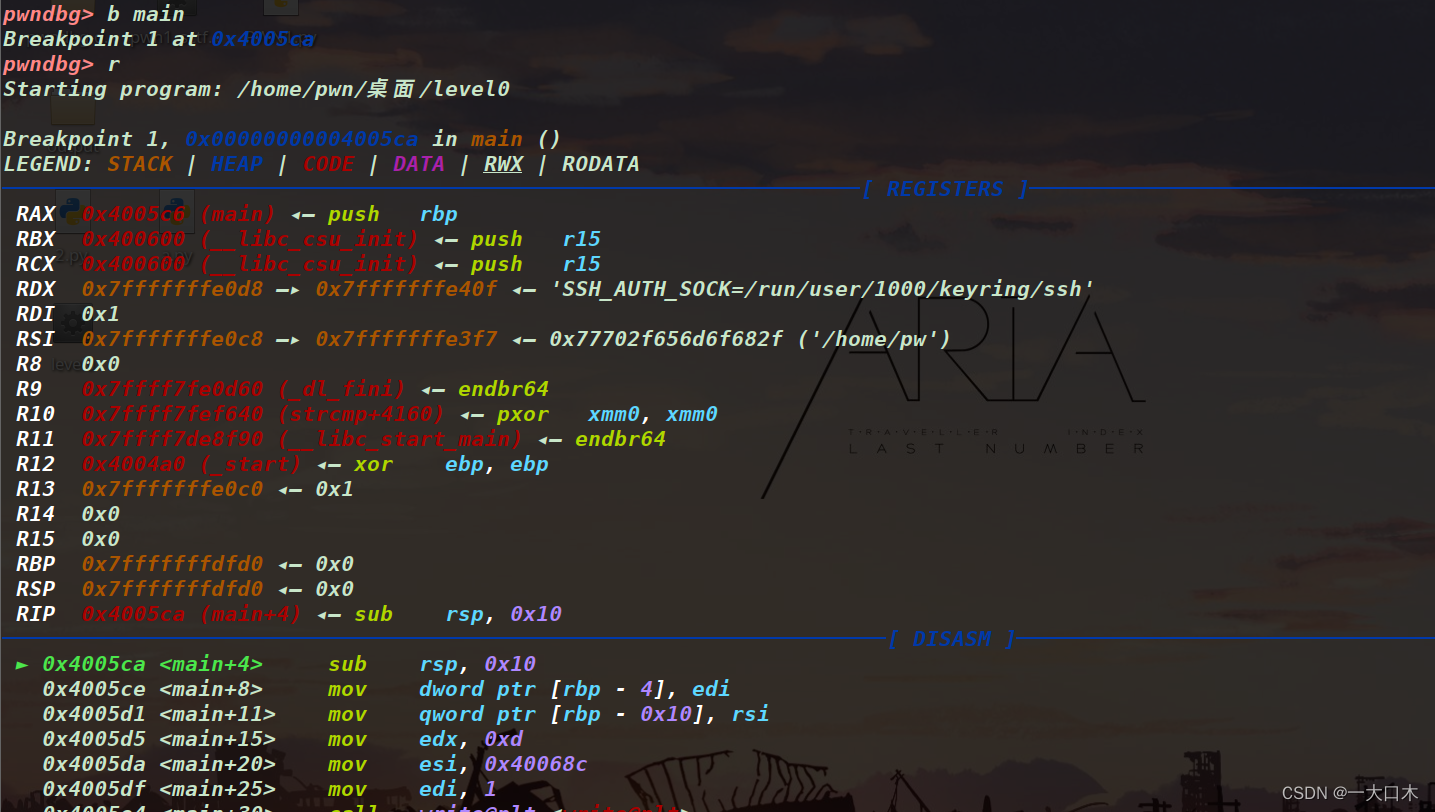
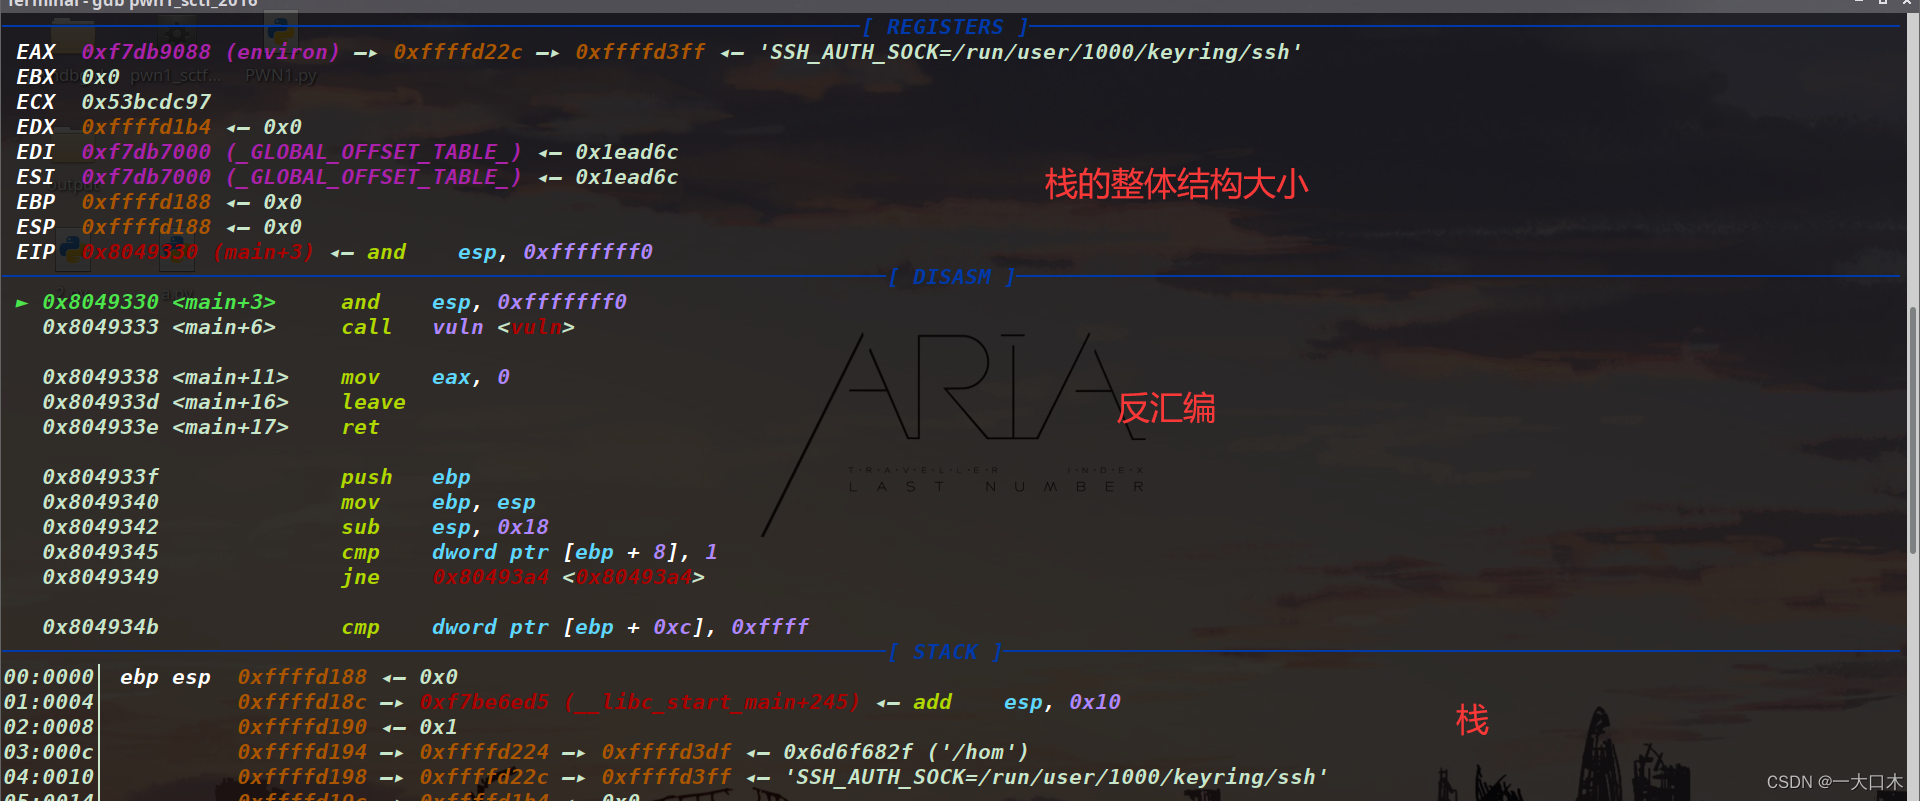
The picture below is not of this question, but it has a rough explanation of the structure.
Note: asm means assembly in English, registers means registers, and stack means stack.
I saw the vulnerable function. Why do I know it is a vulnerable function? Of course, it’s because I have done static analysis with IDA in my blog before~
And the Chinese meaning of this function is a vulnerable function.
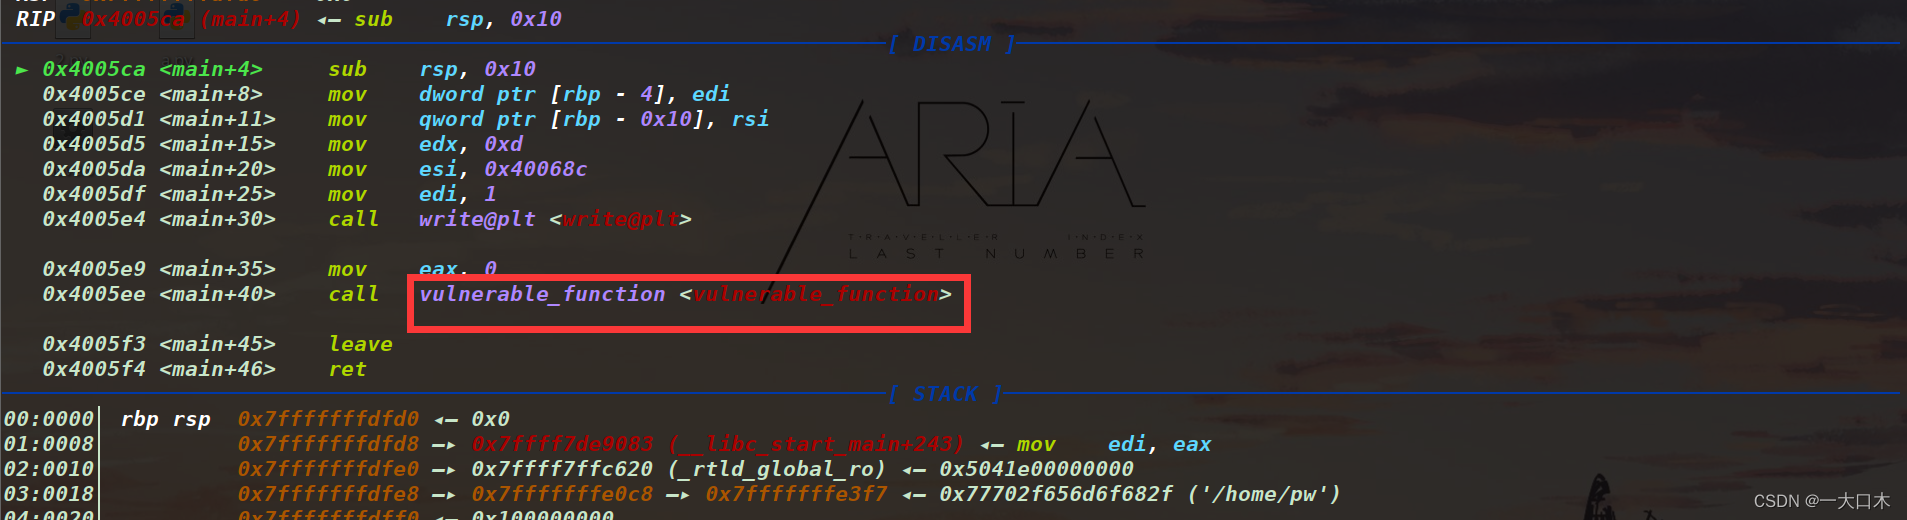
We just keep entering n, and then we know that the green arrow points to the vulnerable function vulnerable_function
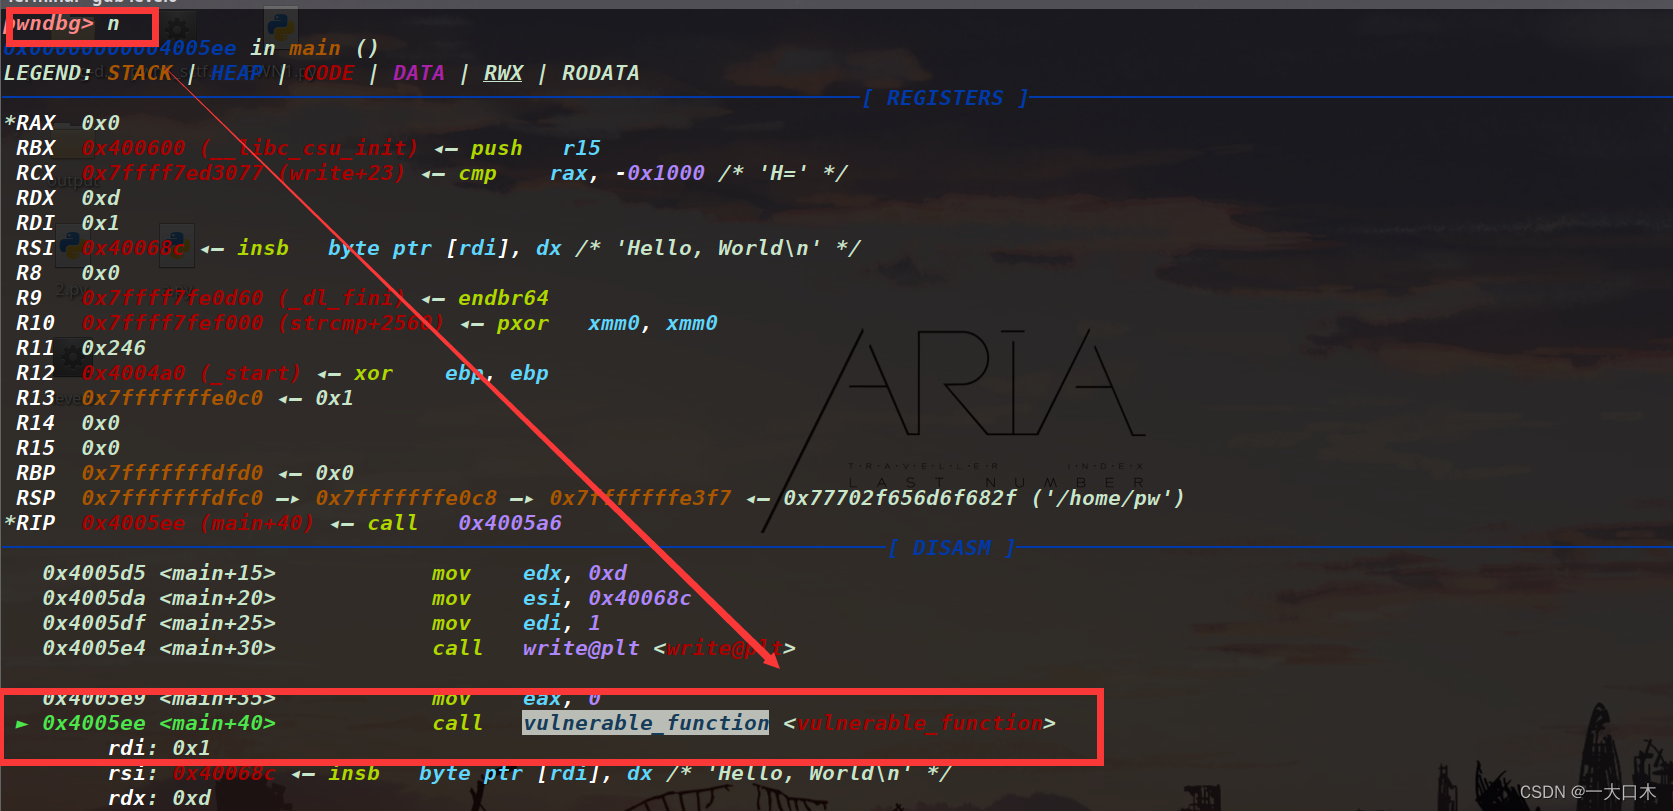
Press s, s is step, si is a single step, and enter the function. You see, the exploit point, the read function
Tips: fini exits the current function, and r reruns it. If you make a mistake, you can try these two.

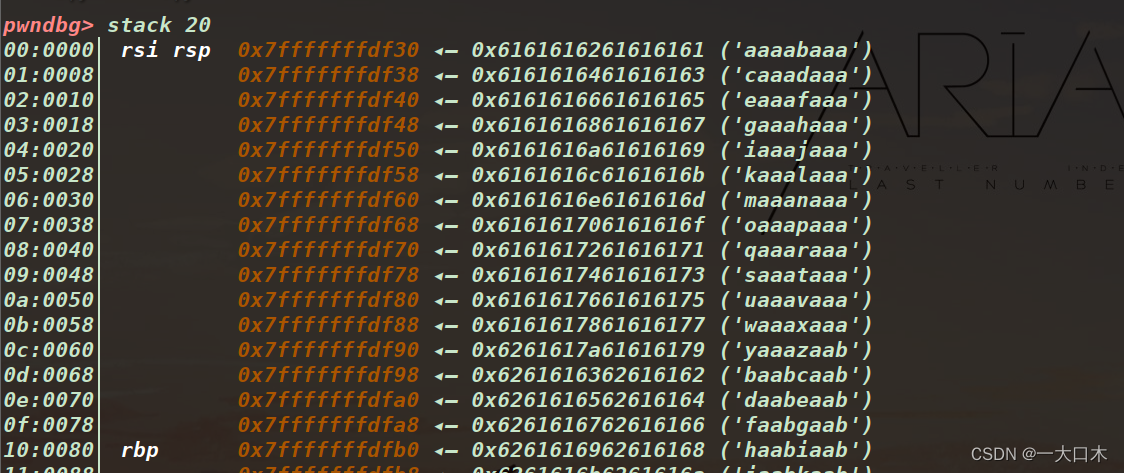
The stack 24 command displays the first 24 stack frames of the current stack.
Why stack 24?
Our purpose is to check the size of the current variable buf. The premise is to enter the function, that is, n and continue to the next step. After pointing to the function, enter s and single-step into the function to see the variable buf. So we need to stack
Then why 24? I heard from my boss that no matter how many times are entered, the purpose is just to see ebp or rbp. Then we use the address of ebp (or rbp) minus the address of eax (or rsi) to calculate the variable. size
Here is rbp's 0x7ffffffffdfb0 minus rsi's 0x7fffffffdf30
like this
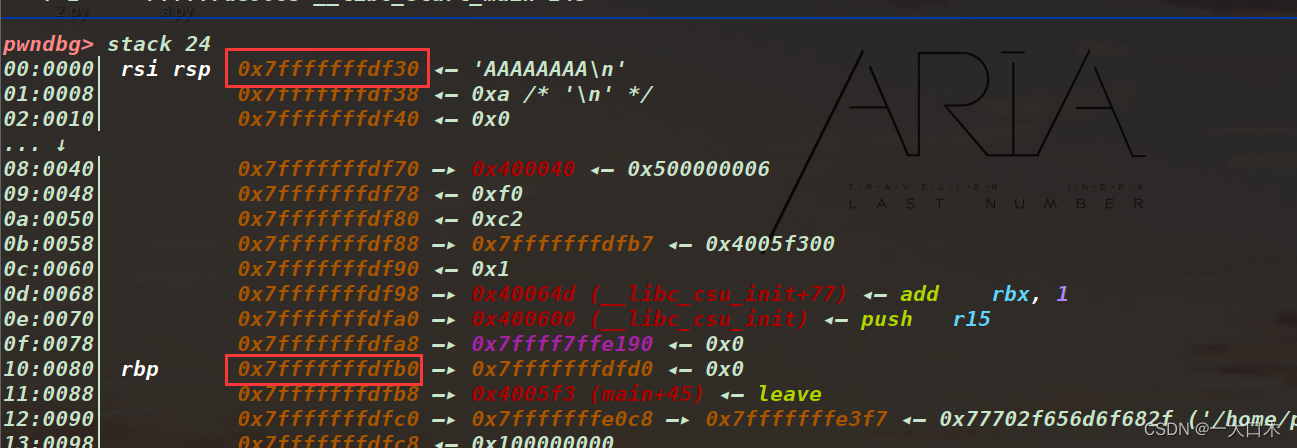
Let’s just look at the last two digits and subtract them, that is, 0xb0-0x30=0x80=128
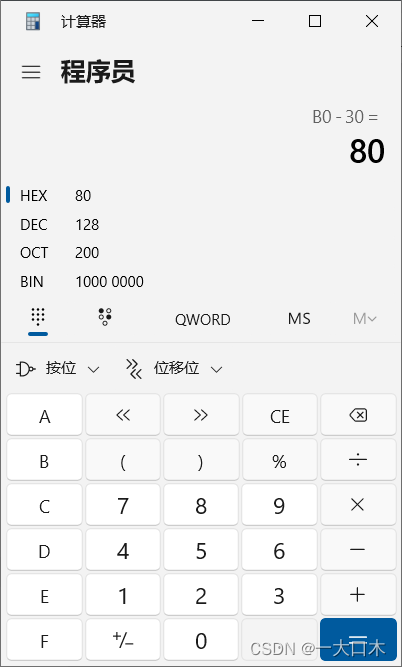
Size 0x80, let’s see if it’s correct
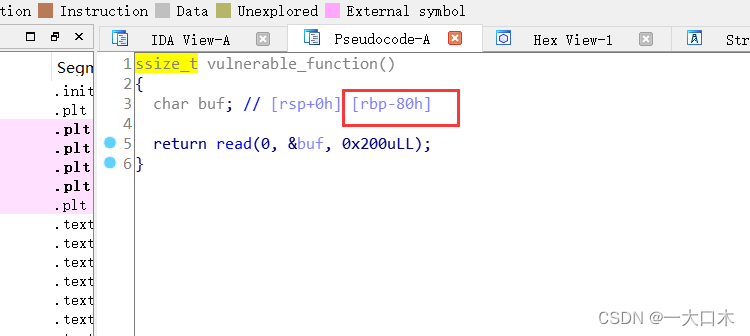
Yes. wood problem
etc
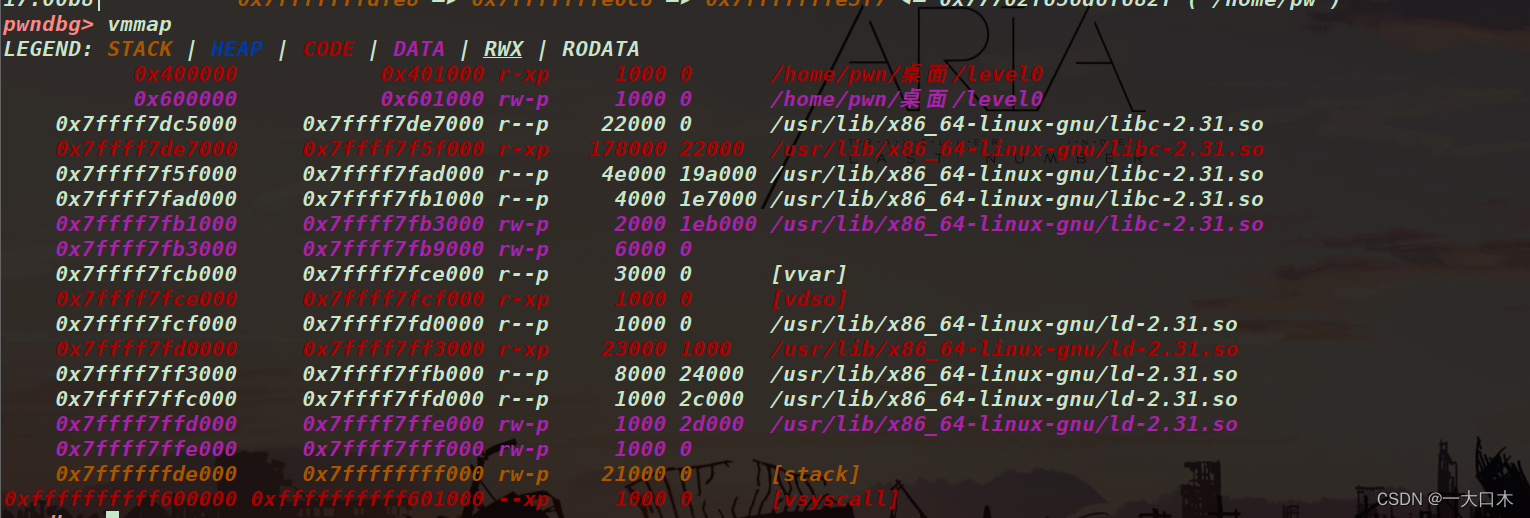
Use vmmap to directly check the memory space of the process. I don’t know what the use is. I’ll ask the experts later.
He said that it is mainly used to check the execution permissions, the rwxp permissions, and whether there are ASRL vulnerabilities or other issues.
Method 2 (other ways to use breakpoints) was unsuccessful
reference
Stack overflow learning_loglevel:'debug-CSDN blog
cyclic is a tool that comes with pwntools
There are two commonly used functions:
Find the offset (Offset): When you want to exploit a vulnerability such as a stack overflow, you usually need to know the offset of the buffer on the stack in the target program to determine the exact overlay location. Using the "cyclic" tool, a repeating pattern can be generated and sent to the target program, and then when the program crashes, the offset can be calculated by looking for the location covered by the crash.
Overwriting the return address: When exploiting a stack overflow vulnerability, it is usually necessary to write the address of the malicious code into the return address to control the program flow. Use the "cyclic" tool to generate a repeating pattern of a specified length and use it as a return address to make the program jump to a location we control.
Find the offset, the following is the example code:
from pwn import *

pattern = cyclic(100)  # 生成长度为100的重复模式,就相当于b'A'*n
print(pattern)

# 在漏洞利用中发送模式给目标程序
p = process('./vulnerable_program')
p.sendline(pattern)
p.recv()  //接受数据的意思,就是有时候他会有一个提示的字符串,需要你先进性接收
p.close() //关闭接受的意思

# 漏洞触发后,获取返回地址所在的偏移量
offset = cyclic_find(packed_address)  # packed_address为返回地址
print(offset)
Then what I want to talk about is the use of cyclic in gdb. The target is 0x80=128. It can be a little more for overflow, or it can be exactly equal to 128.
128-bit garbage data is generated here, and you can copy and paste it directly after a while.

This time I will also learn the following other ways to break points:
First, go to IDA to find the address of the exploit function, and set a breakpoint on the address.
First find the read function that exploits the vulnerability
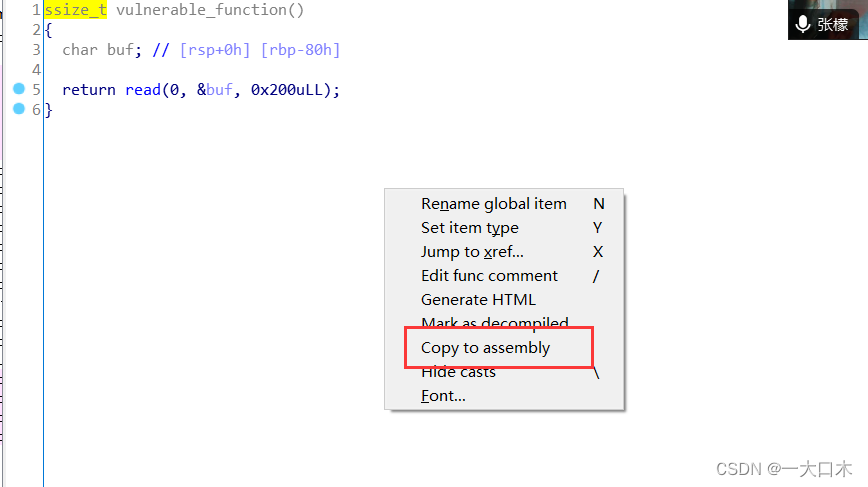
Then right-click and select copy to assembly (copy to assembly means, we don’t know what assembly means, but the function is to compile each line of source code into assembly code and comment it out)
The assembly code of call means function, followed by the word read.
That's him, remember the address 0x4005bf

gdb break point
tip: By the way, a breakpoint is to stop the program after running at a given position, and then proceed step by step. It is for programmers to debug.
Break point b *address, don’t forget*
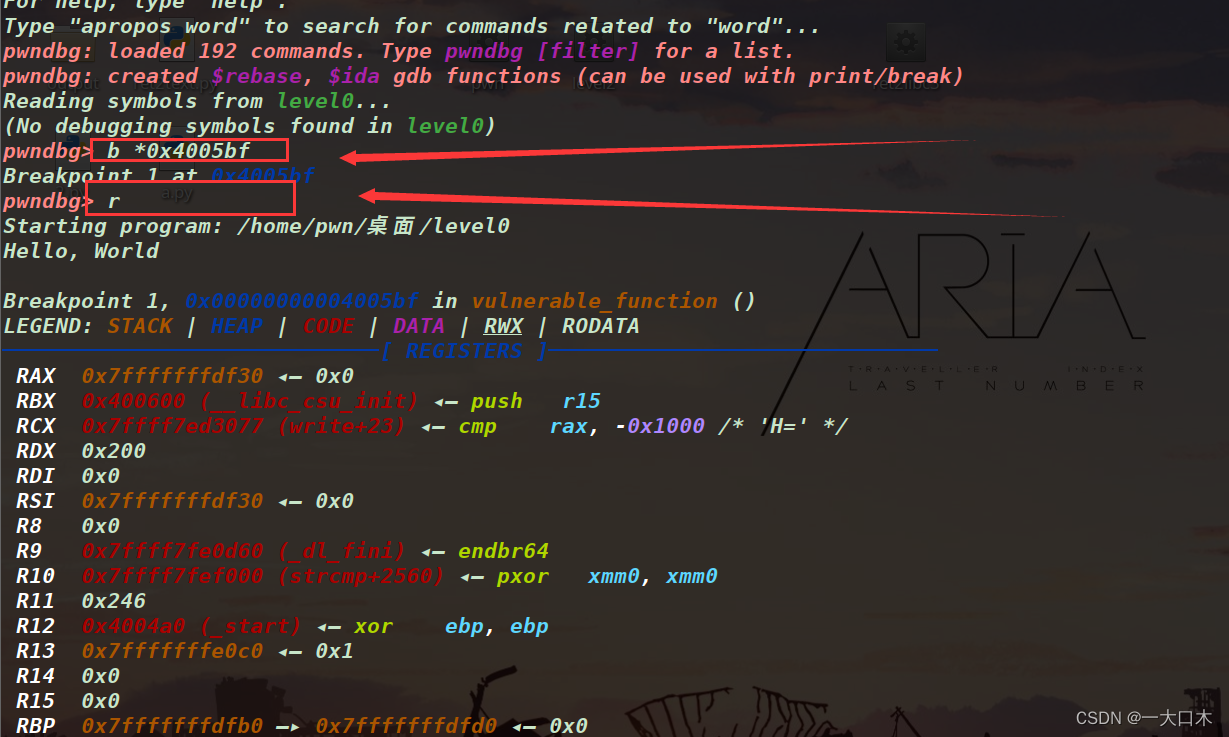
Then when we are at n, we are directly asked to enter things.

Find the stack and find the address 0x7fffffffdf30
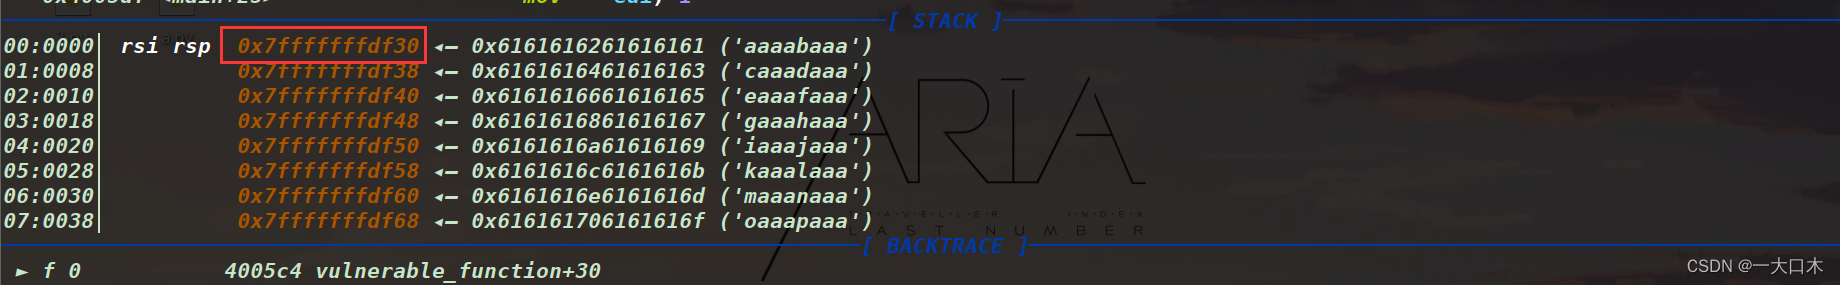
Then use cyclic
Or check it directly like this at that time
I didn’t succeed following the blogger, I’m in private Marseille, and I’m not good at learning.