Table of contents
(4) When xlrd reads the time and date, it will be of float type and needs to be converted.
(1) Numpy module installation---just use the Tsinghua University image to install it
(1)file----setting ---project---python interpret中
Edit (2) Select the python installation path in system interpret and add it.
(3) When importing numpy in the console, it will prompt ModuleNotFoundError: No module named 'numpy'
1. xlrd module
The xlrd module is divided into two steps: python installation and pycharm configuration.
(1) Install the xlrd module
Use windows + R to enter cmd to open **cmd** and enter
pip install xlrdPress the enter key to complete the installation. If you want to upgrade, just follow the prompts.

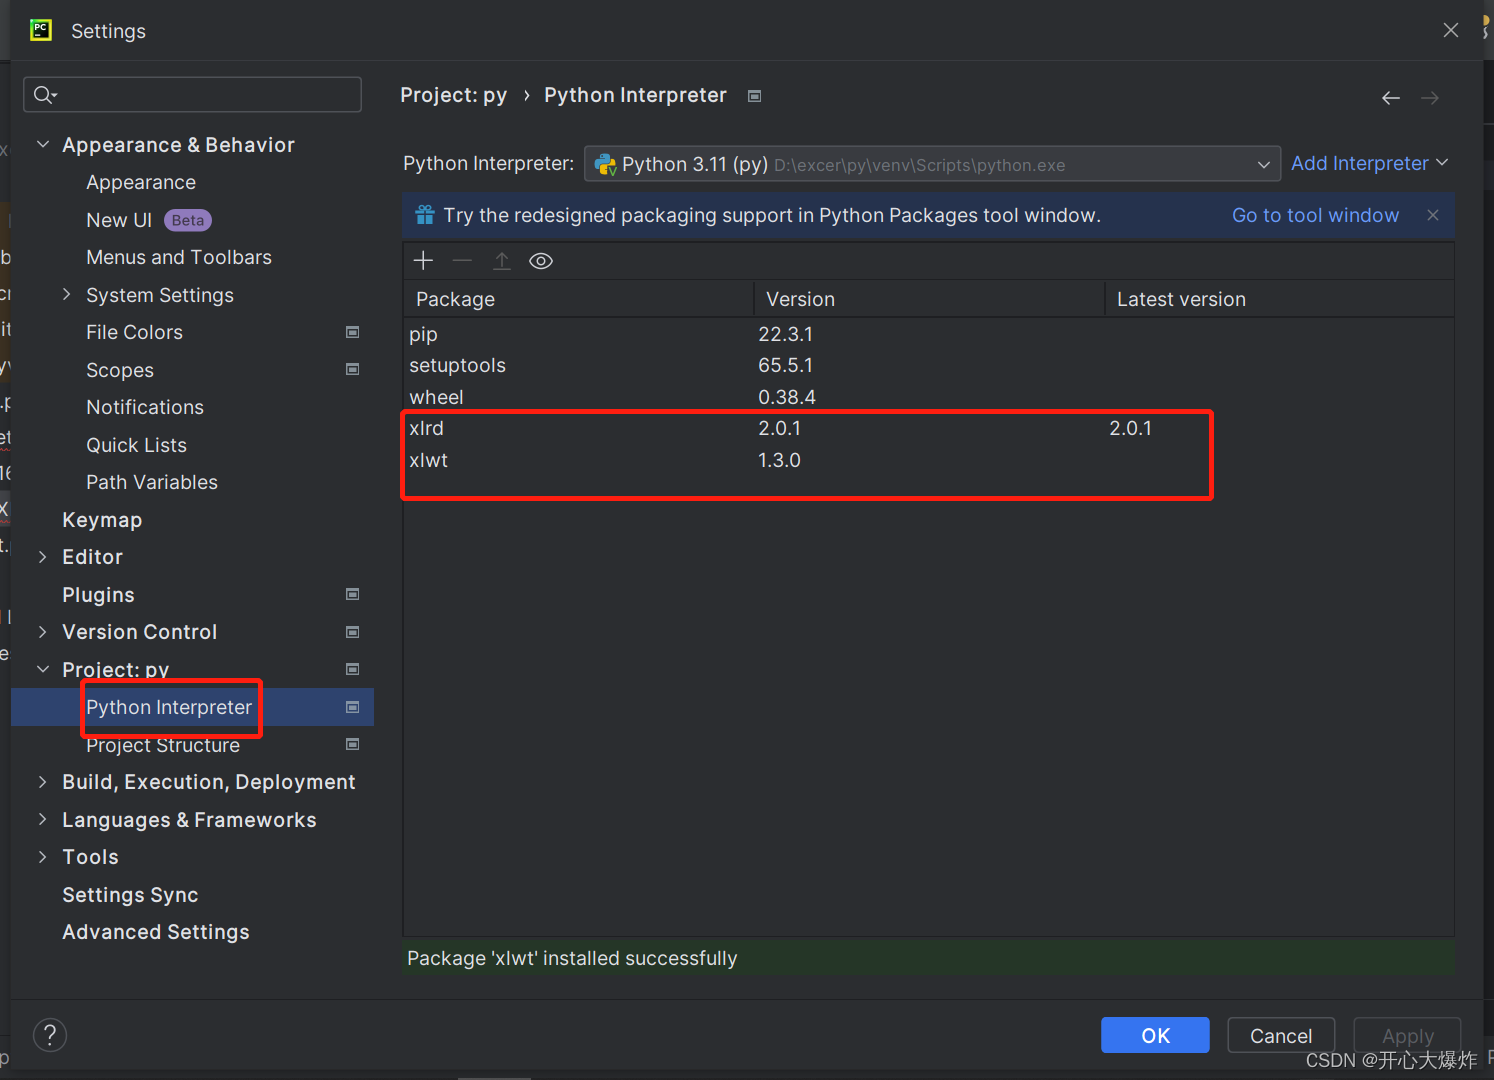
(2) pycharm configure xlrd
When the pycharm module imports the xlrd module, `import xlrd #import module`
will prompt `No module named 'xlrd'`, indicating that the module does not exist in pytcharm and needs to be configured. The configuration
path is: file----setting ---project--- python interpret
and then add + to add.

(3) Read xls format
The latest version of the xlrd module I installed does not support the xlsx format. It only supports xls and needs to be saved as xls.
(4) When xlrd reads the time and date, it will be of float type and needs to be converted.
##The data format is
10:39:49 len=1800 m_bMeasureStatus=0 2035 570.97561The following two statements convert the time format in row i and column 0 (sheet.cell_value(i, 0)) in the sheet to datetime or the corresponding string format
cell = xlrd.xldate_as_datetime(sheet.cell_value(i, 0), 0).strftime('%H:%M:%S') #这是string格式 cell = xlrd.xldate_as_datetime(sheet.cell_value(i, 0), 0)#这是datetime模式2. numpy module
(1) Numpy module installation---just use the Tsinghua University image to install it
Open cmd and enter pip install numpy, an error will be reported, as follows

Solution: Just use the image from Tsinghua University
pip install numpy scipy matplotlib -i https://pypi.tuna.tsinghua.edu.cn/simple(2) When pycharm is configured, the numpy installation fails, and No module named 'numpy' appears in the code
This is because the corresponding library is not installed in python. According to one (2), when configuring pycharam, the installation always fails.
Tried: Upgrade pip ---- no matter how to use
cmd -- when entering pip list, numpy is displayed.
**Solution:** Add system interpreter
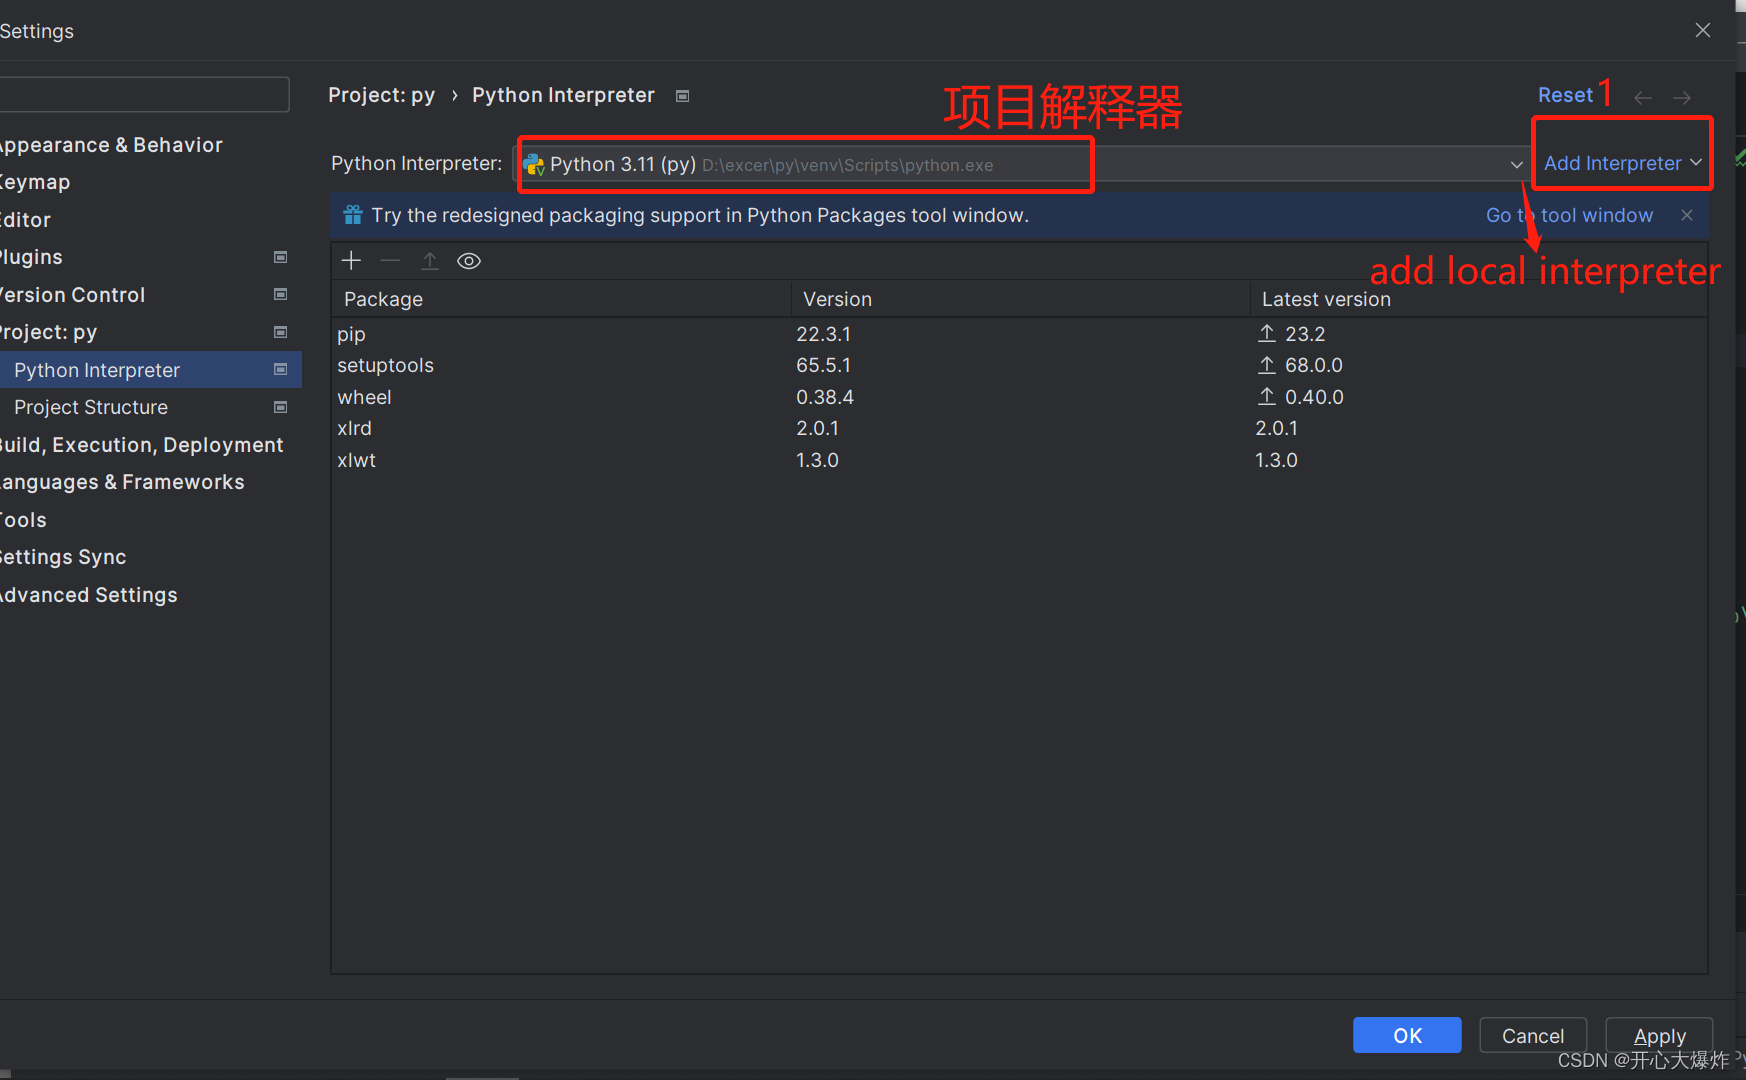
(1)file----setting ---project---python interpret中
The path in python interpret is the project path. Let's add a system path. At 1, select add local interpret in add interpret.
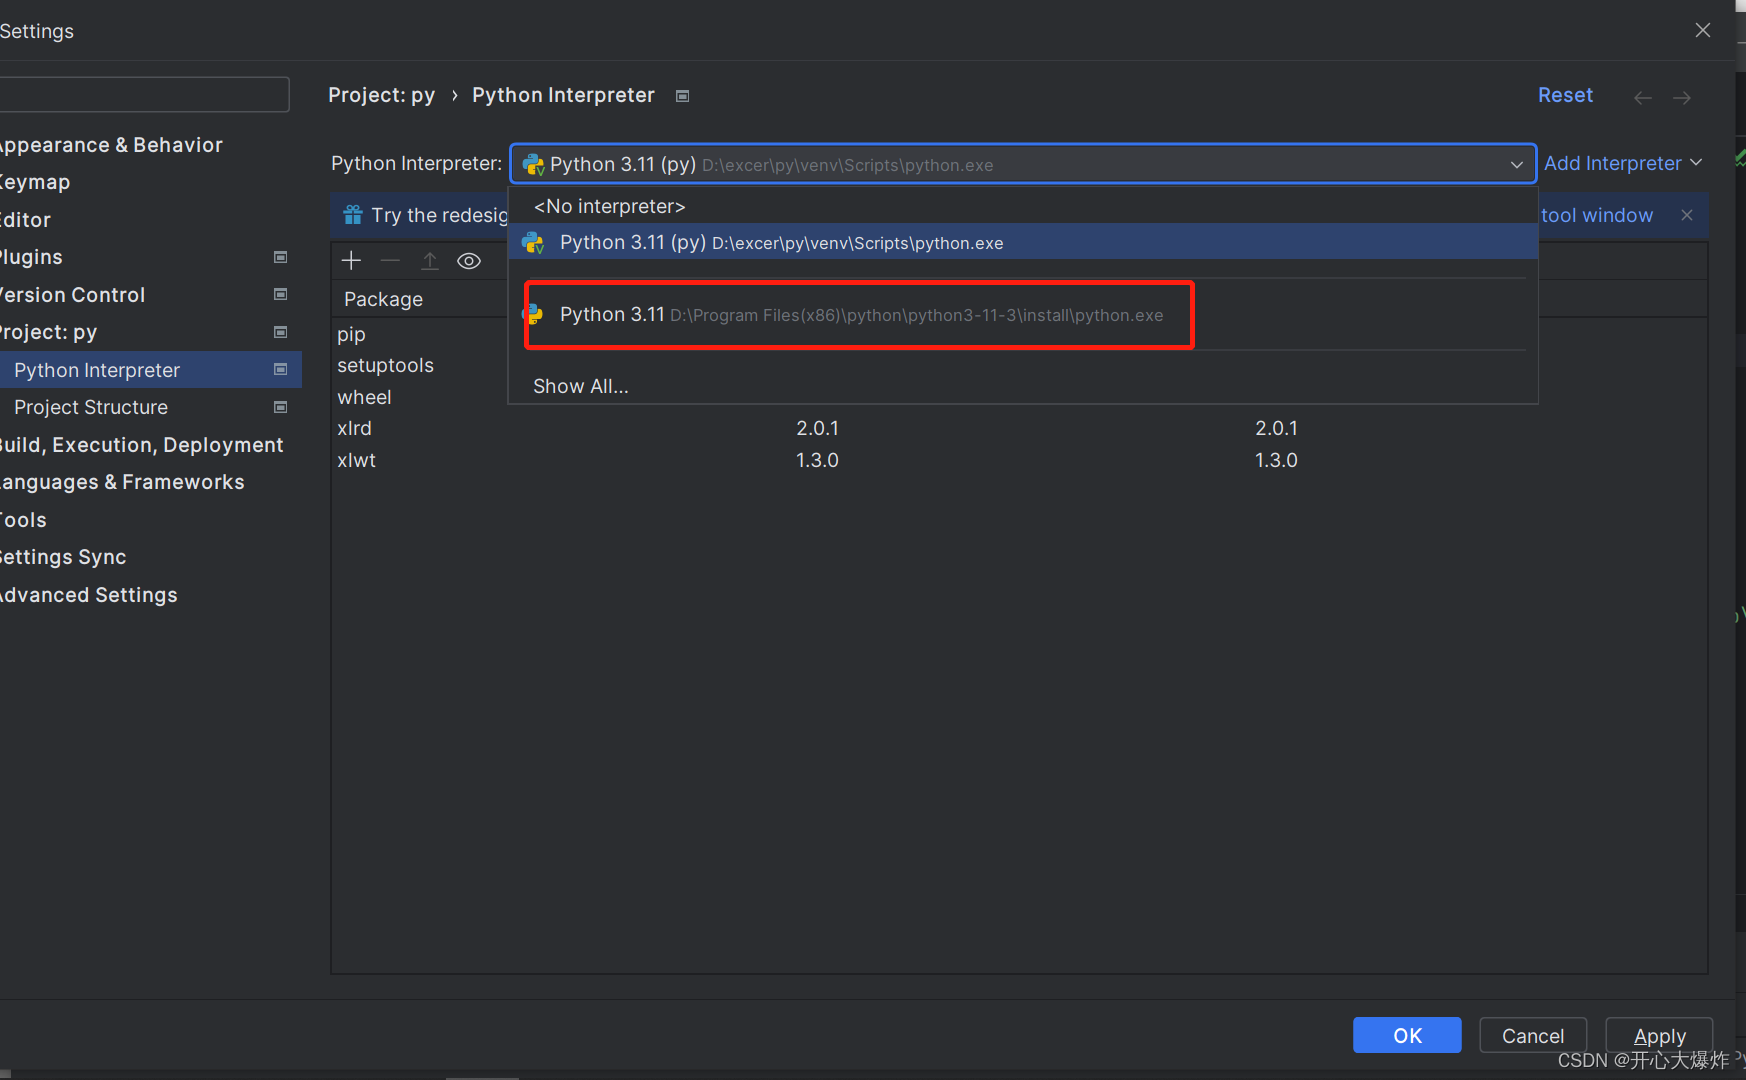
(2) Select the python installation path in system interpret and add it.

(3) Return to the interface, select the newly added system interpreter location, numpy is on the list, and there is no error message when importing numpy in the code.

(3) When importing numpy in the console, it will prompt ModuleNotFoundError: No module named 'numpy'
There is no exception in numpy in pycharm, but when importing numpy using python's console interface, it will prompt ModuleNotFoundError: No module named 'numpy'
3. opencv module
If you directly enter pip install opencv-python, an error will be reported. Customize the source below and download it using the source of Tsinghua University.
Enter the following in cmd:
pip install opencv-python -i https://pypi.tuna.tsinghua.edu.cn/simple/Use pip list to see that opencv is installed successfully.

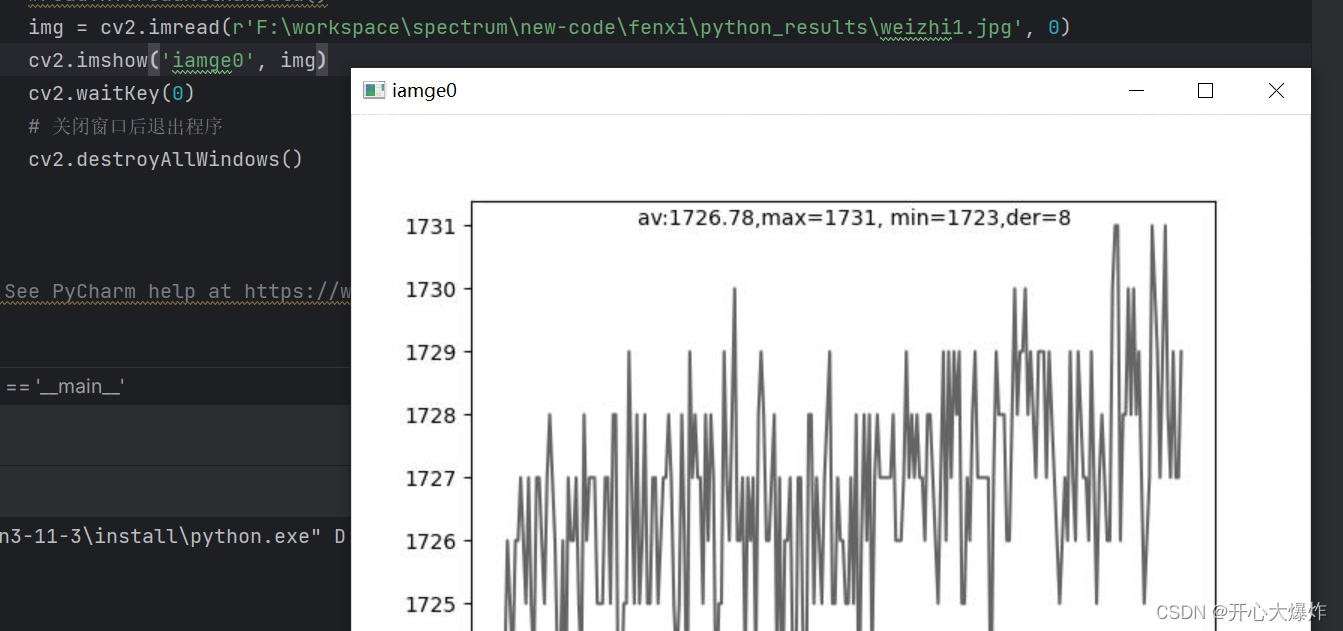
Test code:
    import cv2
    img = cv2.imread(r'F:\workspace\spectrum\new-code\fenxi\python_results\weizhi1.jpg', 0)
    cv2.imshow('iamge0', img)
    cv2.waitKey(0)
    # 关闭窗口后退出程序
    cv2.destroyAllWindows()
The running code is as follows:
4. Problems encountered during use
1. matplotlib---Chinese garbled problem
Modify the local font style and add the fontproperties attribute where Chinese characters need to be displayed .
    plt.xlabel("像元个数", fontproperties='SimHei') #解决了中文显示乱码的问题
    plt.ylabel('x1')
Four ways for matplotlib to display Chinese_matplotlib Chinese_QQVQQ...'s blog-CSDN blog  https://blog.csdn.net/hfy1237/article/details/128218567?ops_request_misc=&request_id=122f0db0a2f144b78a0fa8687c169a65&biz_id=&utm_ medium=distribute.pc_search_result. none-task-blog-2~blog~koosearch~default-2-128218567-null-null.268%5Ev1%5Econtrol&utm_term=python%20%E4%BD%BF%E7%94%A8matplotlib%E6%97%B6% 20%E4%B8%AD%E6%96%87%E4%B8%8D%E6%98%BE%E7%A4%BA&spm=1018.2226.3001.4450
2. Save the picture, savefig can be used before show
        plt.text(len(arrXPos)/3, np.max(arrXpos_np) , str_num)
        plt.plot(arrXPos)
        #savefig放在show前才行,要不然保存不了图片
        strFile =  r'F:\workspace\spectrum\new-code\fenxi\python_results\{0}.jpg'.format(sTempList[8])
        print(strFile)
        plt.savefig(strFile) #在show前才行
        plt.show()