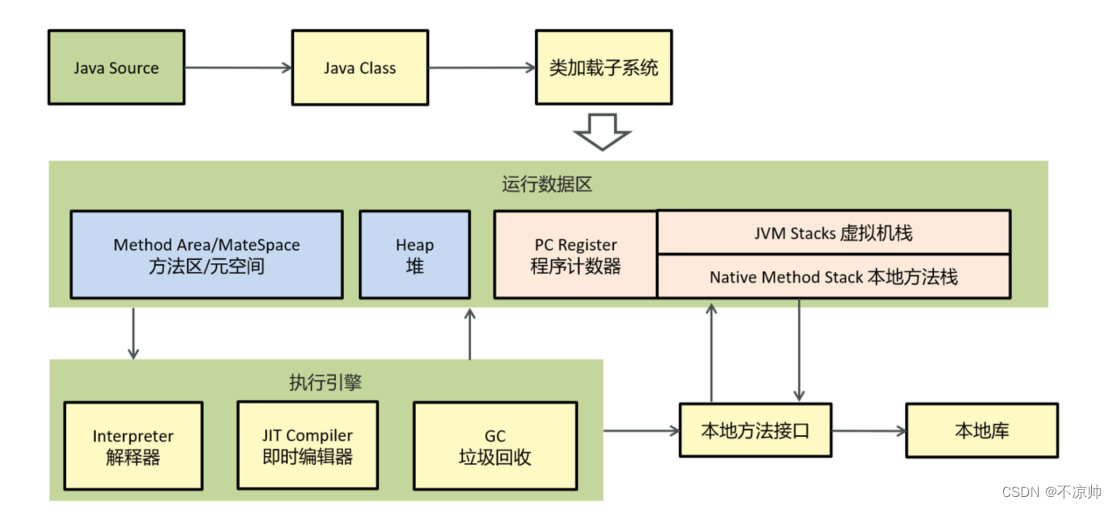
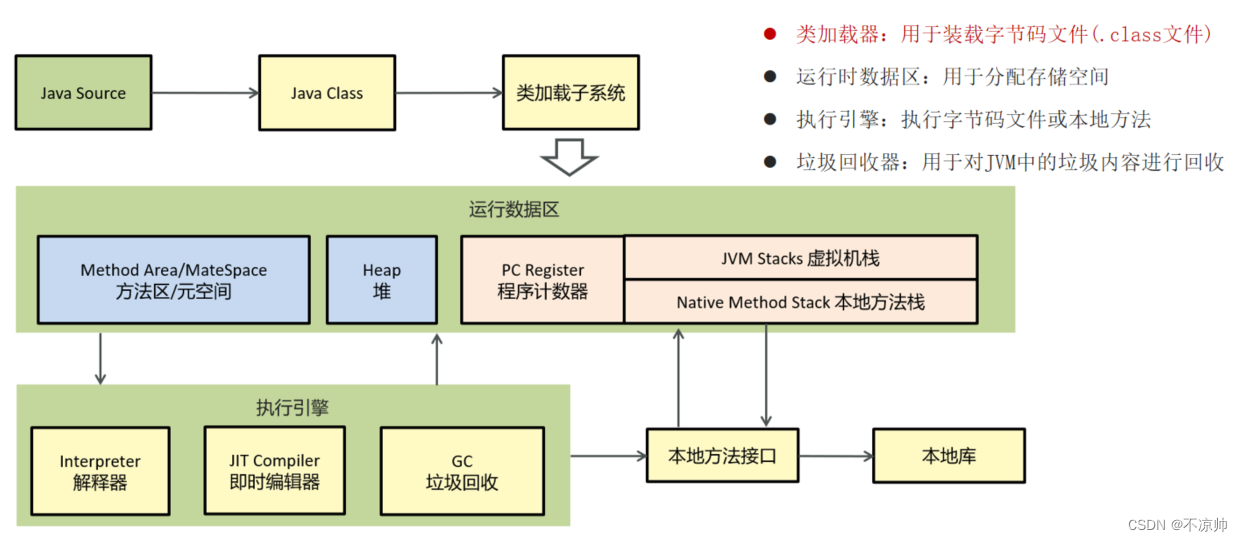
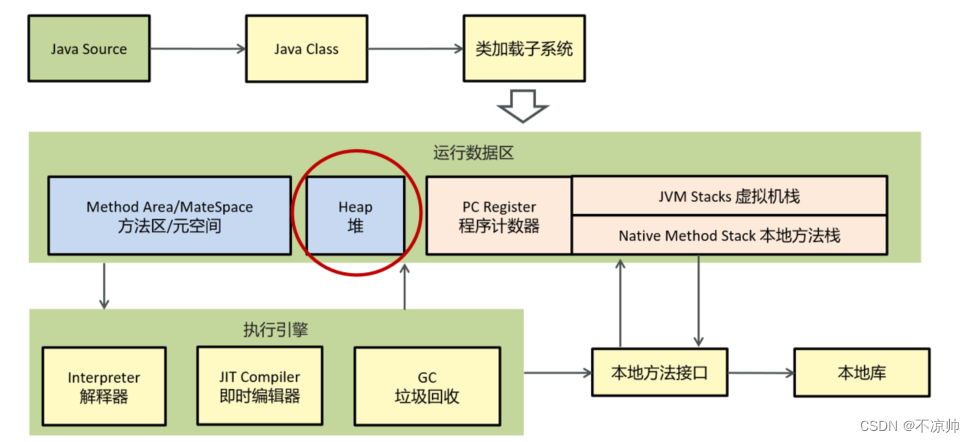
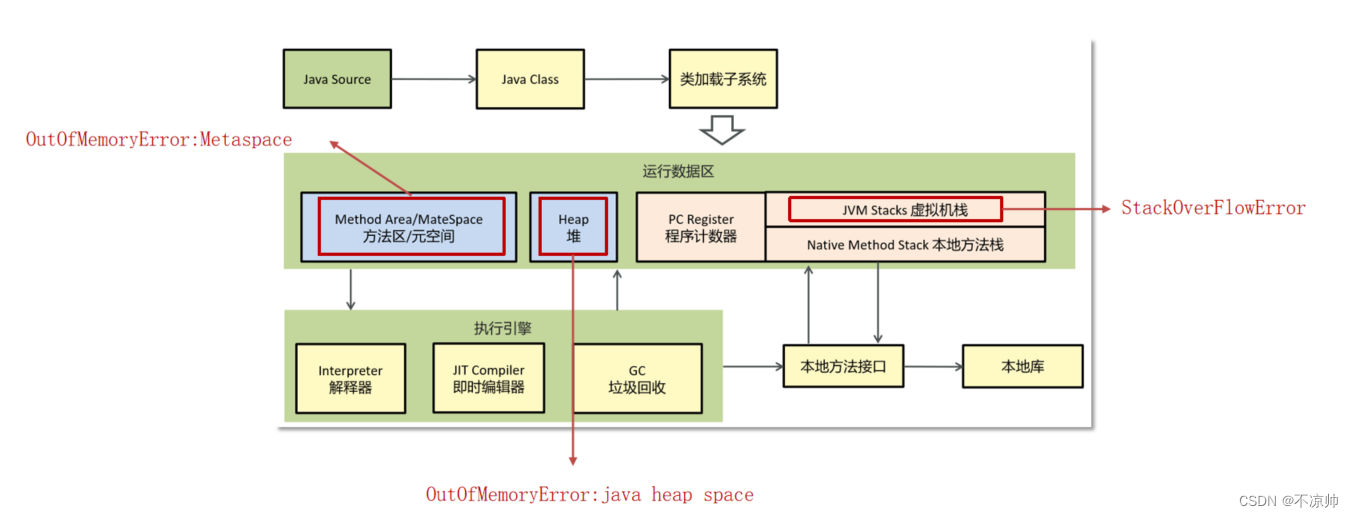
JVM (Java Virtual Machine) the running environment of Java programs (the running environment of java binary bytecode)
There are four parts in the JVM, namely ClassLoader (class loader), Runtime DataArea (runtime data area, memory partition), Execution Engine (execution engine), and Native Method Library (local library interface)
1. JVM basics
(1) Program counter
Program counter : Thread-private, internally saved bytecode line number. Used to record the address of the bytecode instruction being executed. The program counter records the line number of its last execution in the thread that switches back and forth, and then continues downward.
javap -v xx.class # 打印堆栈大小,局部变量的数量和方法的参数。(2) Heap memory
Thread-shared area : Mainly used to save object instances , arrays , etc. When there is no memory space in the heap to allocate to the instance and it cannot be expanded, an OutOfMemoryError exception is thrown.
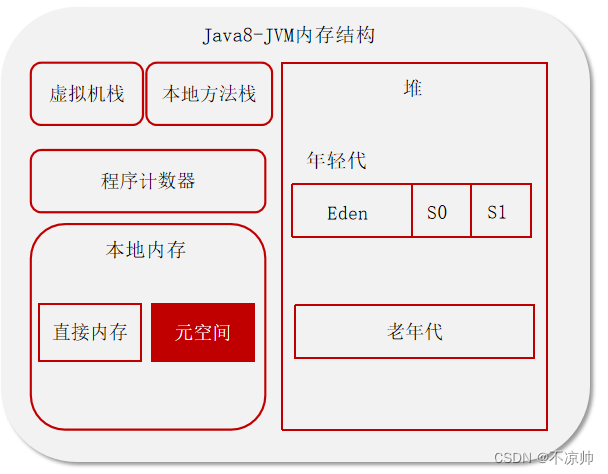
The composition of heap memory:
-
The young generation is divided into three parts, the Eden area and two Survivor areas that are strictly the same size.
-
The old generation mainly stores objects with long life cycles, usually some old objects.
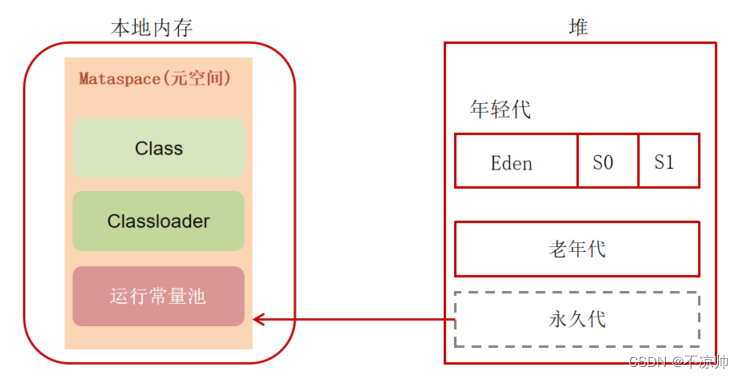
There is a permanent generation in 1.7, which stores class information, static variables, constants, and compiled code.
1.8 removed the permanent generation and stored data in the metaspace of local memory to prevent memory overflow.
(3) Virtual machine stack
Java Virtual machine Stacks ( java virtual machine stack )
-
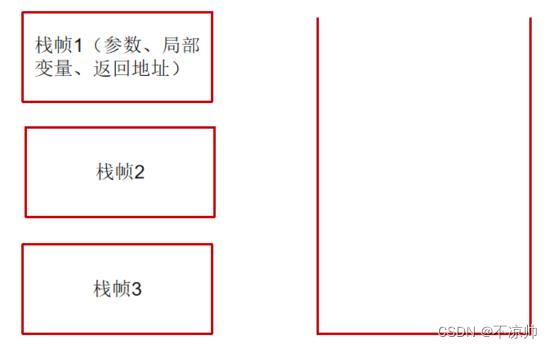
The memory required by each thread when running is called the virtual machine stack, first in, last out
-
Each stack is composed of multiple stack frames, corresponding to the memory occupied by each method call.
-
Each thread can only have one active stack frame, corresponding to the method currently being executed.
Does garbage collection involve stack memory?
Garbage collection mainly refers to heap memory. When the stack frame is popped from the stack, the memory will be released.
(4) Are local variables thread-safe?

-
If local variables within a method do not escape the scope of the method, it is thread-safe
-
If a local variable refers to an object and escapes the scope of the method, thread safety needs to be considered
(5) Stack memory overflow
Too many stack frames lead to stack memory overflow. Typical problem: recursive calls.
The stack frame is too large , causing stack memory to overflow.
(6) The difference between stacks
-
Stack memory is generally used to store local variables and method calls , but heap memory is used to store Java objects and arrays . The heap will be garbage collected, but the stack will not.
-
Stack memory is thread-private , while heap memory is shared by threads .
-
The exception errors between the two are different , but an exception will be thrown if there is insufficient stack memory or heap memory.
-
Insufficient stack space: java.lang.StackOverFlowError.
-
Insufficient heap space: java.lang.OutOfMemoryError.
-
(7) Method area
Method area :
-
Method Area is a memory area shared by each thread.
-
It mainly stores class information and runtime constant pool (can be regarded as a table. The virtual machine instructions find the class name, method name, parameter type, literal and other information to be executed based on this constant table). When the class is loaded, Its constant pool information will be put into the runtime constant pool, and the symbolic addresses inside will be changed into real addresses.
-
Created when the virtual machine starts and released when the virtual machine is shut down
-
If the memory in the method area cannot satisfy the allocation request, OutOfMemoryError: Metaspace will be thrown
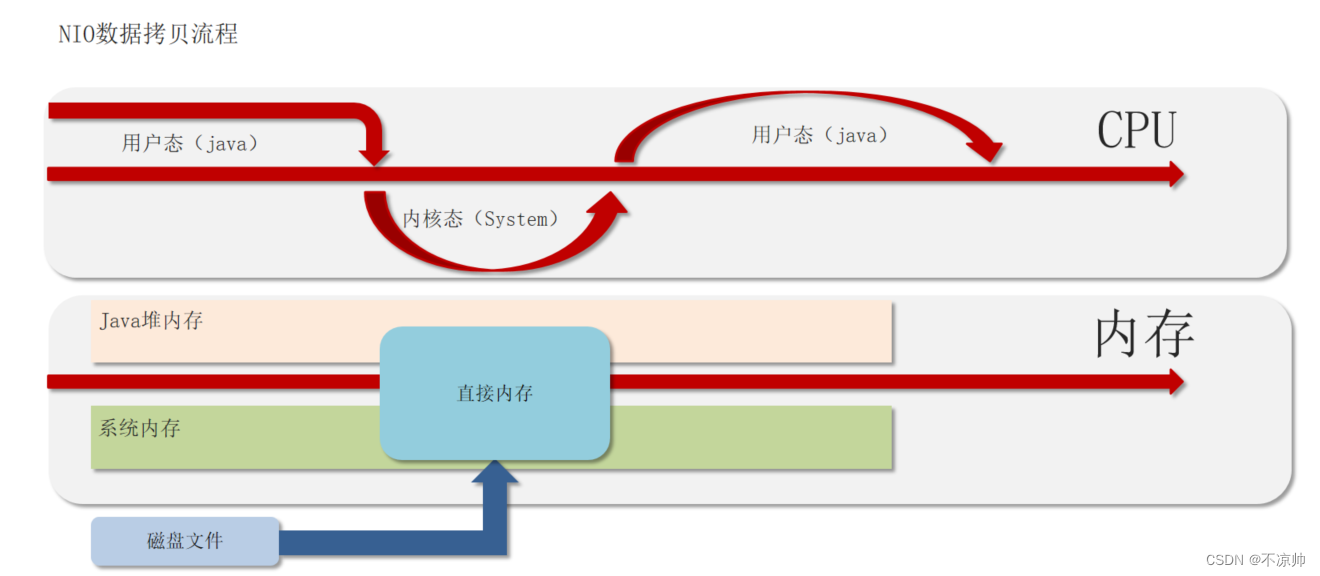
(8) Direct memory
Direct memory : does not belong to the memory structure in the JVM and is not managed by the JVM. It is the system memory of the virtual machine. It is commonly used for data buffers during NIO operations. Its allocation and recovery cost is high, but its read and write performance is high.
2. Class loader
(1) Types of class loaders
Class loader : The JVM will only run binary files. The function of the class loader is to load the bytecode files into the JVM so that the Java program can be started.
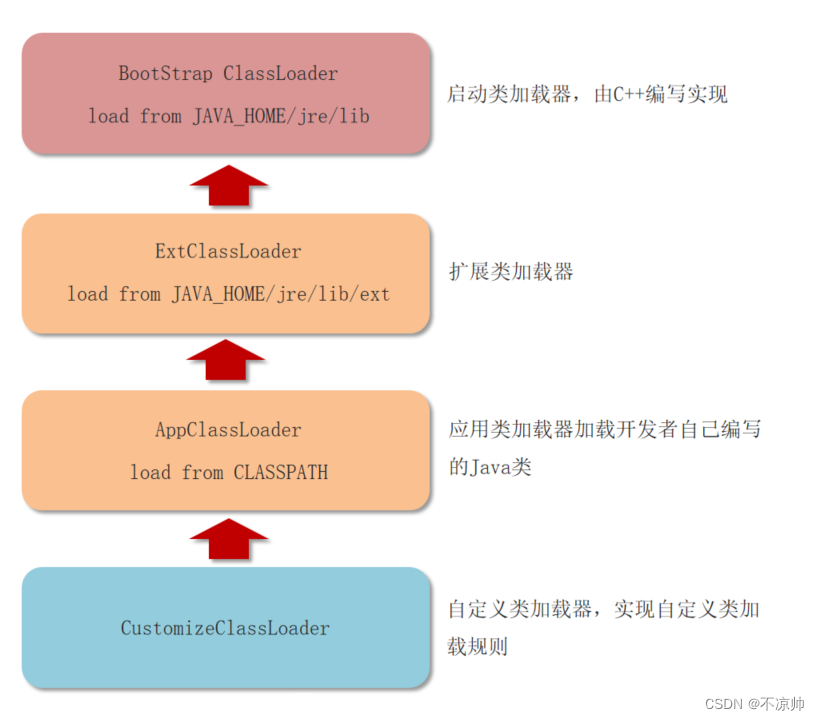
BootStrap ClassLoader : Load libraries in the JAVA_HOME/jre/lib directory
Extended class loader (ExtClassLoader): mainly loads classes in the JAVA_HOME/jre/lib/ext directory
Application class loader (AppClassLoader): used to load classes under classPath
Customized class loader (CustomizeClassLoader): Custom classes inherit ClassLoader and implement custom class loading rules.
(2) Parental delegation model
Parental delegation model : To load a certain class, first delegate it to the upper-level loader for loading. If the upper-level loader also has a superior, it will continue to delegate upwards. If the class delegated to the superior has not been loaded, the child loader will try to load the class.
The benefits of JVM adopting the parental delegation mechanism:
-
The parent delegation mechanism can prevent a certain class from being loaded repeatedly. When the parent class has been loaded, there is no need to load it again to ensure uniqueness.
-
For security reasons, ensure that the class library API will not be modified.
(3) Class loading
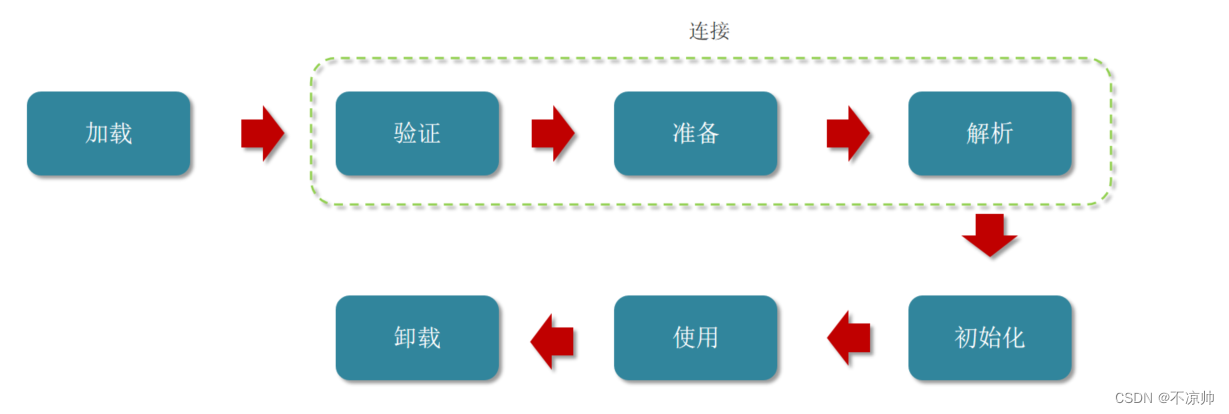
The execution process of class loading: From the time a class is loaded into the virtual machine until it is unloaded, its entire life cycle includes: loading, verification, preparation, parsing, initialization, use and unloading. Among them, the three parts of verification, preparation and parsing are collectively called linking.
-
Loading: Find and import class files
-
Verification: Ensure the accuracy of loaded classes
-
Preparation: Allocate memory for class variables and set initial values of class variables
-
Parsing: Convert symbol references in the class to direct references
-
Initialization: Perform initialization operations on static variables and static code blocks of the class
-
Usage: JVM starts executing the user's program code from the entry method
-
Uninstallation: When the user program code is executed, the JVM begins to destroy the created Class object.
3. Garbage collection
(1) Strong reference, soft reference, weak reference, virtual object
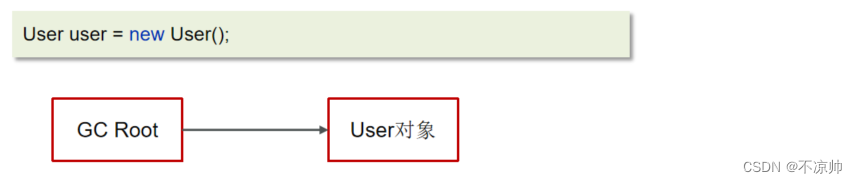
Strong reference : This is the most common type of reference. Even when there is insufficient memory space, the JVM would rather throw an OutOfMemory error than recycle such an object. Only when all GC Roots objects do not reference the object through [strong references] can the object be garbage collected.
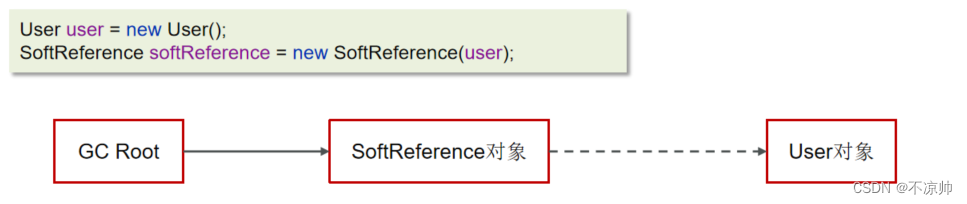
Soft reference : Soft reference is to enhance memory flexibility. Soft references are used to describe objects that may be useful but are not necessary. For objects associated with soft references, these objects will be included in the recycling scope for the second recycling before a memory overflow exception occurs in the system. If there is not enough memory for this recycling, a memory overflow exception will be thrown. When only soft references refer to the object, garbage collection will start again when the memory is still insufficient after garbage collection.
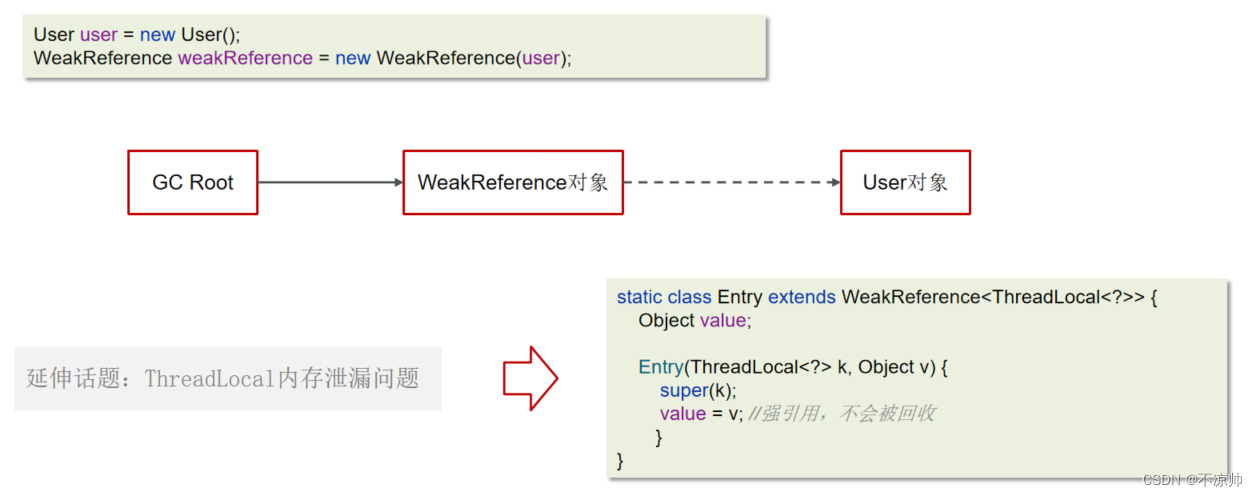
Weak reference : Weak reference is also used to describe non-essential objects, but its strength is weaker than soft reference. Regardless of whether the current system memory space is sufficient or not, as long as the garbage collection mechanism is running, objects associated with weak references will definitely be recycled. When only weak references refer to the object, during garbage collection, the weak reference objects will be recycled regardless of whether the memory is sufficient.
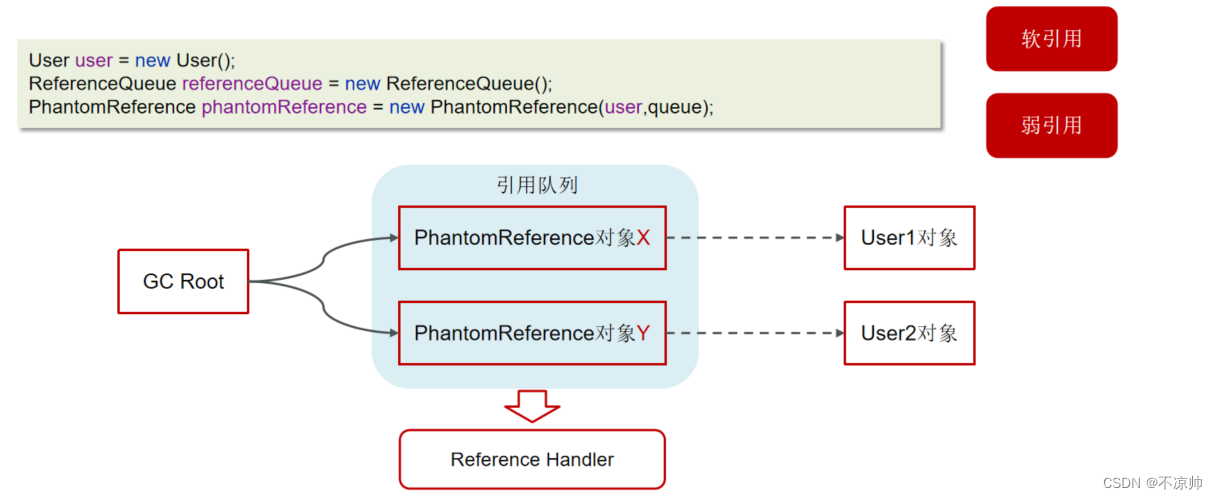
Virtual reference : Virtual reference is the weakest kind of reference relationship. Whether an object has a virtual reference has no impact on its lifetime, and it is impossible to obtain an object instance through a virtual reference. The only use is to receive a system notification when this object is recycled by the collector. It must be used in conjunction with the reference queue. When the referenced object is recycled, the virtual reference will be enqueued, and the Reference Handler thread will call the virtual reference related method to release the direct memory.
(2) Garbage collection timing
A simple sentence is: if one or more objects have no references pointing to it, then the object is now garbage . If the garbage is located, it may be recycled by the garbage collector. If you want to locate what is garbage, there are two ways to determine it. The first is the reference counting method , and the second is the reachability analysis algorithm.
(3) JVM garbage location algorithm
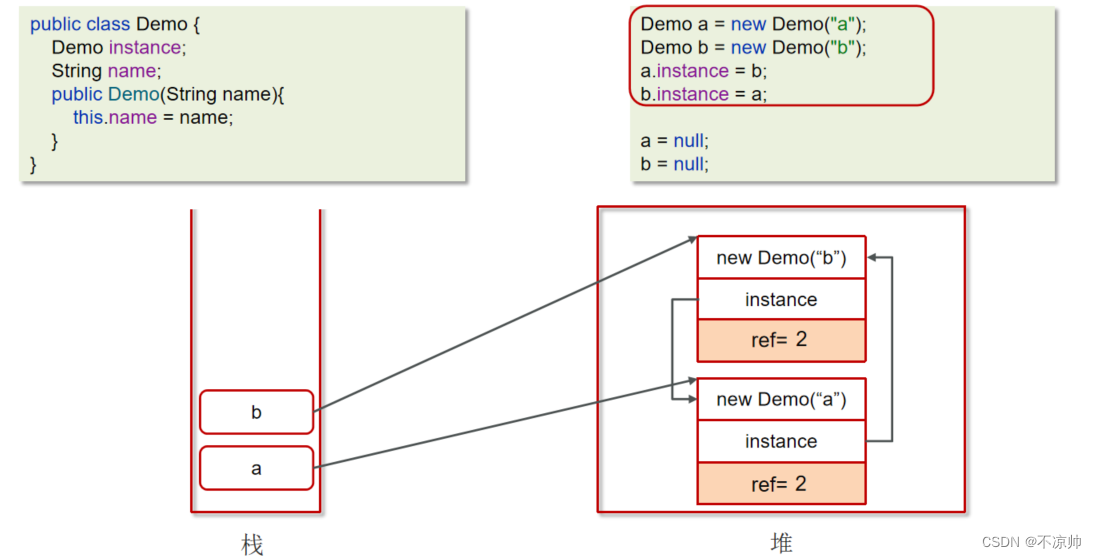
Reference counting method : An object is referenced once, and the number of references is incremented on the current object head. If the number of references to this object is 0, it means that the object can be recycled.

When a circular reference occurs between objects, the reference counting method will fail.
Reachability analysis algorithm : Today’s virtual machines use reachability analysis algorithms to determine which content is garbage.
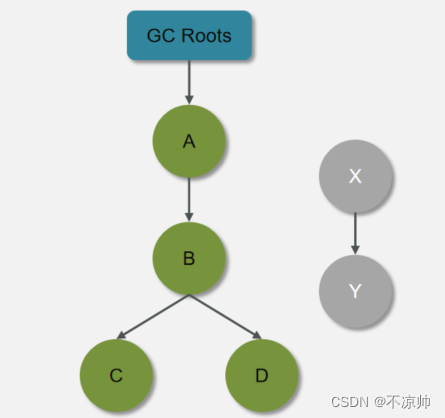
The two nodes X and Y are recyclable. The garbage collector in the Java virtual machine uses reachability analysis to explore all surviving objects and scan the objects in the heap to see if the object can be found along the reference chain starting from the GC Root object. If it cannot be found, it means it can be recycled.
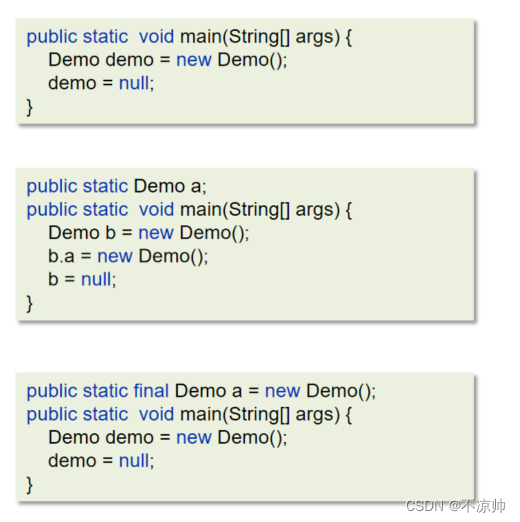
What objects can be used as GC Root ?
-
Objects referenced in the virtual machine stack (local variable table in stack frame)
-
The object referenced by the class static property in the method area
-
Objects referenced by constants in the method area
-
Object referenced by JNI (generally speaking Native method) in the local method stack
(4) JVM garbage collection algorithm
Mark and clear algorithm : It divides garbage collection into two stages, namely marking and clearing.
-
Mark garbage based on reachability analysis algorithm
-
Garbage collection of content marked as recyclable
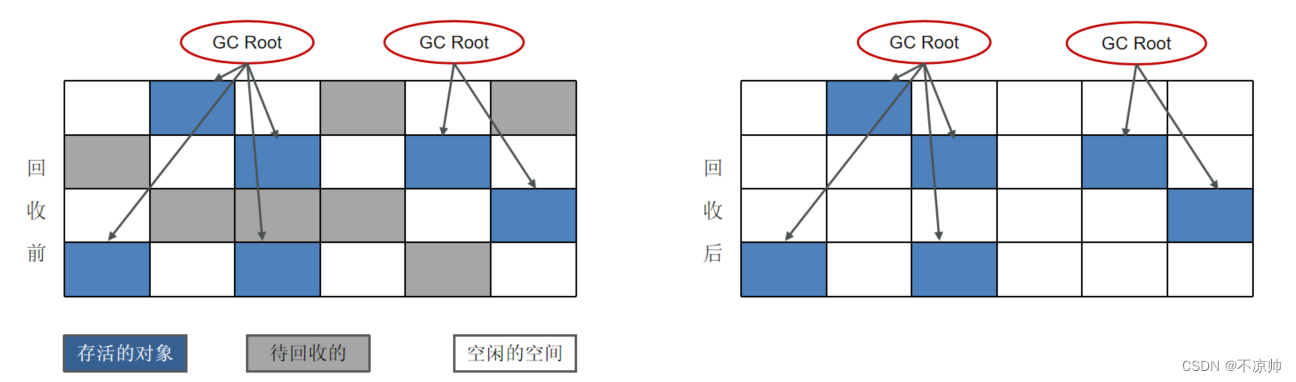
Advantages: Faster marking and clearing
Disadvantages: Severe fragmentation and incoherent memory
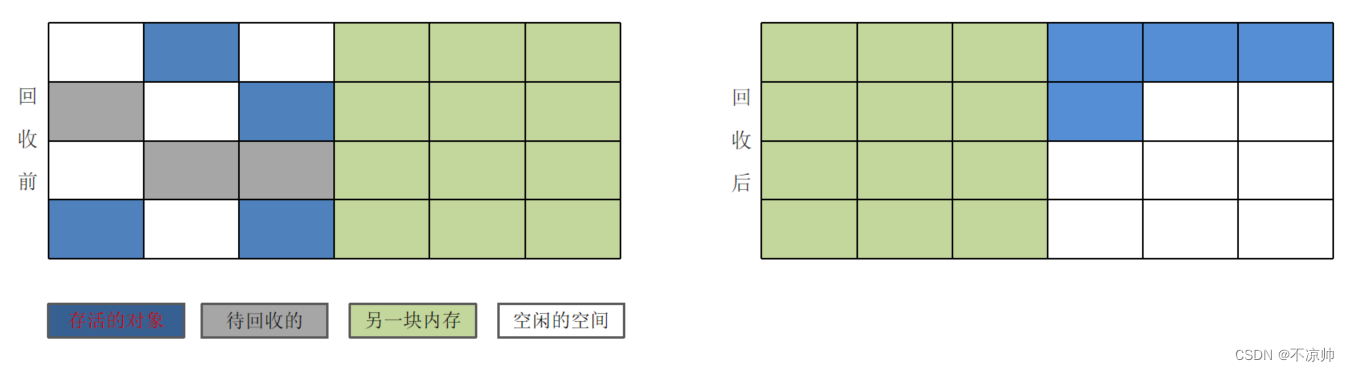
Copy algorithm : Divide the original memory space into two, use only one piece at a time, copy the object being used to another memory space, then clear the memory space, exchange the roles of the two memories, and complete the garbage recycling; no fragmentation, low memory usage
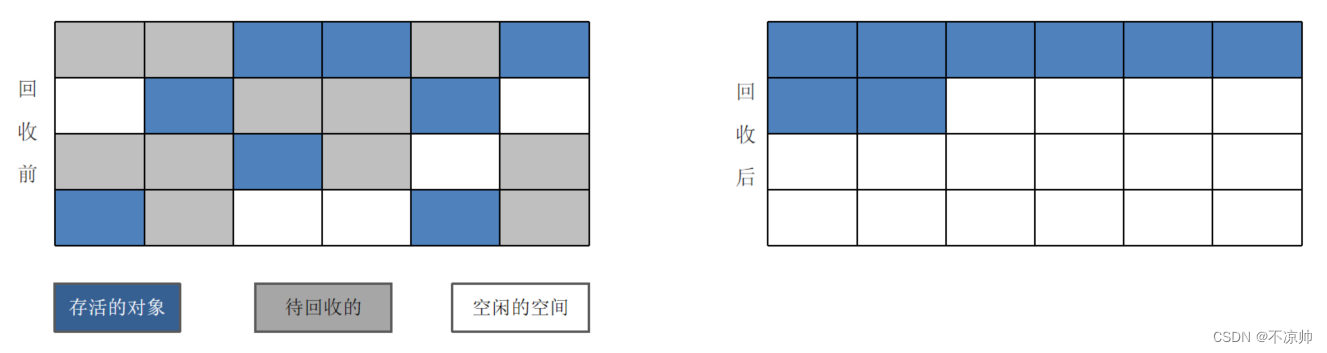
Mark and sorting algorithm : The same as the mark and clear algorithm, all surviving objects are moved to the other end of the memory, and then the garbage outside the boundary is cleaned up. There is no fragmentation. The objects need to be moved, which is inefficient.
(5) JVM generational recycling
1. Area division of heap
-
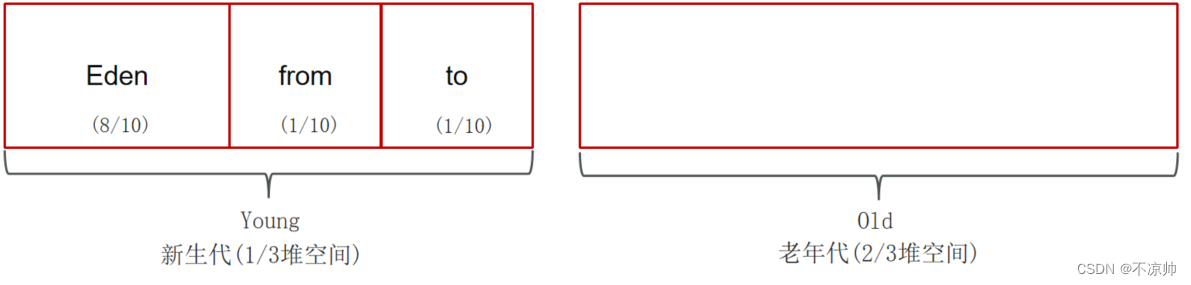
The heap is divided into two parts: the new generation and the old generation [1:2]
-
For the new generation, the interior is divided into three areas. Eden area, survivor area (divided into from and to) [8:1:1]
2. Object recycling generational recycling strategy
-
Newly created objects will be allocated to the eden area first.
-
When eden is out of memory, mark the surviving objects of eden and from (not available at this stage)
-
Copy the surviving object to to using the copy algorithm. After the copy is completed, both eden and from memory are released.
-
After a period of time, the memory of eden becomes insufficient again. Mark the surviving objects in the to area of eden and copy them to the from area.
-
When the survivor area object survives several collections (up to 15 times), it is promoted to the old generation (the survivor area has insufficient memory or large objects will be promoted early)
What is the difference between MinorGC, Mixed GC and FullGC?
-
MinorGC [young GC] garbage collection occurs in the new generation, with short pause time (STW)
-
Mixed GC New Generation + Garbage collection in some areas of the Old Generation, unique to the G1 collector
-
FullGC: New generation + complete garbage collection of the old generation, long pause time (STW), should be avoided as much as possible
(6) Types of garbage collectors
In the JVM, a variety of garbage collectors are implemented, including:
-
serial garbage collector
Serial and Serial Old serial garbage collector refers to the use of a single thread for garbage collection. The heap memory is small and suitable for personal computers. Serial acts on the new generation and uses a copy algorithm

Serial Old acts on the old generation. When using the mark-and-sort algorithm for garbage collection, only one thread is working, and all threads in the Java application must be paused (STW) to wait for the completion of garbage collection.
-
Parallel garbage collector
Parallel New and Parallel Old are a parallel garbage collector. JDK8 uses this garbage collector by default.
Parallel New acts on the new generation and uses a replication algorithm . Parallel Old acts on the old age and uses a mark sorting algorithm.
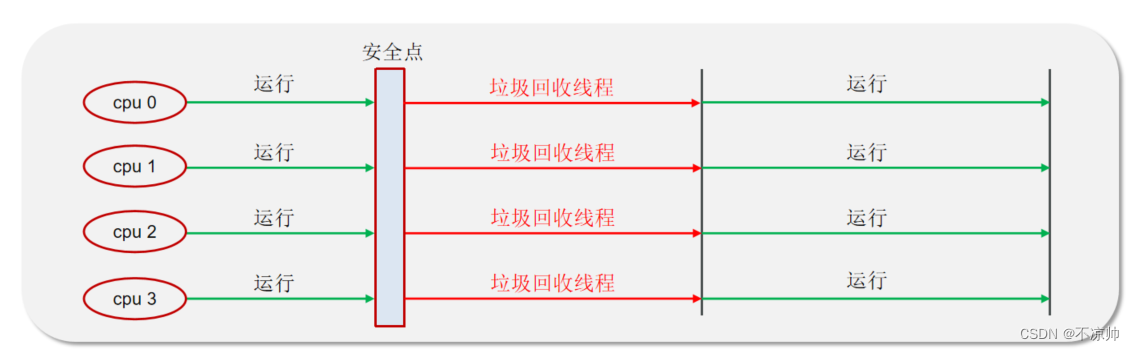
During garbage collection, multiple threads are working, and all threads in the Java application must be paused (STW) to wait for the completion of garbage collection.
-
CMS (concurrent) garbage collector
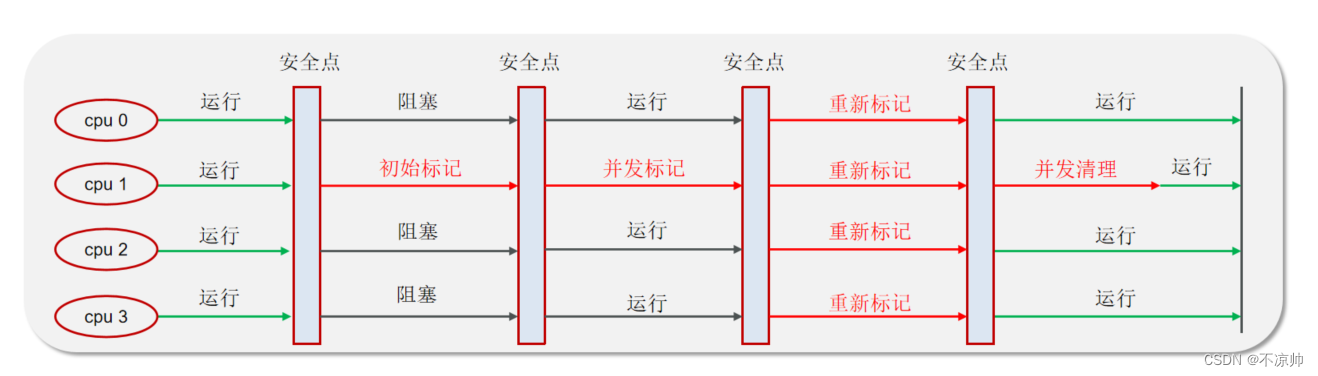
The full name of CMS is Concurrent Mark Sweep. It is a concurrent garbage collector that uses mark removal algorithm. This collector is aimed at old generation garbage collection. It is a collector that aims to obtain the shortest recovery pause time and has short pause time . , the user experience is good. Its biggest feature is that the application can still run normally during garbage collection.
-
G1 garbage collector
The G1 garbage collector works in the new generation and the old generation. It is applied to the new generation and the old generation. G1 is used by default after JDK9.
(7) G1 garbage collector
-
Applied to the new generation and old generation, G1 is used by default after JDK9
-
Divided into multiple areas, each area can serve as eden, survivor, old, humongous, among which humongous is specially prepared for large objects.
-
Use replication algorithm
-
Balance response time and throughput
-
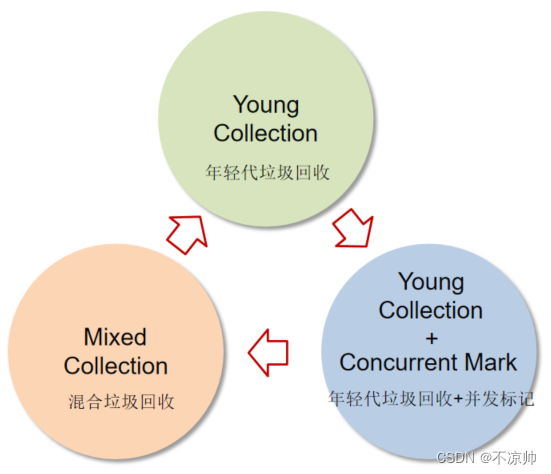
Divided into three stages: new generation collection, concurrent marking, and mixed collection
-
If concurrency fails (that is, the recycling speed cannot keep up with the speed of creating new objects), Full GC will be triggered.
4. JVM practice
(1) JVM tuning parameters
Where can JVM tuning parameters be set?
1. The war package is deployed and set in tomcat
Modify the TOMCAT_HOME/bin/catalina.sh file

2. The jar package is deployed in the startup parameter settings
Usually, under the Linux system, you directly add parameters to start the springboot project.
nohup java -Xms512m -Xmx1024m -jar xxxx.jar --spring.profiles.active=prod &nohup: used to run commands in the background of the system without hanging up. Exiting the terminal will not affect the running parameters of the program.
&: Let the command be executed in the background. The command will still be executed after the terminal exits.
For JVM tuning, it mainly involves adjusting the memory space size of the young generation, old generation, and metaspace and the type of garbage collector used.
-
Set heap space size
-
Virtual machine stack settings
-
The size ratio of the Eden area and the two Survivor areas in the young generation
-
Threshold for promotion of young generation to old generation
-
Set up garbage collection collector
(2) Tuning tools
command tool
-
jps process status information
-
jstack View the stack information of threads in the java process
-
jmap View heap transfer information
-
jhat heap dump snapshot analysis tool
-
jstat JVM statistics monitoring tool
Visualization tools
-
jconsole is used to monitor jvm memory, threads, and classes
-
VisualVM can monitor threads and memory conditions
(3) Memory leak
Memory leaks usually refer to heap memory, usually when some large objects are not recycled.
Troubleshooting ideas for Java memory leaks :
-
Get heap memory snapshot dump
-
VisualVM to analyze the dump file
-
Locate memory overflow problems by checking heap information
Troubleshooting ideas:
-
Obtain heap memory snapshot dump through jmap or setting jvm parameters
-
Through tools, VisualVM analyzes dump files, and VisualVM can load offline dump files.
-
By checking the heap information, you can roughly locate which line of code caused the memory overflow problem.
-
Find the corresponding code and fix it by reading the context.
(4) CPU surge troubleshooting solutions and ideas
1. Use the top command to check the CPU usage
Enter the command: top
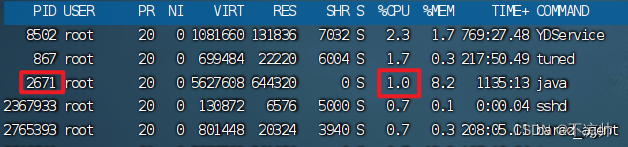
2. After checking through the top command, you can check which process occupies a higher CPU (the picture above is 2671)
3. Use the ps command to view thread information in the process
ps H -eo pid,tid,%cpu | grep 26714. Use the jstack command to check which threads in the process have problems and finally locate the problem.