How to check the resource usage of each module of Vivado
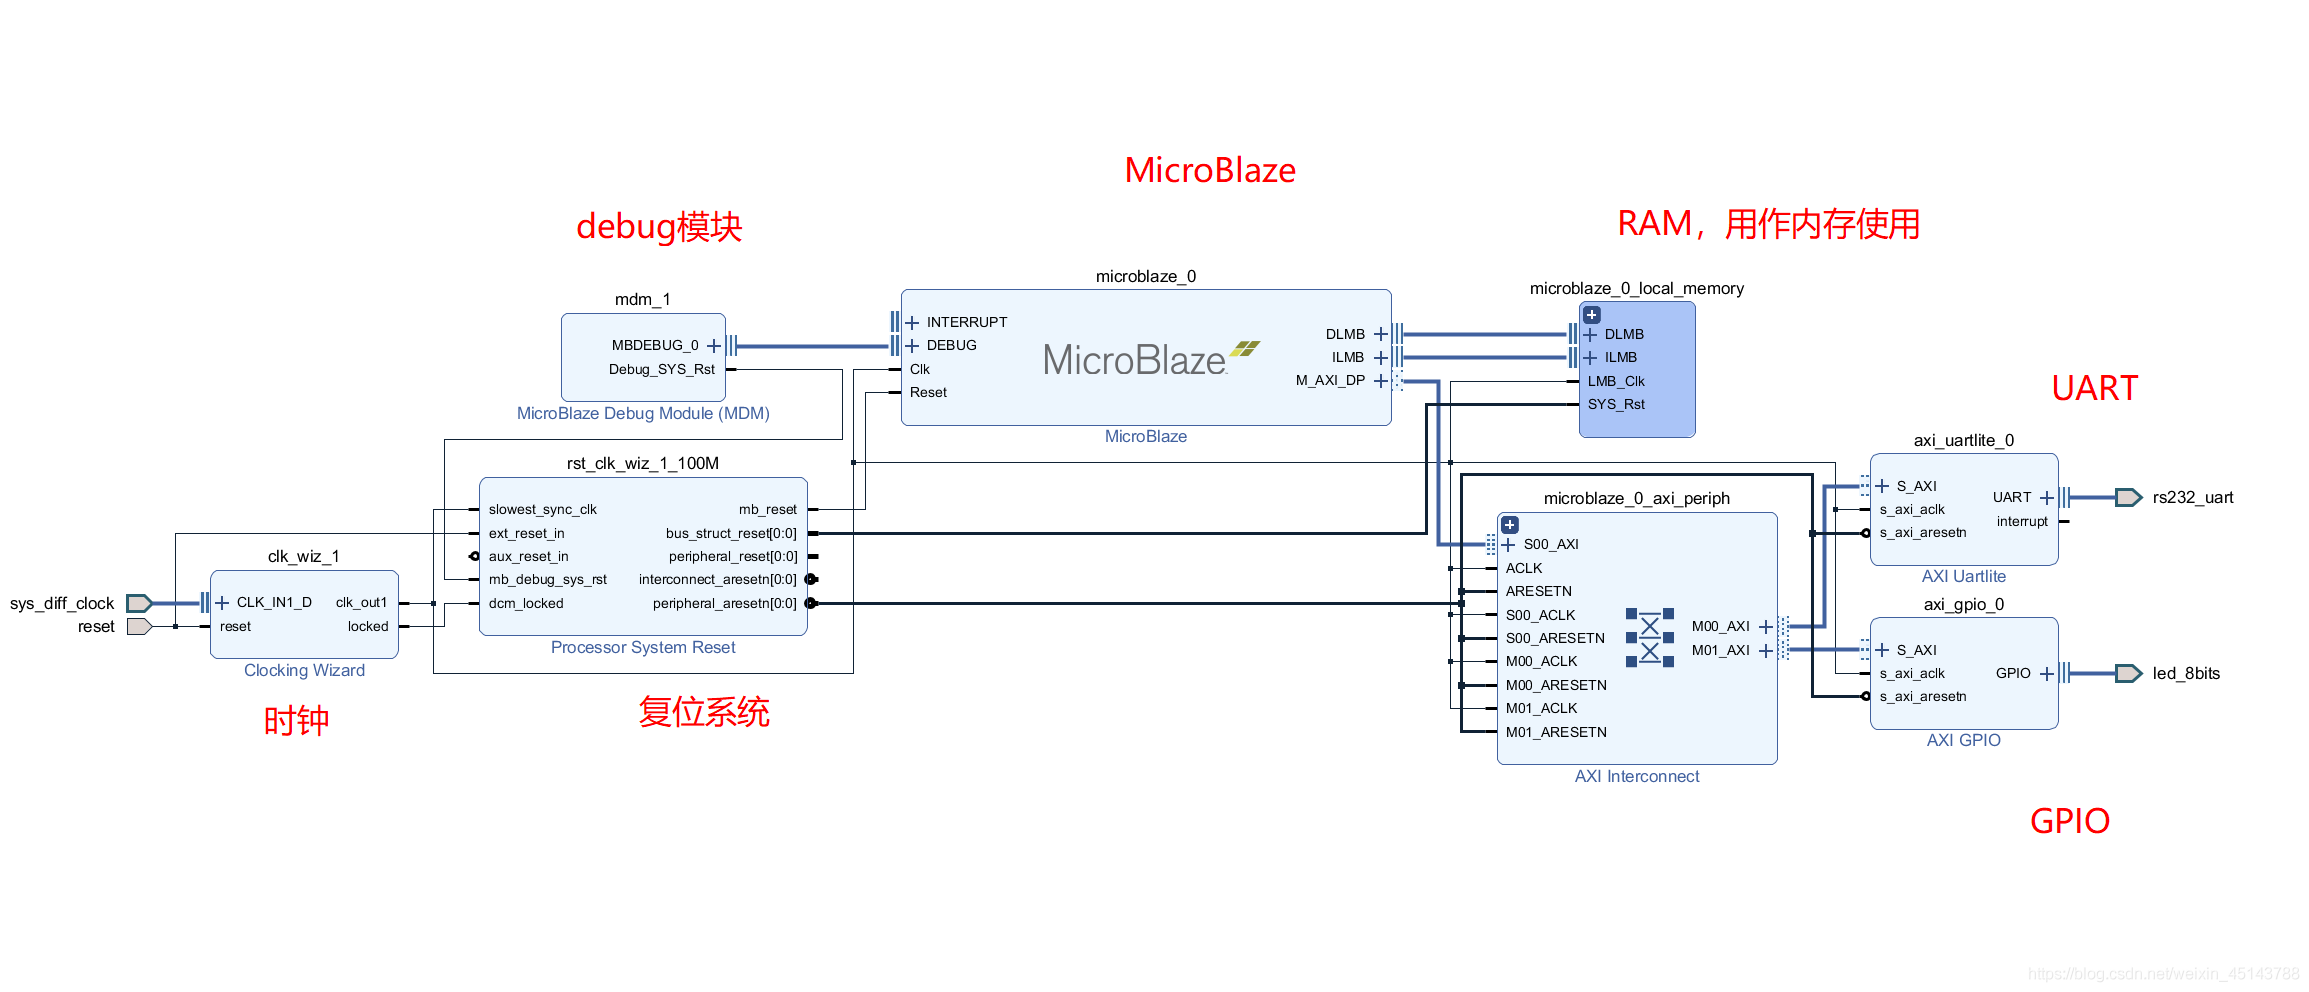
In vivado, how to check the resource usage of each module? Methods as below. Take the microblaze soft-core processor routine on the xilinx official evaluation board VC709 as an example. The project is composed of modules as shown below.
After completing Implementation, click Open Implemented Design in IMPLMENTATION under Flow Navigator, and then select Report Utilization.

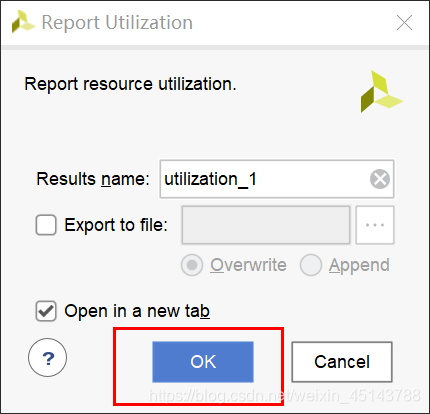
After that, the resource report window will pop up automatically. Use the default configuration and click OK.
Select a certain type of resource in the generated results, and you will see the resource usage arranged by module. bIncludes cases shown by number or percentage.
It is equivalent to running the following Tcl command in the Tcl Console:
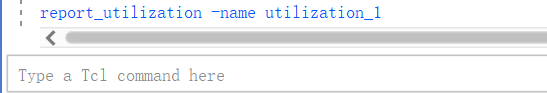
the running results are as follows.
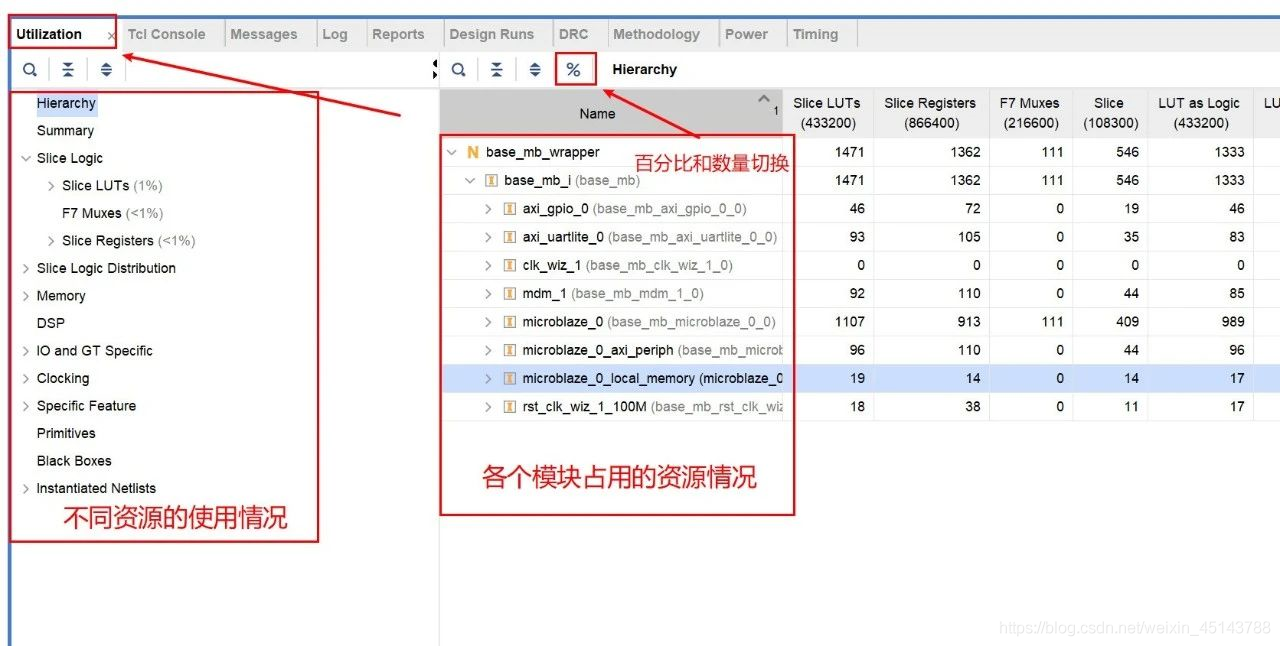
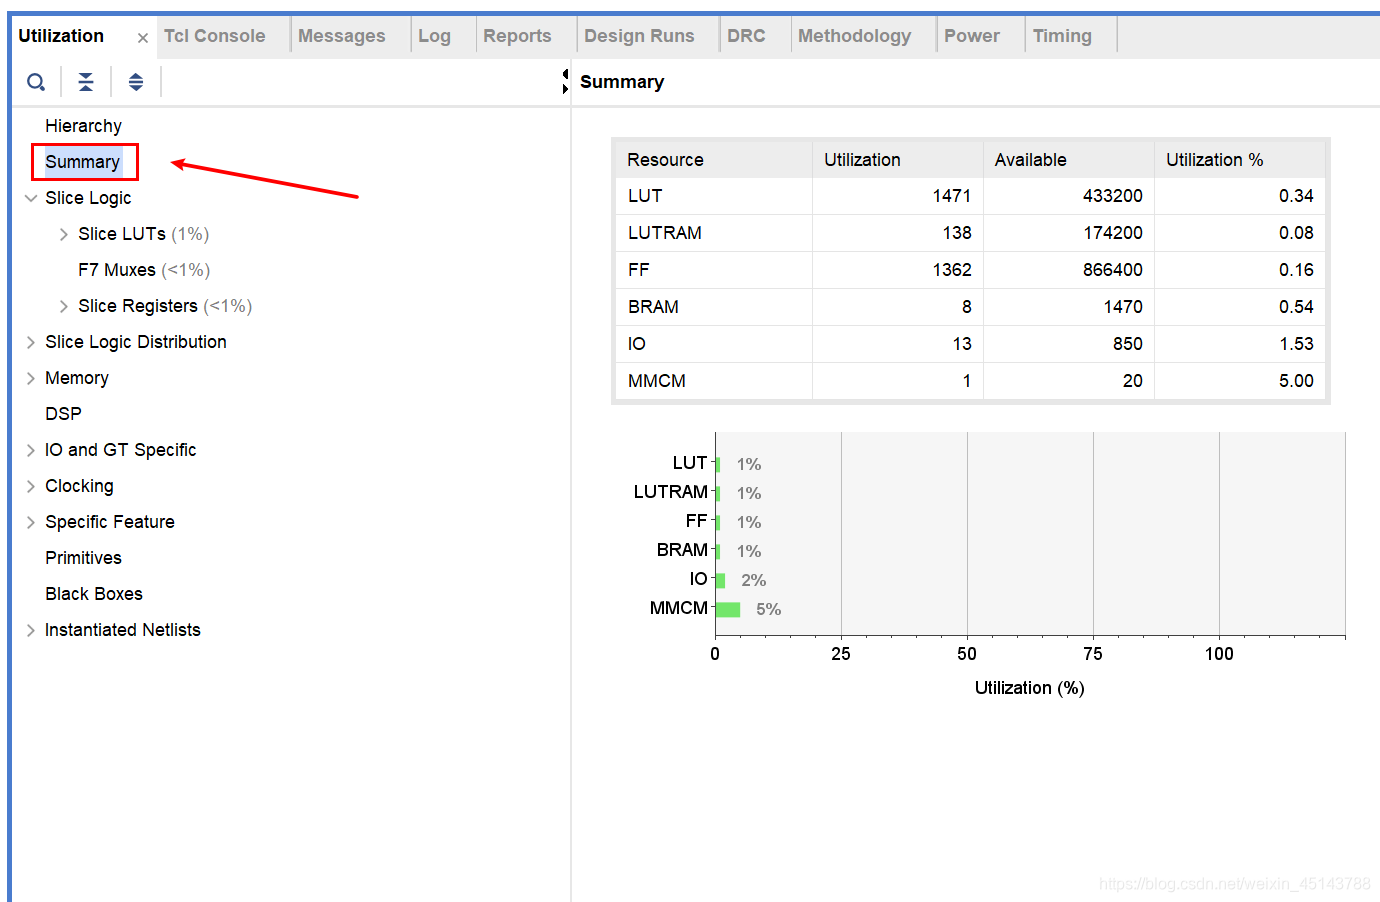
You can see the usage of different resources on the left side of the window.
In the right window, you can see the resource usage of each module. Amount and percentage can be switched in the toolbar. See the proportion of total chip resources occupied by each module. The overall resource utilization of the project can be seen in "summary".