Table of contents
5.2 Experimental settings of shadow detection module and street view detection module
5.2.1 Experimental environment and tools
5.2.4 Specific process of experiment
5.3 Experimental evaluation and comparison
5.3.1 Evaluation criteria for two types of experiments
5.3.2 Comparison of two types of experimental results
Implementation of street scene target detection system in shadow environment
6.2 System software and hardware environment
6.5 System design and implementation
6.5.1 Design and implementation of system core modules
6.5.2 Display of other modules of the system
This article is quite long and is divided into three parts: upper, middle and lower. Please see the article index for details.
5.2 Experimental settings of shadow detection module and street view detection module
5.2.1 Experimental environment and tools
The experimental operation uses
Ubuntu 16.04
operating system as the platform, using
Python3.6
language coding, and the software uses
Pytorch
and
Mxnet
are used as deep learning frameworks, and are combined with
Opencv
,
Matplotlib
,
Numpy
and other toolkits to process data.
Processing and operation, in terms of hardware, the training process is based on an
Nvidia Tesla P4
, and the prediction and inference process is based on an
Nvidia
GTX 960M
, this experiment consists of two types of sub-experiments, including the experiment of the shadow detection module and the implementation of the street view target detection module.
The experience will be explained separately in the specific discussion.
5.2.2
Input layer and output layer settings
For the shadow detection module, the input layer is trained using a fixed
512
×
512
×
3
image input.
Before layering, each data will be randomly cropped, that is, the data will be expanded to a size of
512
×
512
, so that it can be directly input into the model. output
The layer mainly uses a transposed convolution layer based on bilinear interpolation, which is used to reduce the image passing through four convolution modules from a size of four times.
Restore the image size to the original size to fit the output result.
For the street view object detection module, the training input layer uniformly uses bilinear interpolation to scale the image data size to
512
×
256
, use nearest neighbor interpolation to scale the label to the same size to avoid other floating point values in the label, and then enter
Resnet
FPN
for feature extraction operations. The output layer is divided into a bounding box recognition branch and a
mask
branch. The bounding box recognition branch
After inputting the feature map into the fully connected layer, the predicted category and bounding box positioning are output, and the
mask
branch outputs
28
×
28
× 80
 represents the total number of shadow pixels and the total number of non-shadow pixels. The lower the error factor, the higher the shadow detection accuracy of the model, like

 In the experiment, in order to explore the role of each module of the shadow detection model, four reference networks were built for comparison and verification.
 Observing the experimental results, it can be seen that the evaluation indicators of the complete shadow detection module proposed in this article are better than the four categories built in the verification experiment.
 It can be seen from the observation results that the street view detection model in the complete shadow scene based on the shadow detection module and the street view detection module is basically
 Analyzing the precision and recall curves, it can be seen that both types of parameters gradually converge from 350 to
400
steps. Compared with the large, medium and small three
Analyzing the precision and recall curves, it can be seen that both types of parameters gradually converge from 350 to
400
steps. Compared with the large, medium and small three


mask, the final module will output three results, and then map them back to the original image to realize the functions of positioning, detection and segmentation.
5.2.3 Loss function
The loss function is used to depict the distance between the detection results of the model and the actual label. How to calculate the loss calculated by the loss function?
Minimizing without over-fitting is one of the goals of model training. There are different methods for the two types of experiments involved in this article.
Loss function definition.
For the shadow detection module, observing the shadow data set, there is an imbalance in the proportion of positive and negative samples, as
shown in Figure
5.1 below.
An example of a training set image with such a problem.

In real detection results, black pixels represent background information, and white pixels represent shadow information to be detected. In this case, white
Shaded pixels account for a lower proportion of the global total. In the complete data set, such imbalance in the distribution of positive and negative samples is common
situation, after comprehensive analysis,
Focal Loss is used
as the loss function for final model training. The following equation
5.1
represents
Focal
The specific definition of Loss
[53].

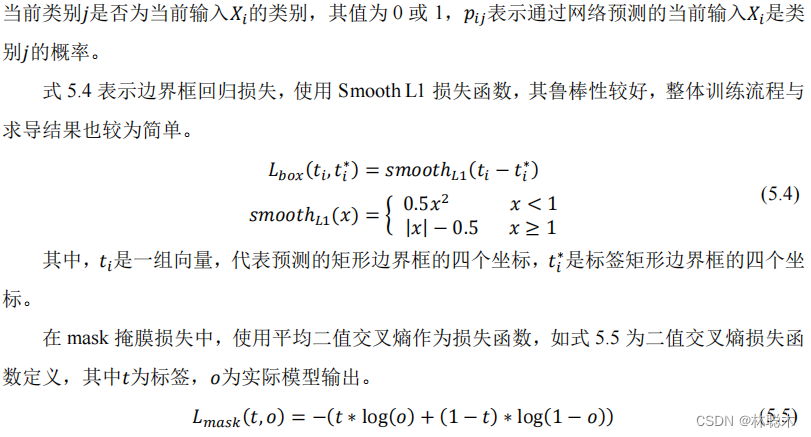
The average binary cross entropy is based on the ordinary binary cross entropy and uses the
Sigmoid
activation function to calculate each pixel one by one.
The calculation of pixels avoids and solves competition problems between classes.
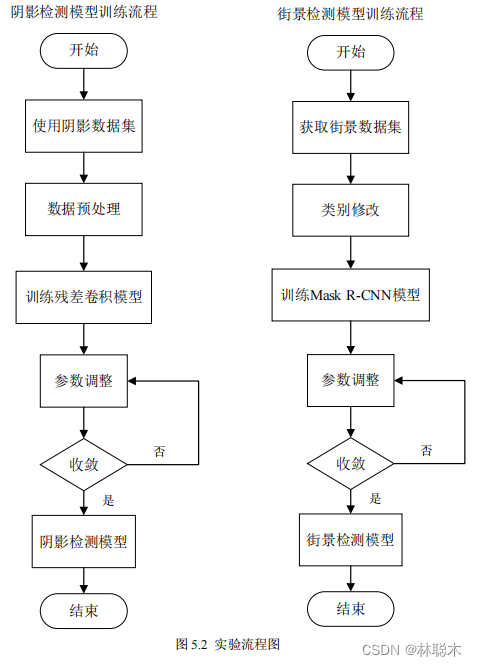
5.2.4 Specific process of experiment
As shown in Figure
5.2
, this experiment contains two sub-experiments. The training steps of the overall experiment include the acquisition and use of data sets, data pre-processing and
Process or class modifications, train the core model, adjust parameters to convergence and obtain the final overall model composition. In shadow detection mode
The block will preprocess and augment the shadow data set and input it into
the parallel residual convolution module based on
Resnet50 , using
Focal
Loss
estimates the loss and trains for about
500
steps until convergence; in the street view detection module, first of all, for the street view data set
Cityscapes
Convert categories from the original
34
categories to
5
categories, input
the Mask R-CNN
network for training, and target the bounding box
The loss, classification loss and
mask
loss are optimized until the network training reaches convergence in about
400
steps, and usable street view detection is obtained.
Model.
5.3 Experimental evaluation and comparison
5.3.1 Evaluation criteria for two types of experiments
By training the above data according to the process, the final output results will be evaluated according to the evaluation criteria to observe the model.
The actual prediction ability of the model has different evaluation criteria for the shadow detection model and the street scene target detection model, as follows.
Specific definitions will be given.
For the shadow detection model, more attention is paid to the model's recognition rate of shadows and the false detection rate of non-shadows. In order to evaluate the experimental results
The results are analyzed and compared, using the same evaluation index as the previous shadow detection model [14-15]
: shadow pixel detection error factor
SER
, non-shadow pixel detection error factor
NER
, average detection error factor
BER
, are defined as follows
: 5.6
,
5.7
and
5.8
:
represents the total number of shadow pixels and the total number of non-shadow pixels. The lower the error factor, the higher the shadow detection accuracy of the model, like
The more accurate the classification of prime semantic information, the final evaluation standard can better reflect the probability of detection errors and evaluate whether the model has
Better detection results.
For the street view target detection model, the average accuracy rate
Average Precision (mAP) and the peace rate under certain
IOU conditions are used.
Average Recall (mAR) is
used
as the evaluation index.
IOU
refers to the predicted edit box area and the bounding box of the label.
The intersection ratio between regions
[54]
is used to examine the gap between predictions and labels.
The IOU
reference range is set to
0.5:0.05:0.95
, where
0.5
:0.05:0.95
represents
10 sub-intervals divided from
0.5
to
0.95
at
intervals of
0.05 , and then
the IOU of each interval is
The accuracy is averaged to obtain the final evaluation index, and then the different accuracy rates in large, medium and small areas are evaluated based on the target size.
and recall rate to achieve the purpose of comparative analysis of control variables. Small area
(small)
represents the label positioning box less than
32*32
, medium
The area
(medium)
represents the annotation positioning box smaller than
96*96
, and the large area
(large)
represents the annotation positioning box greater than or equal to
96*96
.
5.3.2 Comparison of two types of experimental results
For the shadow detection network combined with evaluation standards,
it is built in the environment of
ubuntu16.04
,
Python3.6
, and
mxnet-cu100 .
Trained and tested on a
Tesla P4
graphics card, it takes an average of
0.031
seconds to process a picture, and the detection speed is expected to reach every
32.2 frames
per second
, with certain efficient real-time detection capabilities.
The specific performance of the shadow detection module in this article on the
SBU
and
UCF
test sets
The comparison results between the body test results and common shadow detection models of the same type are shown in Table
5.1
and Table
5.2
.
In the experiment, in order to explore the role of each module of the shadow detection model, four reference networks were built for comparison and verification.
The first network is the original pre-trained
Resnet50
network, with only its last output layer modified; the second network is
Resnet50+CBAM
network, based on the original
Resnet50
network, connects unimproved attention between each residual convolution block
force module
CBAM
; the third network is
Resnet50+conv-CBAM
network, which
is based on the original
Resnet50 network.
The improved attention module
conv-CBAM is connected between each residual convolution block
; the fourth network is
Resnet50+Parallel
Block+conv-CBAM
network is a reorganization of each residual module of the original
Resnet50
, using the parallel convolution design mentioned above.
The idea is to form parallel convolution modules, and connect the improved attention mechanism modules between each module, but the output results of each layer do not use
Connected with dense connections. The above four types of network structures are different, and the complexity is getting higher and higher. They are different from those using dense connection ideas.
Comparing the complete networks with each other can verify the attention mechanism
CBAM
, the improved attention mechanism
conv-CBAM
, and the parallel volume respectively.
The role of product modules and dense connection design methods. In order to ensure the credibility of the verification experiment, the same loss was used for each model training.
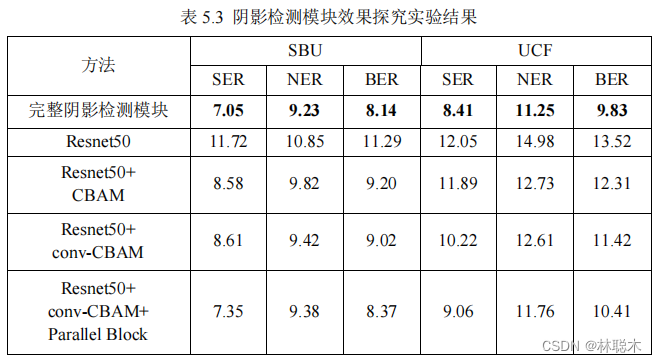
loss function, data set and training strategy, and use the same evaluation index to evaluate the prediction results. The specific modules
The results of the research experiment are shown in Table
5.3
.
Observing the experimental results, it can be seen that the evaluation indicators of the complete shadow detection module proposed in this article are better than the four categories built in the verification experiment.
Reference network, and as the complexity of these five types of networks deepens, the evaluation index values generally decrease, reflecting
This ensures the rationality of the design of each module and ensures the credibility of this shadow detection module. The complete module has relatively good performance on the
SBU
test set.
Good performance improvement,
the NER and BER indicators on the
UCF
data set
are significantly lower than other similar shadow detection models.
drop. The success of cross-dataset validation proves the reliable generalization ability of this model. And through
ST-CGAN
.
Comparison of model experimental results proves that this model has a balanced detection ability on positive and negative samples. The classifier will not be affected by positive and negative samples.
The imbalance of quantitative proportion leads to the imbalance of classification results.
For the experimental results of the street view target detection module, the street view target detection module single module and the combined shadow detection module are used.
The street view target detection model in the complete shadow environment state is compared with the street view detection module composed of blocks to reflect the shadow.
The importance of the detection module in the target detection topic in the complex scenes explored in this article, and the advantages of this street view target detection model
Overall usability and robustness, the specific comparison results are as follows in Table
5.4
.
It can be seen from the observation results that the street view detection model in the complete shadow scene based on the shadow detection module and the street view detection module is basically
This book has higher precision and recall rates, which is due to its additional shadow detection processing for shadow scenes in the data set.
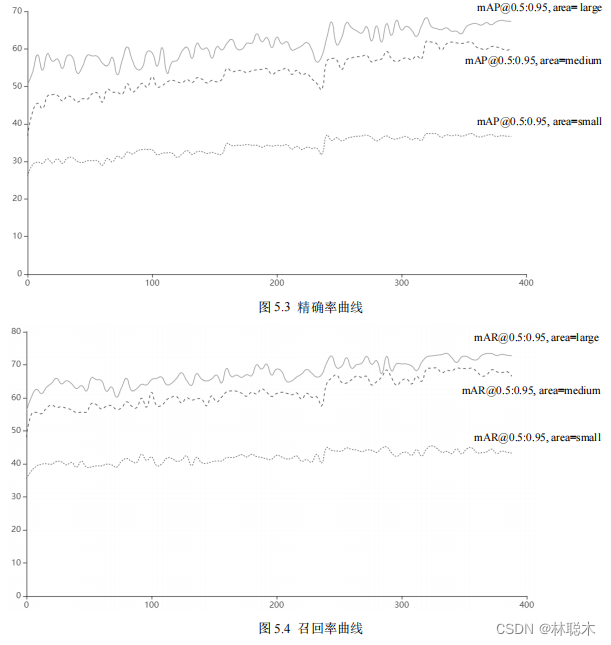
This enables the model to have better detection capabilities in different scenes and different lighting conditions. Therefore, the street view detection method proposed in this article finally
The measurement system will be built based on this model and parameter benchmark to achieve richer interface functions, as shown in Figures
5.3
and
5.4
.
is a specific parameter curve, in which the horizontal axis represents the number of training iteration steps, and the vertical axis represents the specific percentage index value.
Analyzing the precision and recall curves, it can be seen that both types of parameters gradually converge from 350 to
400
steps. Compared with the large, medium and small three
The recall rate and precision rate under the class label bounding box area. As the bounding box area increases, the precision rate and recall rate of model recognition
As it increases, the model's detection ability is stronger, which means that the model has better recognition ability for large-scale objects, and for objects smaller than
The object recognition ability of 32*32 scale is slightly weaker.
Compare the recognition precision rate and recall rate. In any positioning frame area, the recall rate
Overall, it is higher than the accuracy rate, which proves that the model recognizes various categories well, has fewer false negatives, and can locate and find most of the
The objects to be predicted are divided into two categories, and the accuracy is also at a good level, and the recognition accuracy is also guaranteed. Based on two types of indicators, the model
The overall shape meets the needs of street scene detection and can complete detection and positioning tasks.
Implementation of street scene target detection system in shadow environment
6.1 System Overview
For street view object detection tasks, users such as drivers, traffic control departments or insurance companies often need an actual and feasible
The system is used to complete most of the functions. Just using the trained model cannot display the facts and prediction results well.
It is also difficult to provide reliable interaction capabilities for non-technical developers. Based on this demand, build a street scene in this shadow environment
The target detection system allows users to upload street view photos, upload street view videos, use cameras to take photos and conduct street view target detection.
Basic functions of measurement and prediction.
This street view detection system uses the two module models in the experiment described above and are connected to each other to provide users with efficient and convenient
Jie's one-stop multi-functional street view detection platform. The system
is developed based on
C/S architecture and is mainly suitable for
Windows operating systems.
system, using the
PyQt5
framework to develop graphical interface windows, and using
Pytorch
and
Opencv
toolkits to complete image operations.
and other specific detailed functions are divided into three major development tasks. The first is the connection interface between the experimental training model layer and the business layer; the second
It is the driving connection between the database persistence layer and the business layer. The third is the construction of the core business layer, the development of business logic and its interaction with
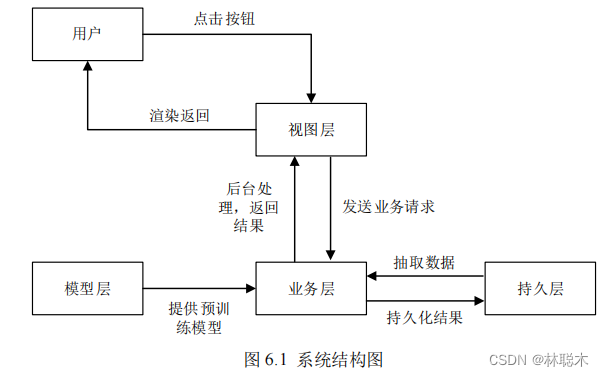
View layer connections. The model layer encapsulates the core algorithm model process, including the composition of each module and the definition of the network, and is also responsible for
Responsible for importing training parameters into the model template, and finally exporting the directly available module model for use; the view layer is developed based on
PyQt5
.
Responsible for arranging functional interfaces and controls, providing available human-machine interfaces and buttons, and presenting background data to users.
users, exposing information such as prediction results; the business layer is responsible for processing feedback from the view layer and processing the processes that users need to process. At the same time
You can combine the model layer and the persistence layer to operate on data, such as image processing, data storage, etc., which is the backend of the entire system.
The most important core of the platform; the data persistence layer is based on the
MySQL
database and is mainly used to encapsulate the database and implement database operations.
To operate and process relevant important information, Figure
6.1
is the system structure diagram of the street scene detection system in a shadow environment.
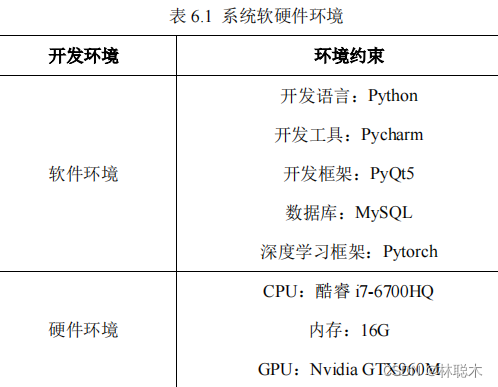
6.2 System software and hardware environment
Street scene target detection system in shadow environment based on regional convolutional network using
PyQt5
framework and
Pytorch
depth learning
Learning framework, etc. realize various functions of the system. System environment constraints are shown in Table
6.1
.
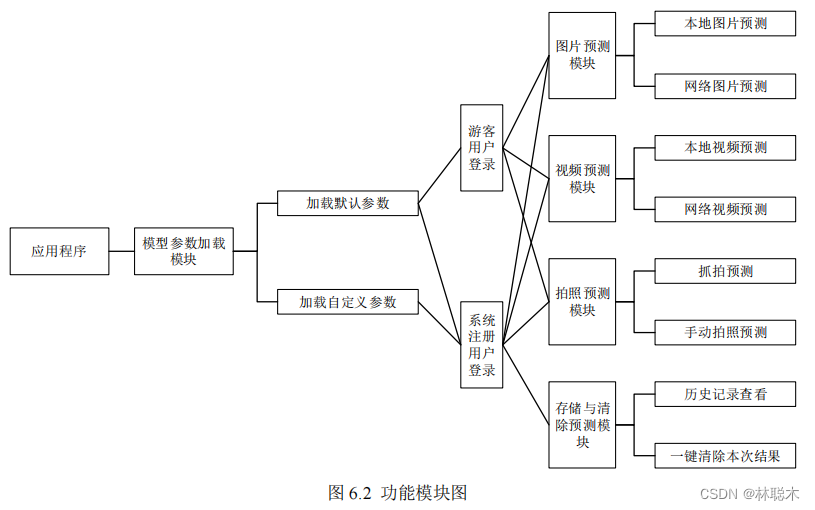
6.3 Function module design
The street view target detection system in shadow environment based on regional convolutional network consists of the following functional modules.
(
1
) Model parameter loading module: This module mainly calls the model layer, and any system user can obtain the default storage directory.
The recorded existing model parameter list includes its specific training parameters, such as final evaluation parameters, number of training steps,
training time, etc., and also provides an interface for registered users of the system to use additional customized model parameter files.
(2) Login module: This module is responsible for providing users with a main entrance to the program. Users can register as new users.
You can also use an existing account to log in to the system, or you can enter the experience system as a visitor. The difference between visitors and system users
The data persistence layer will allocate space for users to store some historical system prediction results to facilitate subsequent review.
After the visitor closes the program or exits the system, the system will not retain the prediction results.
(3) Image prediction module: This module is one of the core access modules between the view layer and the user. It is left to the user to upload this module independently.
Map pictures are used for prediction. At the same time, when the computer is connected to the Internet, the user can also provide
a URL
connection to upload the network map.
slices for prediction.
(4) Video prediction module: Users can upload local videos or provide online video
URLs
, and the system will
The video is analyzed, and then detected frame by frame, and finally the result detection video is returned.
(5) Photo prediction module: Users can use an external camera or other hot-swappable photo equipment to take photos, and the system will
Directly calling these devices for imaging, users can press the specified keys on the keyboard to take pictures, and then make predictions.
Real-time capture mode can be enabled, with automatic photo prediction, so users don’t need to manually press buttons to take photos.
(6) Storage and clearing module: This module is connected to the data persistence layer and is responsible for analyzing the prediction results under the condition that the user logs in.
Automatically save, and when the user realizes that there is no need to save the results, they can use the clear cache function to clear the results with one click.
The result file generated by the prediction.
6.4 System process
As shown in Figure
6.3
, the entire street view target detection system in shadow environment based on regional convolutional network is at the user level.
The process can be roughly divided into
3
parts:
First, open the system homepage and select model parameters. Visitors can only use the parameter experience provided by the system by default. The system notes
Registered users can also customize parameter files uploaded to other locations, and then select a login role to save data based on prediction results.
You need to choose to log in as a system user or guest, or you can register as a system user.
Second, after officially entering the system, users can use the picture prediction function and video prediction function by clicking different buttons.
There are three main media prediction methods: function and photo prediction function. In the picture prediction function, users can directly select local pictures or
Provide network image
URLs
for system use; in the video prediction function, users need to upload local videos or Internet video
URLs
.
System video source files are provided for prediction, and the resulting video can be directly played, paused, etc.; photo prediction module
, the system will directly call the user's camera equipment to capture the photo, and the user can also decide the photo timing to take the photo.
Third, after the prediction is completed, the user can operate on the prediction results. All prediction results will be saved by default, and the user can also
You can choose to clear this prediction result file with one click, and provide a historical results viewing interface to review past prediction results.
If the logged-in user role is a guest, historical information will not be saved, and there is no permission to query historical information or clear results.
The need for fruit documents.
6.5 System design and implementation
This section gives the module display and explanation of the street scene target detection system in shadow environment based on regional convolutional network.
It is specifically subdivided into core functional modules and other auxiliary modules. For the core modules, screenshots of the system interface and specific function introductions are given.
For other auxiliary modules, a brief analysis and partial explanation are given.
6.5.1 Design and implementation of system core modules
(
1
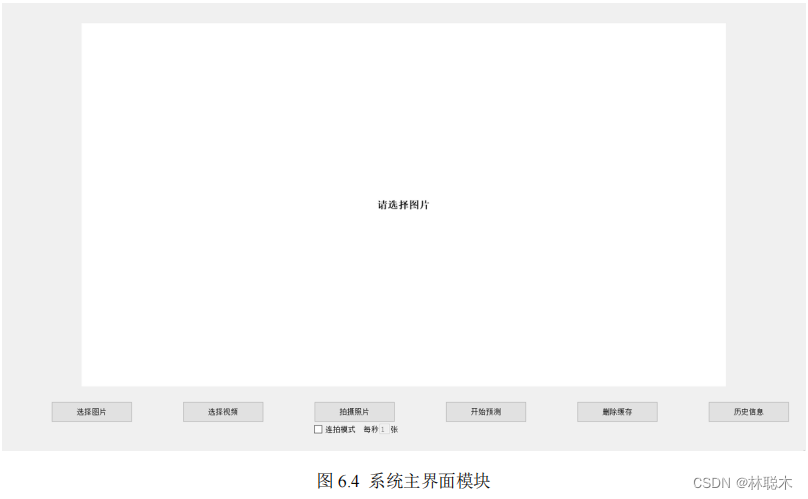
) System main interface module
The main interface of this system provides access to some core functions, similar to the service center. Users can click various function buttons.
Realize the corresponding core functions, as shown in Figure
6.4
below. The main interface of the system consists of several buttons and a central display area. Each button
There is a text description indicating the direction of the function. The function that needs to display the result will process the result and pass it to the central display field. The user can
Directly observe predicted results or intermediate results in real time.
The main interface of the system mainly includes the function entrances of selecting pictures, selecting videos, taking photos, starting prediction, and deleting cache.
storage and historical information, among which the three functional modules of selecting pictures, selecting videos and taking photos will call the central
Display domain to display the original preview files of pictures and videos. When the prediction result function button is clicked, the pictures and videos will be processed.
Analysis and prediction, the final prediction results will also be transmitted to the central display domain, giving users the most direct information feedback, making human-computer interaction friendly.
good.
(2) Image prediction and video prediction module
When the user clicks the Select Picture or Select Video button, a prompt sub-interface will pop up asking the user to select a local picture or video.
It uses network pictures or videos. For local pictures or videos, as shown in Figure
6.5
, a selection box pops up for the user to select local pictures or videos.
For videos, for online pictures or videos, the background will verify
the URL
link, determine whether it can be downloaded, and prompt the user, etc.
After the system completes the operation, no matter which method the user chooses to upload pictures or videos, the central display area will display the source files.
display, the status bar will also display the current source file path to ensure that the user has not selected the wrong source file. After the user confirms the source file information,
You can click the Start Prediction button, and then the system will prompt you to wait. After the data is processed in the background and the pre-trained model prediction is completed,
The prediction results will directly overwrite the source files in the central display field, and the central display field will be refreshed to display the prediction results, which is also convenient for display.
Users can observe the prediction results immediately and complete their needs. At the same time, the system will automatically save the prediction results for non-tourist users.
fruit.
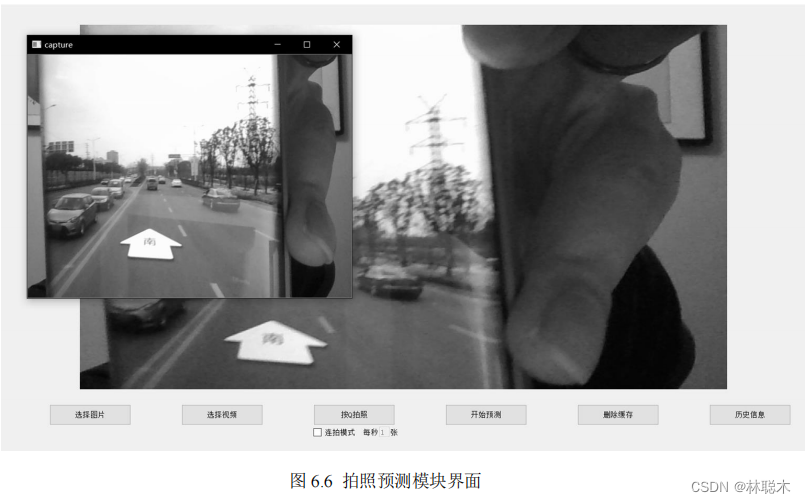
(3) Photo prediction module
Users can use the manual photo prediction function by clicking the Take Photo button, which will automatically call the device camera or external camera.
Header, and the picture currently captured by the camera will pop up. The user can observe the picture and manually determine the timing according to the system prompts and press the button.
Take a photo. Figure
6.6 below
shows the photo interface. After the photo is completed, the photo results will also be transferred to the central display area. The user can
After careful analysis or observation, you can also click the Start Prediction button to make the system start prediction in the background, and the prediction results will be the same.
Presented in the central display field. The photo prediction function also has a continuous shooting mode for users to choose. Users can check the continuous shooting mode below the photo taken.
Click the check box of the shooting mode and activate the text box on the right. The user can decide the frequency of continuous shooting. The continuous shooting mode will be in the user-given setting.
The camera is automatically called to take
9
photos in a row under the frequency. After the shooting is completed, these
9
photos will be composed into a nine-square grid image and transferred to the computer.
The central display field is displayed. After the user confirms that it is correct, he can click the start prediction button. The system will
perform prediction on these 9 pictures in the background.
Prediction, the final prediction result is also displayed in the central display area in the form of a nine-square grid. For non-tourist users, take a photo of the prediction result.
It will also be saved automatically.
6.5.2 Display of other modules of the system
(
1
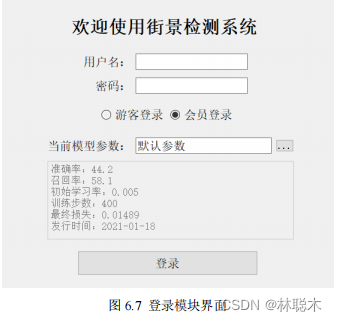
) Login module
The system login interface is mainly responsible for specifying the system back-end model parameters and confirming the user's identity and role. It is the key to the entire system.
The first entrance, as shown in Figure
6.7
, will first display the default backend parameters and corresponding evaluation values of the current version of the system to the user, including
Including precision rate, recall rate, number of training steps, loss value and parameter release time, etc. At this time, the login role can choose between tourist and registered
Registered users. Visitors log in to directly enter the main interface and lock the current parameters. Registered users enter their account password to enter the system and can
Call the current user's historical prediction information. In this interface, users can also upload parameter files to achieve richer prediction effects.
However, this feature only supports registered users, guest users cannot customize parameter files.
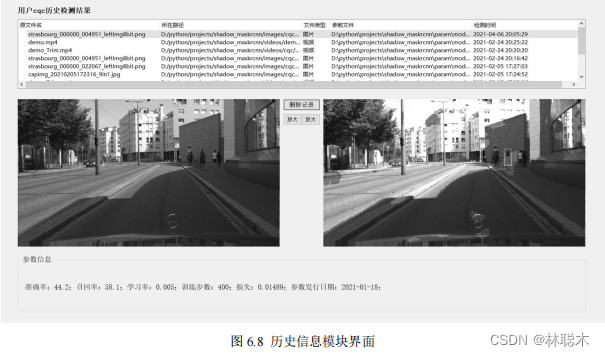
(2) Historical information module
For guest users, this interface will be directly hidden. For registered users, as shown in Figure
6.8 ,
this interface will call the current user
The data in the database is listed by file name and prediction time. Click on a detailed record to view it.
The central display area displays the prediction results of the record. Click the enlarge button to support full-screen display of the results. At the same time, for the subsequent
The terminal model parameters will also have relevant descriptions to facilitate users to mine the available information in historical records and also be used to compare files with the same file.
The prediction results of different model parameters are compared and analyzed.