Enterprise mainstream full-link monitoring system
1. Problem background
With the popularity of microservice architecture, services are split according to different dimensions, and one request often involves multiple services. Internet applications are built on different sets of software modules. These software modules may be developed by different teams, implemented using different programming languages, and may be distributed on thousands of servers across multiple different data center. Therefore, there is a need for tools that can help understand system behavior and analyze performance problems, so that when a failure occurs, the problem can be quickly located and solved.
全链路监控组件It was against the background of such a problem. The most famous one is Google Dapper mentioned in Google's public paper . To understand the behavior of distributed systems in this context, you need to monitor the correlation actions across different applications and different servers.
Therefore, in a complex microservice architecture system, almost every front-end request will form a complex distributed service call link. The complete call chain of a request may be as shown in the figure below:
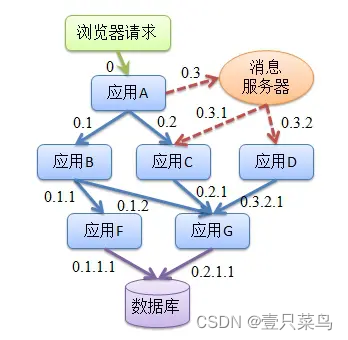
As the business scale continues to increase, services continue to increase, and frequent changes occur, facing complex call links will bring about a series of problems:
- How to find problems quickly?
- How to determine the scope of impact of the fault?
- How to sort out service dependencies and the rationality of dependencies?
- How to analyze link performance issues and real-time capacity planning?
At the same time, we will pay attention to various performance indicators of each call during request processing, such as throughput (TPS), response time, error records, etc.
- Throughput, the real-time throughput of the corresponding components, platforms, and physical devices can be calculated based on the topology.
- Response time, including the response time of the overall call and the response time of each service.
- Error record, based on the service return statistics of the number of exceptions per unit time.
Full-link performance monitoring displays various indicators from the overall dimension to the local dimension, and centrally displays the performance information of all call chains across applications. It can easily measure overall and local performance, and easily find the source of faults, which can greatly shorten production. Troubleshooting time.
With full-link monitoring tools, we can achieve:
- Request link tracking and rapid fault location: Error information can be quickly located through the call chain combined with business logs.
- Visualization: Each stage takes time and performance analysis is performed.
- Dependency optimization: availability of each call link, sorting out service dependencies and optimization.
- Data analysis, link optimization: users’ behavior paths can be obtained, and summary analysis is applied in many business scenarios.
2. Target requirements
As mentioned above, what are the target requirements when we choose the full-link monitoring component? It is also mentioned in Google Dapper, summarized as follows:
1. Performance consumption of probes
The impact of APM component services should be small enough.
Service call burying itself will cause performance loss, which requires low loss of call tracking. In practice, a part of the requests will be selected to analyze the request path by configuring the sampling rate. In some highly optimized services, even a small loss will be easily noticeable and may force the deployment team of the online service to shut down the tracking system.
2. Intrusiveness of code
That is, as a business component, it should have as little or no intrusion into other business systems as possible, be transparent to users, and reduce the burden on developers.
For application programmers, there is no need to know that there is a tracking system. If a tracking system wants to be effective, it must rely on the active cooperation of the application developers. Then this tracking system is too fragile. Application problems are often caused by bugs or negligence in the code implanted in the application by the tracking system. This is why it cannot Meet 无所不在的部署the need for tracking system " ".
3. Scalability
An excellent call tracking system must support distributed deployment and have good scalability. The more components that can be supported, the better. Or provide a convenient plug-in development API. For some components that are not monitored, application developers can also expand them on their own.
4. Data analysis
The data analysis should be fast and the analysis dimensions should be as many as possible. The tracking system can provide information feedback quickly enough to respond quickly to abnormal conditions in the production environment. Comprehensive analysis can avoid secondary development.
3. Function module
A general full-link monitoring system can be roughly divided into four functional modules:
1. Buried points and generated logs
Buried points are the context information of the system at the current node, which can be divided into:
- Client burying point
- Server side burying point
- Two-way burying point between client and server
Buried logs usually contain the following content:
- traceId
- spanId
- The start time of the call
- agreement type
- Caller IP and port
- Requested service name
- The call takes time
- Call result
- Exception information, etc.
At the same time, scalable fields are reserved to prepare for the next expansion;
It cannot cause a performance burden: It is difficult to promote something in the company that has not been verified but will affect performance!
Because logs need to be written, the higher the business QPS, the greater the performance impact. Solved through sampling and asynchronous log.
2. Collect and store logs
Mainly supports distributed log collection solutions, while adding MQ as a buffer:
- There is a deamon on each machine to collect logs. The business process sends its own trace to the daemon, and the daemon sends the collected trace to the upper level;
- Multi-level collector, similar to pub/sub architecture, can load balance;
- Perform real-time analysis and offline storage of aggregated data;
- Offline analysis requires summarizing logs of the same call chain.
3. Analyze and collect statistics on call link data and timeliness
- Call chain tracking analysis: Collect spans with the same TraceID and sort them by time to create a timeline. Stringing the ParentID together is the call stack.
Throws an exception or times out, and prints TraceID in the log. Use TraceID to query the call chain and locate problems. - Dependence metrics:
- Strong dependency: Failure to call will directly interrupt the main process
- High dependency: The probability of calling a certain dependency in a link is high
- Frequent dependencies: A link calls the same dependency many times
- Offline analysis: summarize by TraceID, restore the calling relationship through Span ID and ParentID, and analyze the link shape.
- Real-time analysis: Directly analyze a single log without summarizing or reorganizing it. Get the current QPS, delay.
4. Presentation and decision support
4. Google Dapper
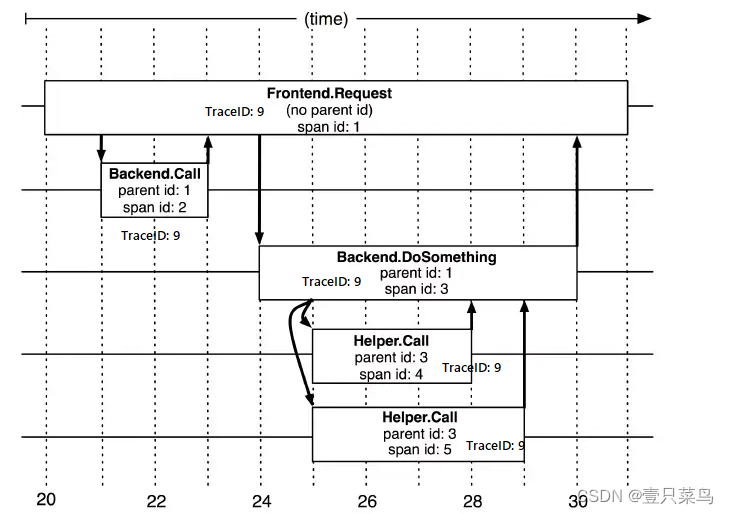
1. Span
basic work unit
A link call (can be RPC, DB, etc. without specific restrictions) creates a span and identifies it with a 64-bit ID. Uuid is more convenient. There are other data in the span, such as description information, timestamp, key-value Correct (Annotation) tag information, parent_id, etc., where parent-id can represent the source of the span call link.
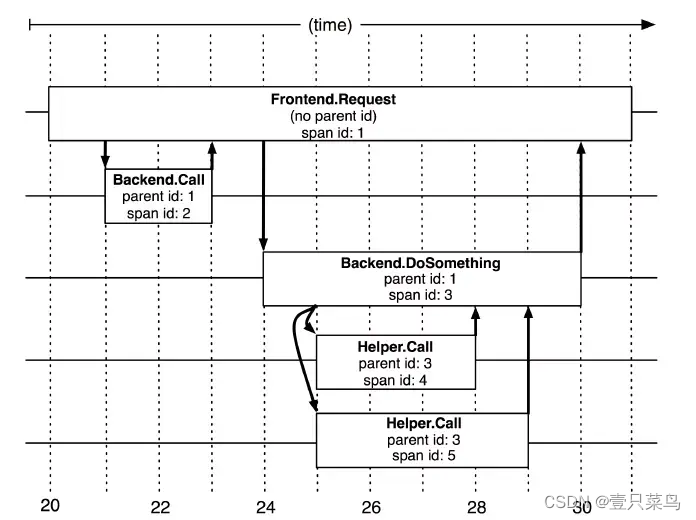
The image above illustrates what span looks like during a large trace. Dapper records the span name, as well as the ID and parent ID of each span, to reconstruct the relationship between different spans during a trace. If a span has no parent ID it is called root span. All spans are tied to a specific trace and share the same trace 跟踪id.
Span data structure:
type Span struct {


    TraceID    int64 // 用于标示一次完整的请求id
    Name       string
    ID         int64 // 当前这次调用span_id
    ParentID   int64 // 上层服务的调用span_id  最上层服务parent_id为null
    Annotation []Annotation // 用于标记的时间戳
    Debug      bool
}
2. Trace
A Span collection similar to a tree structure represents a complete tracking, starting from the request to the server and ending with the server returning a response. It tracks the time consumption of each rpc call and has a unique identifier trace_id. For example: a Trace of the distributed big data storage you run consists of one of your requests.
Each color note is marked with a span, a link is uniquely identified by TraceId, and the Span identifies the initiated request information. Tree nodes are the basic unit of the entire architecture, and each node is a reference to span. The connection between nodes represents the direct relationship between the span and its parent span. Although span in the log file simply represents the start and end time of the span, they are relatively independent in the entire tree structure.
3. Annotation
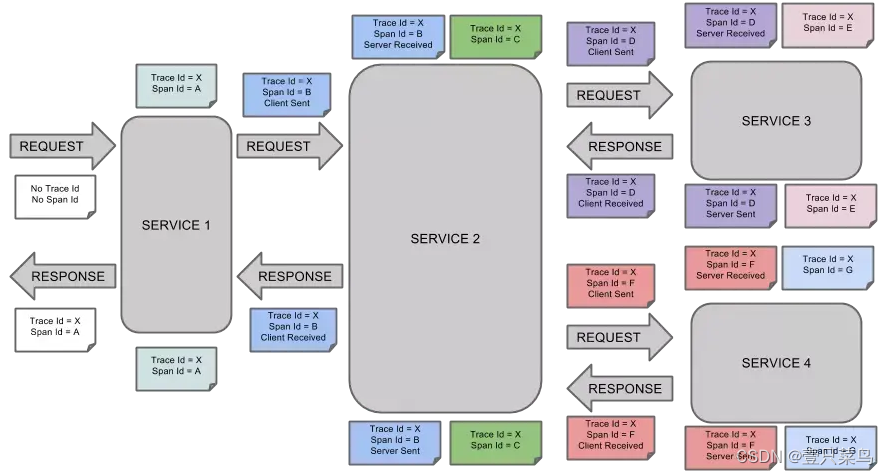
Annotations are used to record information related to requesting specific events (such as time). There will be multiple annotation descriptions in a span. Usually contains four annotation information:
- cs: Client Start, indicating that the client initiates a request.
- sr: Server Receive, indicating that the server received the request.
- ss: Server Send, indicating that the server has completed processing and sent the results to the client.
- cr: Client Received, indicating that the client has received the information returned by the server.
Annotation data structure:
type Annotation struct {


    Timestamp int64
    Value     string
    Host      Endpoint
    Duration  int32			#持续时间
}
4. Call example
- Request call example
- When a user initiates a request, it first reaches the front-end service A, and then makes RPC calls to service B and service C respectively;
- Service B responds to A after processing, but service C still needs to interact with the back-end service D and E before returning to service A. Finally, service A responds to the user's request;
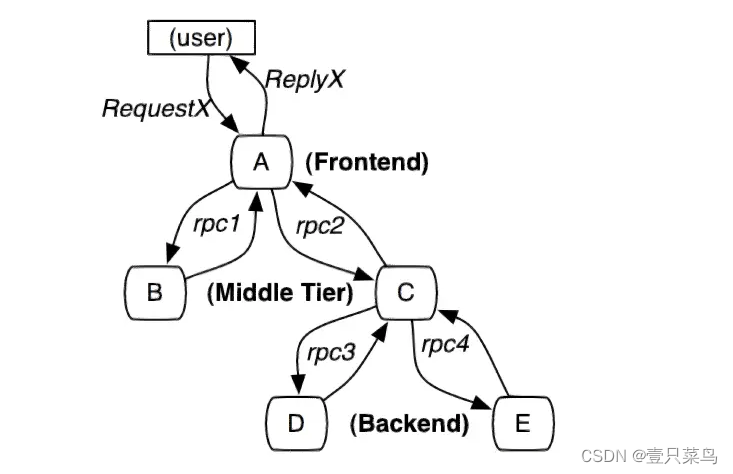
- Call process tracking
- When a request arrives, a global TraceID is generated . The entire call chain can be connected through TraceID. One TraceID represents a request.
- In addition to TraceID, SpanID is also required to record the calling parent-child relationship . Each service will record the parent id and span id, through which the parent-child relationship of a complete call chain can be organized .
- A span without parent id becomes the root span and can be regarded as the call chain entry.
- All these IDs can be represented by globally unique 64-bit integers;
- TraceID and SpanID must be transparently transmitted for each request during the entire call process .
- Each service records the TraceID and SpanID attached to the request as the parent id, and also records the SpanID generated by itself.
- To view a complete call, you only need to find out all call records based on TraceID, and then organize the entire call parent-child relationship through parent id and span id .
- Call chain core work
- Generate call chain data, bury all applications in the entire call process and output logs.
- Call chain data collection to collect log data in each application.
- Call chain data storage and query to store the collected data. Since the amount of log data is generally large, it must not only be able to store it, but also provide fast query.
- Indicator calculation, storage and query, perform various indicator calculations on the collected log data, and save the calculation results.
- Alarm function provides various threshold warning functions.
- Overall deployment architecture
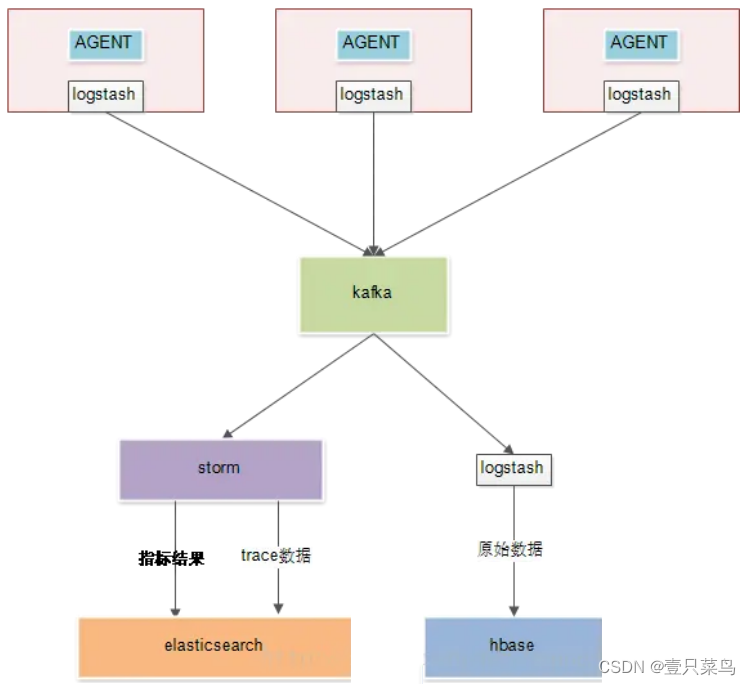
- Generate call chain logs through AGENT.
- Collect logs to kafka through logstash.
- Kafka is responsible for providing data to downstream consumers.
- storm calculates the aggregated indicator results and falls into es.
- Storm extracts trace data and drops it into es to provide more complex queries. For example, by querying the call chain through the time dimension, you can quickly query all matching traceIDs, and then go to Hbase to check the data based on these traceIDs.
- Logstash pulls kafka raw data into hbase. The rowkey of hbase is traceID, and querying based on traceID is very fast.
- AGENT non-intrusive deployment
Through AGENT agent non-intrusive deployment, performance measurement and business logic are completely separated, and the execution time of any method of any class can be measured. This method greatly improves collection efficiency and reduces operation and maintenance costs. According to the service span, it is mainly divided into two categories of agents:
- In-service AGENT, this method uses Java's agent mechanism to collect data on the method call level information within the service, such as method call time, input parameters, output parameters and other information.
- Cross-service AGENT, this situation requires seamless support for mainstream RPC frameworks in the form of plug-ins. And by providing standard data specifications to adapt to custom RPC frameworks:
(1) Dubbo support;
(2) Rest support;
(3) Custom RPC support;
- Benefits of call chain monitoring
- Accurately grasp the deployment status of front-line production applications;
- From the performance perspective of the entire call chain process, identify key call chains and optimize them;
- Provide traceable performance data to quantify the business value of the IT operation and maintenance department;
- Quickly locate code performance issues and assist developers in continuously optimizing code;
- Assist developers to conduct white-box testing and shorten the system's online stability period.
5. Plan comparison
Most of the full-link monitoring theoretical models on the market draw on the Google Dapper paper, distributed tracking where a hundred flowers bloom.
- Zipkin is an open source tracking system originally developed by Twitter and open sourced in 2012. Zipkin is widely used and has influenced many later generations. Its transmission head is X-B3
- Skywalking was developed by Chinese people and subsequently donated to an open source project of the Apache Foundation. It is now a top-level project of the Apache Foundation.
- Pinpoint was developed by Naver in 2012 and open sourced in 2015. Pinpoint works with java, php and python.
- Jaeger was first developed by Uber and open sourced in 2017, and was subsequently donated to the CNCF Foundation.
- OpenCensus was initiated by Google. It was originally Google's internal tracking platform and later open sourced.
- OpenTracing is hosted by CNCF and has a relatively complete instrumentation library.
-
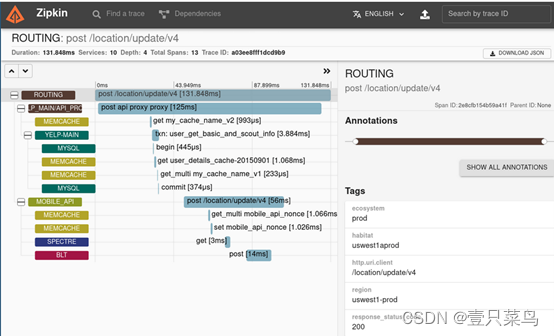
zipkin
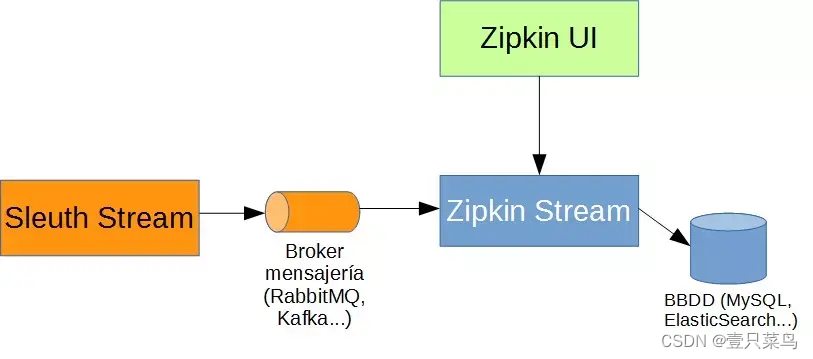
github address: https://github.com/openzipkin/zipkinzipkin is a distributed tracking system that can help you collect data on the time it takes to solve problems in your service architecture. Its functions include collecting and finding this data. If there is a trace ID in the log file, you can jump directly to it. Otherwise, queries can be based on properties such as service, operation name, tag, and duration. For example, the percentage of time spent in the service, and which aspects of the operation failed. It is characterized by being lightweight and simple to use and deploy.
zipkin also provides a UI interface that displays the number of trace requests passed through each application. This helps identify aggregate behavior, including bad paths or calls to deprecated services.
Applications require "instrumentation" to report tracking data to Zipkin. This usually means configuring a library for tracing and detection. The most popular methods of reporting data to Zipkin are via http or Kafka, although there are many other options such as Apache, ActiveMQ, gRPC and RabbitMQ. There are many ways to store data for the UI, such as storing it in memory, or persisting it using a supported backend such as Apache Cassandra or Elasticsearch. -
skywalking
github address: https://github.com/apache/incubator-skywalkingskywalking is a local open source call chain tracking system, including monitoring, tracking, and diagnostic functions. It has now joined the Apache incubator and is specially designed for microservices, cloud-local and container-based (Docker, Kubernetes, Mesos) architectures.
The main functions are as follows:
 1)服务、服务实例、端点指标数据分析
 2)根本原因分析,在运行时评测代码
 3)服务拓扑图分析
 4)服务、服务实例和端点依赖性分析
 5)检测到慢速服务和终结点
 6)性能优化
 7)分布式跟踪和上下文传播
 8)数据库访问度量。检测慢速数据库访问语句(包括SQL语句)。
 9)报警
 10)浏览器性能监视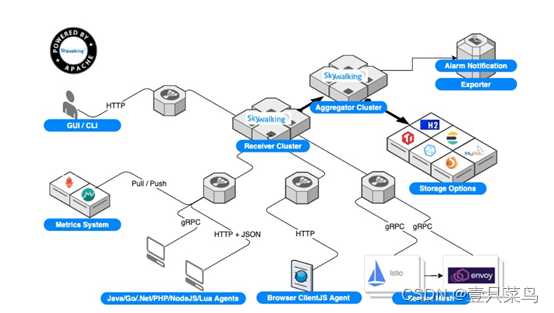
-
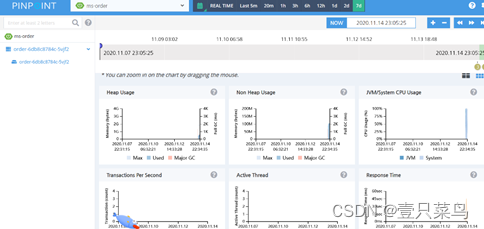
pinpoint
Github address: https://github.com/naver/pinpoint
Pinpoint is a Korean open source call chain analysis and application monitoring analysis tool based on bytecode injection. Pinpoint provides a solution that helps analyze the overall structure of a system and how its components are connected to each other by tracing transactions in a distributed application.
The functions are as follows:
 1)一目了然地了解应用程序拓扑
 2)实时监视应用程序
 3)获得每个事务的代码级可见性
 4)安装APM代理程序,无需更改一行代码
 5)对性能的影响最小(资源使用量增加约3%)
Pinpoint’s visual UI interface:
-
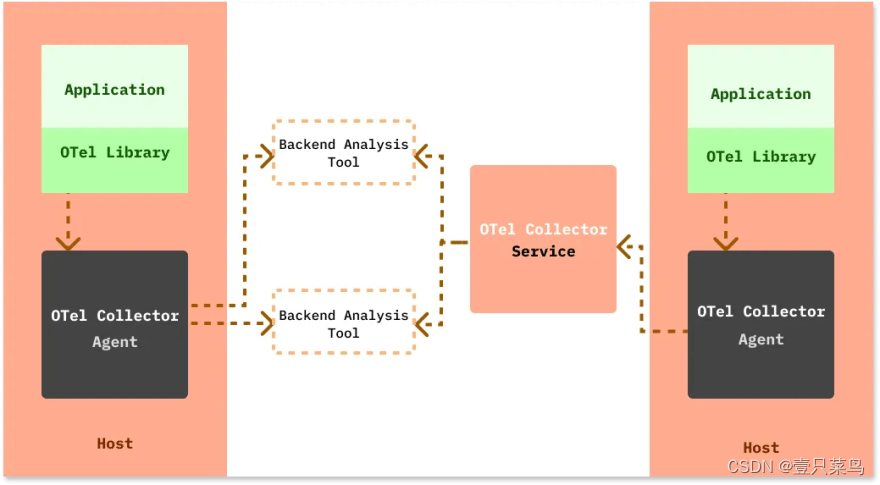
OpenTelemetry
OpenTelemetry is a set of standard protocols for cloud native observability led by CNCF. Its full name is: OpenTelemetry Protocol, or OTLP for short. It aims to standardize the generation and collection of telemetry data. Telemetry data includes logs, metrics, and traces.It is a collection of APIs, SDKs, and client libraries for generating telemetry data from application code. The data you collect using OpenTelemetry is vendor-neutral and can be exported in a variety of formats.
The biggest advantage of using OpenTelemetry is that you have the freedom to choose the backend of your choice. You're not tied to a vendor, and engineering teams can use a single technology to generate telemetry data.
To integrate OpenTelemetry with your application code, you can use the OpenTelemetry client library for your desired programming language. OpenTelemetry also provides a collector called the OTel (OpenTelemetry) collector that can be used to process and export telemetry data in multiple formats.
Main references for the full-link monitoring solution:
- Probe performance: mainly the impact of the agent on the service throughput, CPU and memory. The scale and dynamics of microservices greatly increase the cost of data collection.
- Collector scalability: Ability to scale horizontally to support large-scale server clusters.
- Comprehensive call link data analysis: Provides code-level visibility to easily locate failure points and bottlenecks.
- Transparent for development, easy to switch: add new features without modifying the code, easy to enable or disable.
- Complete call chain application topology: Automatically detect application topology to help you figure out the application architecture.
1. Probe performance
Conclusion: skywalking's probe has the smallest impact on throughput, and zipkin's throughput is in the middle. Pinpoint probes have a greater impact on throughput
Pay more attention to the performance of the probe. After all, APM positioning is still a tool. If the throughput is reduced by more than half after the link monitoring component is enabled, it is unacceptable. Stress tests were conducted on skywalking, zipkin, and pinpoint, and compared with the baseline (without using probes).
A common Spring-based application was selected, which includes Spring Boot, Spring MVC, redis client, and mysql. Monitoring this application, for each trace, the probe will capture 5 spans (1 Tomcat, 1 SpringMVC, 2 Jedis, 1 Mysql). This is basically the same as the test application of skywalkingtest.
Three types of concurrent users were simulated: 500, 750, and 1000. Use jmeter to test, each thread sends 30 requests, and sets the thinking time to 10ms. The sampling rate used is 1, that is, 100%, which may be different from production. The default sampling rate of pinpoint is 20, which is 50%. It can be changed to 100% by setting the agent's configuration file. The default value of zipkin is also 1. Combined, there are 12 types in total. Let’s look at the summary table below:
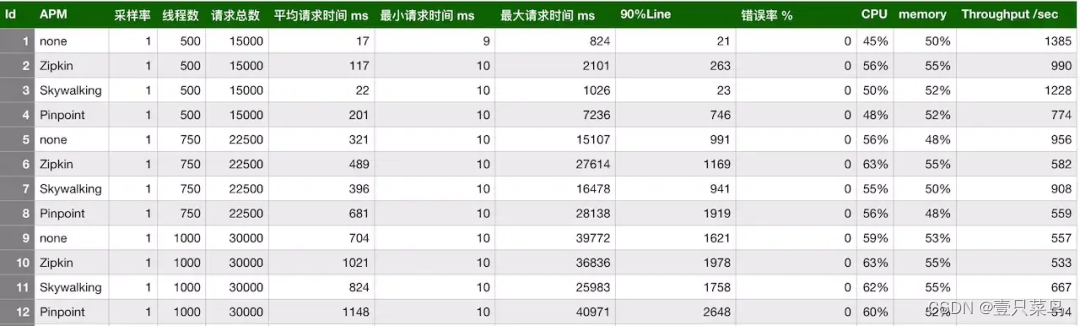 As can be seen from the above table, among the three link monitoring components, skywalking’s probe has the smallest impact on throughput, and zipkin’s throughput is in the middle. The impact of the pinpoint probe on the throughput is obvious. When there are 500 concurrent users, the throughput of the test service is reduced from 1385 to 774, which has a great impact. Then let’s look at the impact on CPU and memory. The stress test conducted on the internal server showed that the impact on CPU and memory was almost within 10%.
2. Collector scalability
Conclusion: The scalability of the collector can be expanded horizontally
, enabling horizontal expansion to support large-scale server clusters.
- zipkin
develops zipkin-Server (actually it is an out-of-the-box package). zipkin-agent communicates with zipkin-Server through http or mq. http communication will affect normal access, so it is recommended to communicate asynchronously based on mq. zipkin-Server consumes by subscribing to specific topics. This is of course scalable, with multiple zipkin-Server instances asynchronously consuming monitoring information in mq.
- skywalking
skywalking's collector supports two deployment methods: stand-alone and cluster mode. The communication between collector and agent uses gRPC. - Similarly to pinpoint
, pinpoint also supports cluster and stand-alone deployment. The pinpoint agent sends link information to the collector through the thrift communication framework.
3. Comprehensive call link data analysis
Conclusion: Detailed level pinpoint>skywalking>zipkin
comprehensive call link data analysis, providing code-level visibility to easily locate failure points and bottlenecks.
- The link monitoring granularity of zipkin
 zipkin is relatively not that fine. From the above figure, you can see that the call chain is specific to the interface level, and further call information is not involved.
 - skywalking
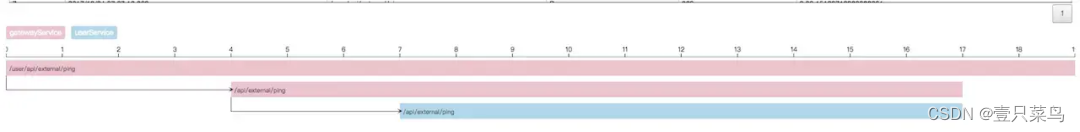 skywalking also supports 20+ middleware, frameworks, and class libraries, such as mainstream dubbo, Okhttp, as well as DB and message middleware. The skywalking link call analysis in the above figure is relatively simple. The gateway calls the user service. Since it supports many middlewares, the skywalking link call analysis is more complete than zipkin.
 - pinpoint
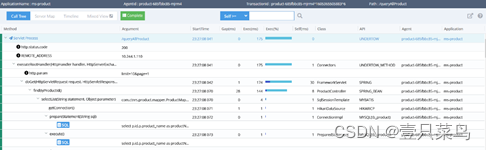
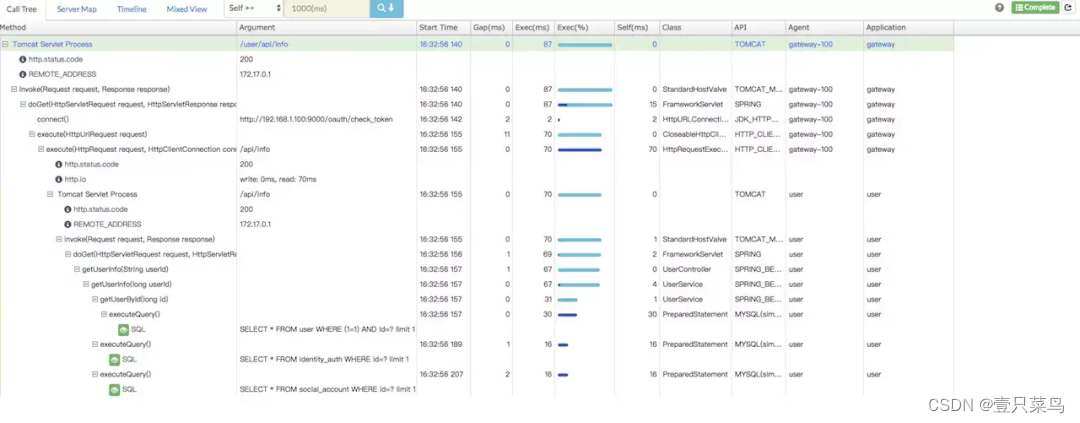 pinpoint should be the most complete data analysis component among these three APM components. Provides code-level visibility to easily locate failure points and bottlenecks. As can be seen in the above figure, all executed SQL statements are recorded. You can also configure alarm rules, etc., set the person in charge of each application, and alarm according to the configured rules. The supported middleware and framework are also relatively complete.
4. Transparent for development and easy to switch
Conclusion: skywalking≈pinpoint > Zipkin
is transparent for development, easy to switch on and off, add new features without modifying the code, and easy to enable or disable. We expect features to work without modifying the code and want code-level visibility.
For this, Zipkin uses a modified class library and its own container (Finagle) to provide distributed transaction tracking capabilities. However, it requires code modifications if needed. Both skywalking and pinpoint are based on bytecode enhancement methods. Developers do not need to modify the code, and more accurate data can be collected because there is more information in the bytecode.
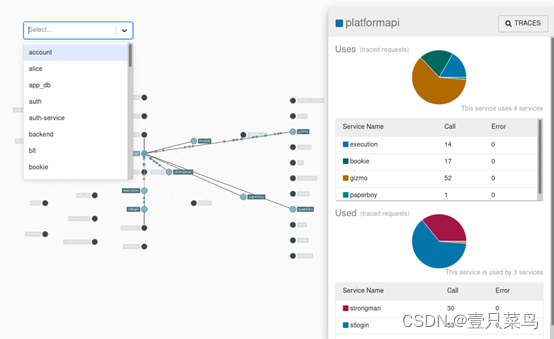
5. Complete call chain application topology
Conclusion: pinpoint > skywalking > zipkin
automatically detects the application topology and helps you figure out the application architecture.
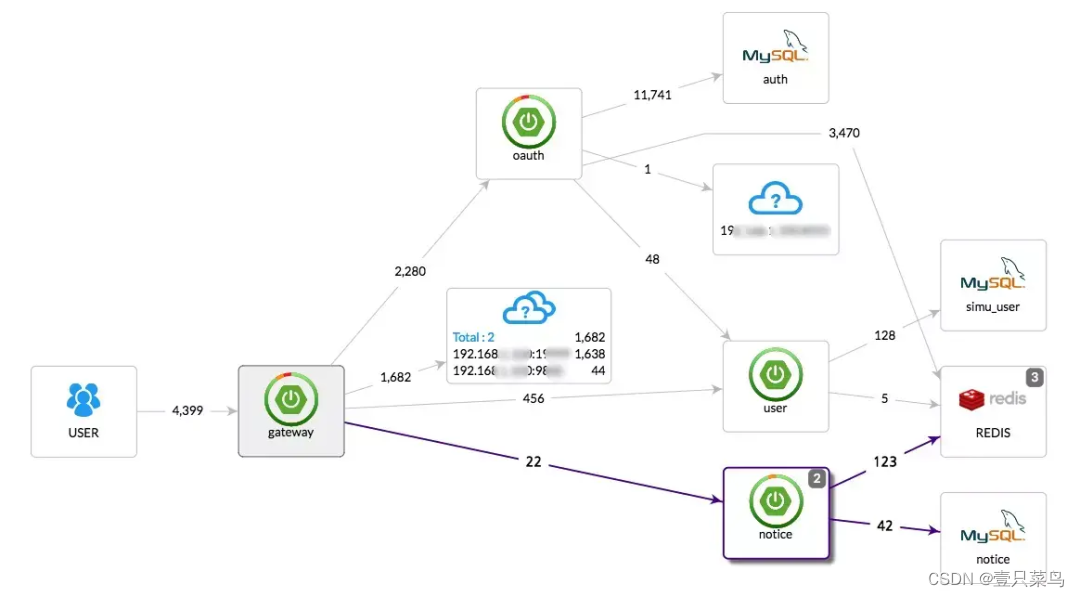
- pinpoint link topology
- skywalking link topology
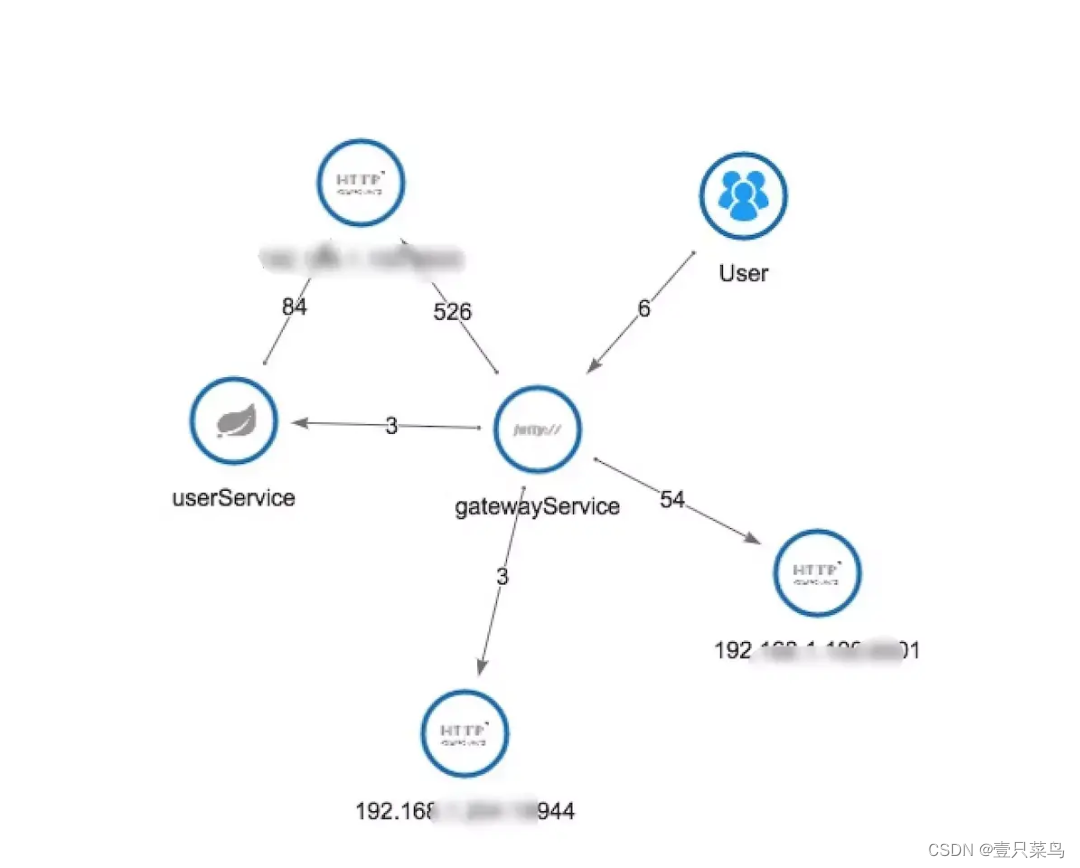
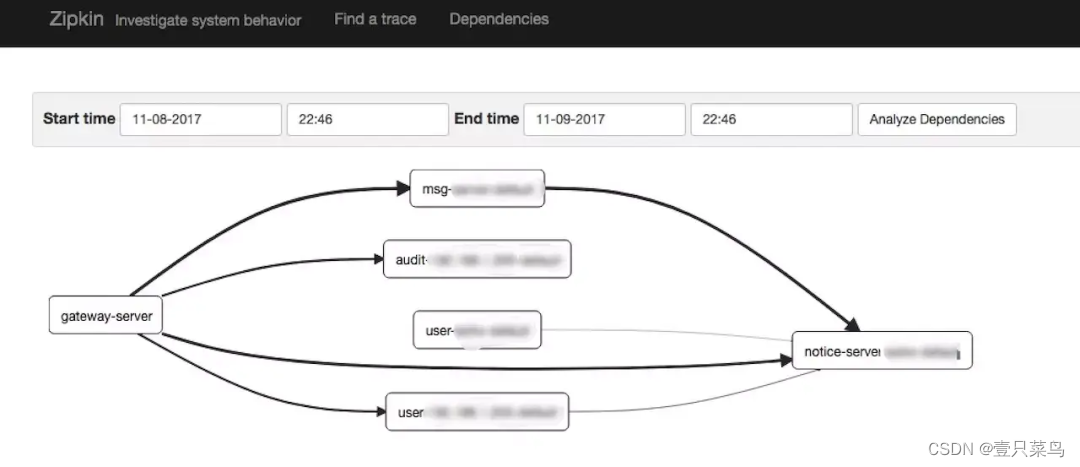 The three pictures above of zipkin link topology respectively show the calling topology of APM components, and can realize the complete calling chain application topology. Relatively speaking, the pinpoint interface displays more richly, specifically the name of the called DB, while zipkin's topology is limited to serving services.
6. Comparison of Pinpoint and Zipkin refinement
- Differences between Pinpoint and Zipkin
- Pinpoint is a complete performance monitoring solution: it has a complete system from probes, collectors, storage to Web interface; while Zipkin only focuses on collectors and storage services. Although it also has a user interface, its functions are not the same as Pinpoint. . On the contrary, Zipkin provides the Query interface, which has more powerful user interface and system integration capabilities, and can be developed and implemented based on this interface.
- Zipkin officially provides interfaces based on the Finagle framework (Scala language), while the interfaces of other frameworks are contributed by the community. It currently supports mainstream development languages and frameworks such as Java, Scala, Node, Go, Python, Ruby and C#; however, Pinpoint currently only The Java Agent probe is officially provided, and others are under request for community support (see #1759 and #1760).
- Pinpoint provides Java Agent probes, which implement call interception and data collection through bytecode injection. It can achieve real code non-intrusion. You only need to add some parameters when starting the server to complete the deployment of the probe; Zipkin's Java interface implementation Brave only provides basic operation APIs. If you need to integrate with a framework or project, you need to manually add configuration files or add code.
- Pinpoint's backend storage is based on HBase, while Zipkin is based on Cassandra.
-
Similarity between Pinpoint and Zipkin
Pinpoint and Zipkin are both based on the Google Dapper paper, so the theoretical basis is roughly the same. Both split service calls into several spans with cascading relationships, and cascade the calling relationships through SpanId and ParentSpanId; finally, all the spans flowing through the entire call chain are gathered into a Trace and reported to the service The collector on the end performs collection and storage.Even at this point, the concepts adopted by Pinpoint are not entirely consistent with that paper. For example, he uses TransactionId to replace TraceId, and the real TraceId is a structure that contains TransactionId, SpanId and ParentSpanId. Moreover, Pinpoint adds a SpanEvent structure under Span to record the internal call details of a Span (such as specific method calls, etc.), so Pinpoint will record more tracking data than Zipkin by default.
However, in theory, there is no limit to the granularity of Span, so a service call can be a Span, and then the method call in each service can also be a Span. In this case, Brave can actually track the method call level, but the specific implementation is not Just didn't do it.
-
Bytecode injection vs API call
Pinpoint implements a Java Agent probe based on bytecode injection, while Zipkin's Brave framework only provides an application-level API, but the problem is far from simple when you think about it. Bytecode injection is a simple and crude solution. In theory, any method call can be intercepted by injecting code. In other words, there is nothing that cannot be implemented, only things that cannot be implemented.But Brave is different. The application-level API it provides also requires the support of the underlying driver of the framework to achieve interception. For example, MySQL's JDBC driver provides a method for injecting interceptors, so you only need to implement the StatementInterceptor interface and configure it in the Connection String to easily implement related interceptions; in contrast, the lower version of MongoDB The driver or the implementation of Spring Data MongoDB does not have such an interface. It is more difficult to implement the function of intercepting query statements.
Therefore, at this point, Brave is a flaw. No matter how difficult it is to use bytecode injection, it is at least achievable. However, Brave has the possibility of not knowing how to start, and whether it can be injected, to what extent it can be injected, and more Depends on the framework's API rather than its own capabilities.
-
Difficulty and Cost
After briefly reading the codes of the Pinpoint and Brave plug-ins, we can find that the implementation difficulty of the two is very different. Brave is easier to use than Pinpoint without any development documentation support. The amount of code in Brave is very small, and the core functions are concentrated in the brave-core module. A mid-level developer can understand its content within a day and have a very clear understanding of the API structure.Pinpoint's code encapsulation is also very good, especially the encapsulation of the upper API for bytecode injection is very good, but this still requires readers to have some understanding of bytecode injection, although its core API for injecting code does not Not much, but if you want to understand thoroughly, you probably have to go deep into the relevant code of Agent. For example, it is difficult to clearly understand the difference between addInterceptor and addScopedInterceptor, and these two methods are located in the relevant types of Agent.
Because Brave's injection relies on the underlying framework to provide relevant interfaces, it does not require a comprehensive understanding of the framework. You only need to know where it can be injected and what data can be obtained during the injection. Just like the above example, we don't need to know how MySQL's JDBC Driver is implemented to achieve the ability to intercept SQL. But this is not the case with Pinpoint, because Pinpoint can inject any code almost anywhere, which requires developers to have a very in-depth understanding of the code implementation of the library that needs to be injected. You can gain insight into this by looking at the implementation of its MySQL and Http Client plug-ins. , of course, this also shows from another level that Pinpoint's capabilities can indeed be very powerful, and many of its default plug-ins have already achieved very fine-grained interception.
When the underlying framework does not have a public API, Brave is actually not completely helpless. We can use AOP to inject relevant interceptions into the specified code, and obviously the application of AOP is much simpler than bytecode injection.
The above are directly related to the cost of implementing a monitoring. In Pinpoint's official technical documentation, a reference data is given. If integrating a system, the cost of developing the Pinpoint plug-in is 100, and the cost of integrating the plug-in into the system is 0; but for Brave, the cost of plug-in development is only 20, and the integration cost is 10. From this point it can be seen that the official cost reference data is 5:1. However, the official emphasized that if there are 10 systems that need to be integrated, then the total cost is 10 * 10 + 20 = 120, which exceeds Pinpoint's development cost of 100, and the more services that need to be integrated, the greater the gap.
-
Versatility and scalability
Obviously, Pinpoint is completely at a disadvantage in this regard, as can be seen from the integrated interfaces developed by the community.Pinpoint's data interface lacks documentation and is not very standard (refer to the forum discussion thread). You need to read a lot of code to implement your own probe (such as Node's or PHP's). Moreover, the team used Thrift as the data transmission protocol standard for performance reasons, which is much more difficult than HTTP and JSON.
-
Community Support
It goes without saying that Zipkin was developed by Twitter and can be regarded as a star team, while Naver's team is just an unknown small team (as can be seen from the discussion of #1759). Although this project is unlikely to disappear or stop updating in the short term, it is not as secure as the former. And without more plug-ins developed by the community, it is really difficult for Pinpoint to complete the integration of many frameworks by relying solely on the team's own strength, and their current focus is still on improving performance and stability. -
Other
Pinpoints have taken performance issues into consideration at the beginning of their implementation. Some back-end services of the www.naver.com website handle more than 20 billion requests every day, so they will choose Thrift's binary variable-length encoding format and use UDP as the Transmission link, and try to use a data reference dictionary when passing constants, pass a number instead of passing a string directly, etc. These optimizations also increase the complexity of the system: including the difficulty of using the Thrift interface, UDP data transmission issues, and data constant dictionary registration issues, etc.In contrast, Zipkin uses the familiar Restful interface plus JSON, which has almost no learning cost and integration difficulty. As long as you know the data transmission structure, you can easily develop the corresponding interface for a new framework.
In addition, Pinpoint lacks the ability to sample requests. Obviously, in a large-traffic production environment, it is impossible to record all requests. This requires sampling of requests to determine what kind of requests I need to record. Both Pinpoint and Brave support sampling percentage, which is what percentage of requests will be recorded. However, in addition, Brave also provides a Sampler interface, which allows you to customize the sampling strategy. Especially when conducting A/B testing, this function is very meaningful.
-
Summarize
From the perspective of short-term goals, Pinpoint does have overwhelming advantages : probes can be deployed without any changes to the project code, tracking data is granular to the method call level, powerful user interface and almost comprehensive Java framework support . But in the long run, the cost of learning Pinpoint's development interface and implementing interfaces for different frameworks in the future is still unknown.
On the contrary, it is relatively easy to master Brave, and Zipkin's community is stronger and more likely to develop more interfaces in the future . In the worst case, we can also add monitoring code suitable for ourselves through AOP without introducing too many new technologies and concepts. Moreover, when the business changes in the future, it is difficult to say whether the reports officially provided by Pinpoint will meet the requirements. Adding new reports will also bring unpredictable work difficulty and workload.
6. The difference between Tracing and Monitor
-
Monitor can be divided into system monitoring and application monitoring. System monitoring includes overall system load data such as CPU, memory, network, disk, etc., and can be detailed to the relevant data of each process. This type of information can be obtained directly from the system. Application monitoring requires application support and exposes corresponding data. For example, the QPS of internal requests within the application, the delay in request processing, the number of errors in request processing, the queue length of the message queue, crash situations, process garbage collection information, etc. The main goal of Monitor is to detect abnormalities and alert the police in time.
-
The foundation and core of Tracing is the call chain. Most of the relevant metrics are obtained around call chain analysis. The main goal of Tracing is system analysis. It’s better to find problems in advance than to solve them after they arise.
Tracing and the application-level Monitor technology stack have a lot in common. There is data collection, analysis, storage and presentation. It’s just that the specific dimensions of data collected are different, and the analysis process is different.