2023 Higher Education Cup Mathematical Modeling 2: DE Questions
- write at the front
- Question E
- Question D
- 2014C Topic Excellent Paper Notes
-
- Question 1 (Solve the average annual litter size of sows to reach or exceed the break-even point)
- Question 2 (Find the proportion of piglets selected as breeding pigs and the number of sows in stock)
- Question 3 (Determine the best business strategy and calculate the average annual profit)
- Question 4
- Model promotion and evaluation
write at the front
Question D is so familiar. Isn’t it just that the pig raising in question C in 2014 has been changed into raising sheep?hhhh
It involves: Optimization algorithm (objective function: the most sheep for slaughter in question 2, the smallest expected loss in question 3).
Data preprocessing that does not involve excel
is suitable Team: Strong modeling ability.
If you can abstract mathematical formula modeling, it is very convenient to use Lingo software to solve the problem.
Question E involves data preprocessing in excel
Question E
It is best to do outlier detection (quartiles, box plots) + processing (linear filling) on the excel data first.
Question 1, line chart, heat map (correlation analysis), correlation analysis (can be considered)
question 2, The question directly states: Seasonality -> ARIMA time series analysis. Pay attention to first testing whether the ARIMA model can be used for
question 3 and question 2. The model can be used to solve question 3, and then based on the mutation point of question 2 such as mutation type and seasonality. Come and give us a monitoring plan (data analysis + text modeling)

Question D
You can draw a mind map to help clarify logic.
2014C Topic Excellent Paper Notes
Below are the excellent paper notes from the previous 2014C question.
1. The structure is clear (the directory structure of the first two questions of the paper is attached)
2. Lingo solves the optimization model, involving function loops and summation
3. The table is very nice
4. Regarding sets, refer to
https://blog.csdn.net/ qq_47925836/article/details/119088653
5. I don’t quite understand the results of the code and paper. Do you think they have been optimized?

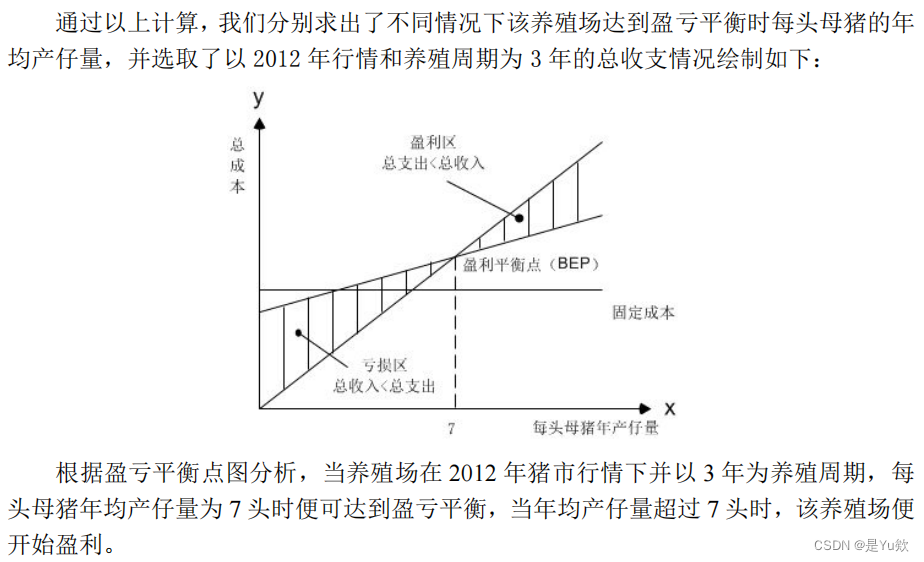
Question 1 (Solve the average annual litter size of sows to reach or exceed the break-even point)
Break-even equations, multivariate functions to establish calculation models, and solve break-even problems
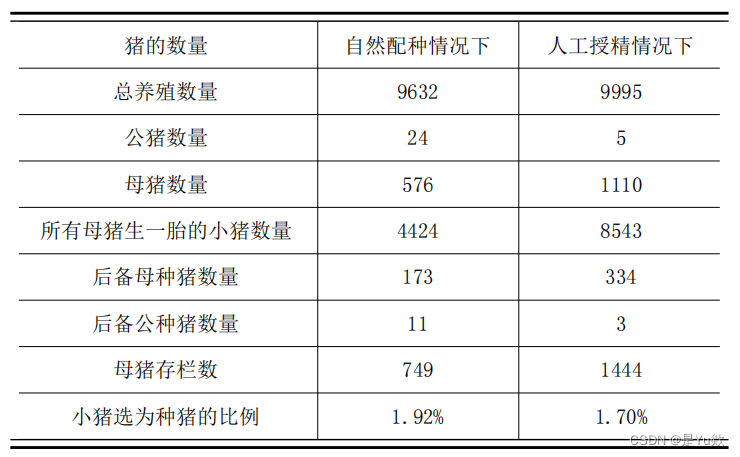
1. Data preparation
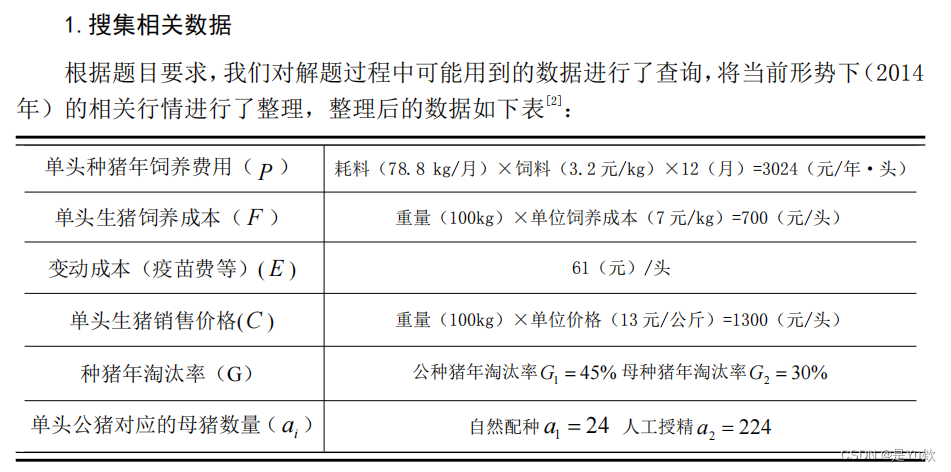
1. Collect relevant data
2. Determine the breeding cycle
2. Use the break-even analysis method to determine the number of litters
1. Solve for the total cost of breeding
(1) Breeding pig feeding cost
(2) Reserve breeding pig feeding cost
(3) Pig feeding cost
(4) Variable costs
(5) Total cost
2. Solve for the total cost Income
3. Calculate the litter size based on the break-even point
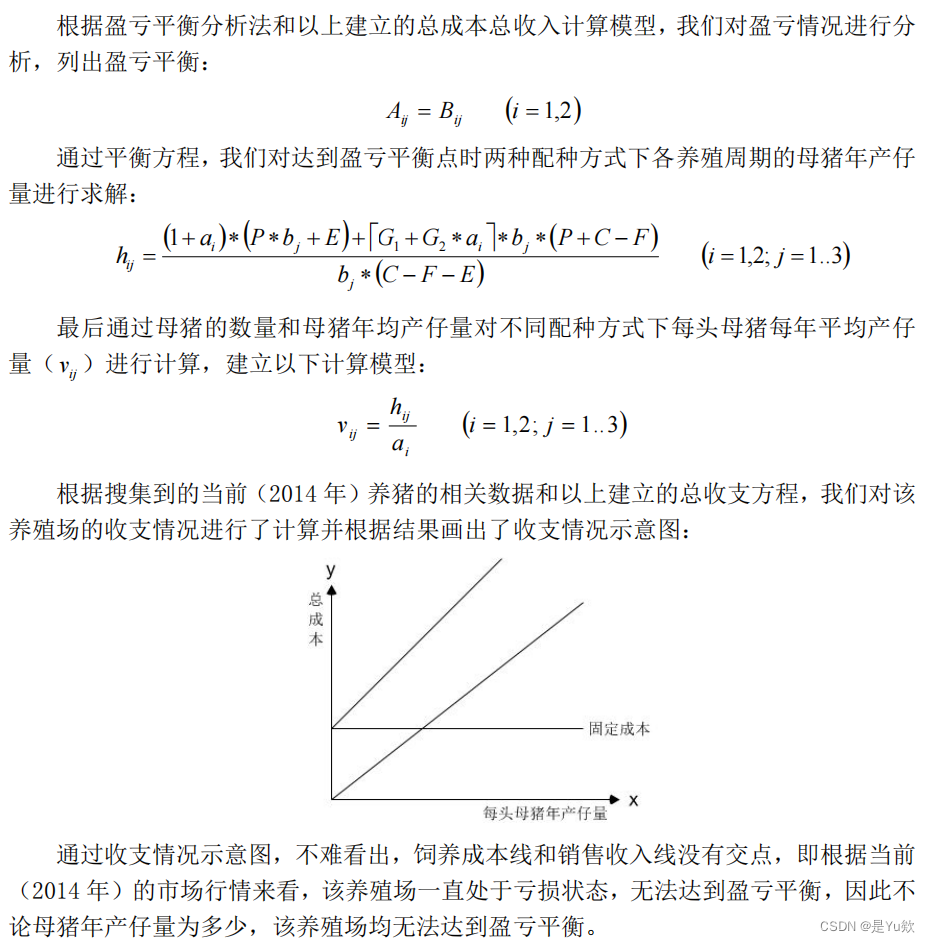
3. Result analysis (highlight!!!)
Under the 2014 pig market, the farm was unable to break even regardless of the breeding method and breeding cycle. Therefore,
we analyzed that if the farm carried out breeding under the pig market conditions of the previous two years, it might reach break even. .
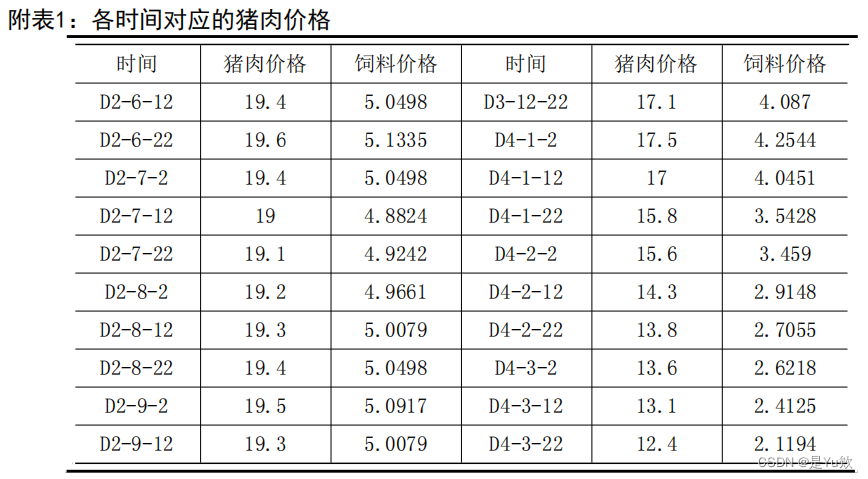
Therefore, we investigated the pig market conditions in 2013 and 2012, and used data such as breeding costs and sales prices in these two years to determine the farm's break-even point and average annual sow litter size.
4. Relevant Suggestions
Through the above solutions to the problems and combined with the pig market conditions, we give some relevant suggestions for the pig breeding industry under the current situation.
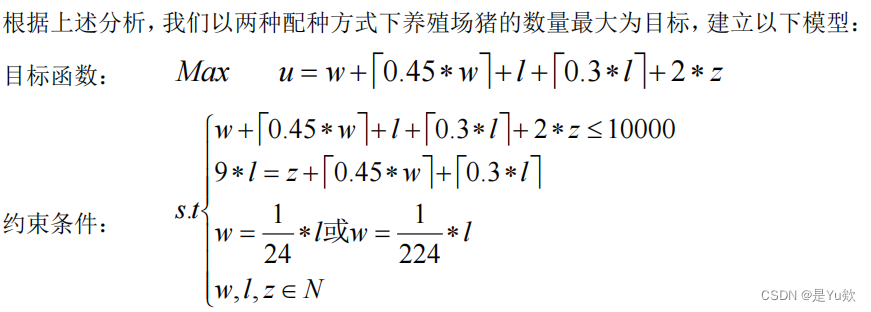
Question 2 (Find the proportion of piglets selected as breeding pigs and the number of sows in stock)
A sow can give birth to two litters per year, and each litter can survive 9 piglets. Find the proportion of piglets selected as breeding pigs and the number of sows in stock when the breeding scale of the farm reaches saturation.
1. Data preparation
1. Breeding pig culling rate
2. Ratio of male and female breeding pigs
2. Solve the proportion and stock number
1. Model preparation
1) Goal establishment
Establish integer programming for the number of piglets z, sows l and boars w
2) Conditional constraints
(1) Maximum breeding scale constraint of the farm
(2) Constraints on the number of piglets
(3) Constraints on the proportion of boars and sows
2. Model establishment
3. Model solution
code (partly modified)
piglet z, sow y and boar x
max=x+@floor(x*0.45)+1+y+@floor(y*0.3)+1+z;
x+@floor(x*0.45)+1+y+@floor(y*0.3)+1+z<=10000;
y*9=z+@floor(x*0.45)+1+y+@floor(y*0.3)+1;
x=(1/24)*y;
@gin(x);
@gin(y);
@gin(z);
@floor(y*0.3)+1=a;
@floor(x*0.45)+1=b;
(a+b)/((2*z+@floor(x*0.45)+1+y+@floor(y*0.3)+1))*100=p;
Result table
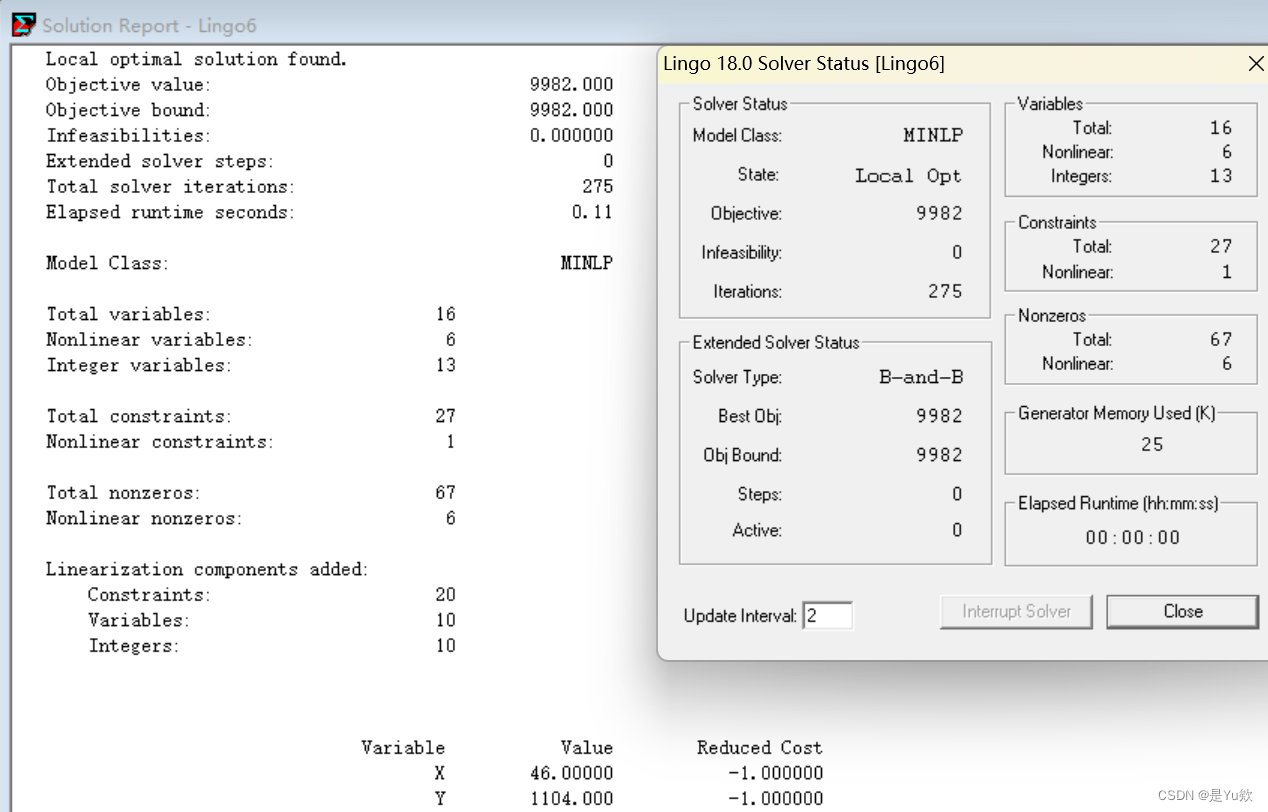
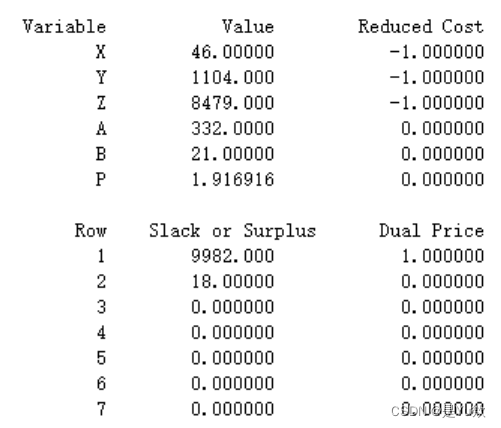
The results may have been optimized and feel unmatched. . . .
Question 3 (Determine the best business strategy and calculate the average annual profit)
1. Fitting the relationship between feed price and sales price
1. Establishing a functional relationship
2. Using the least squares method to fit
(1) Model preparation
① Target establishment
② Constraint conditions
(2) Model establishment
(3) Model solution
2. Determine feed prices for the next three years
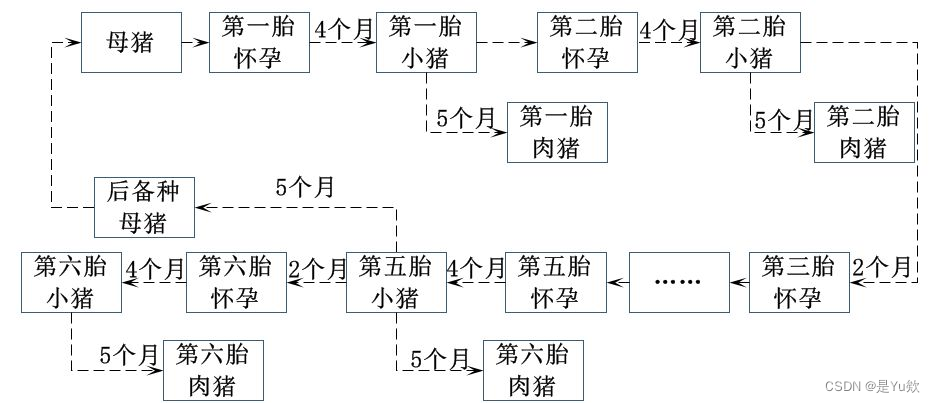
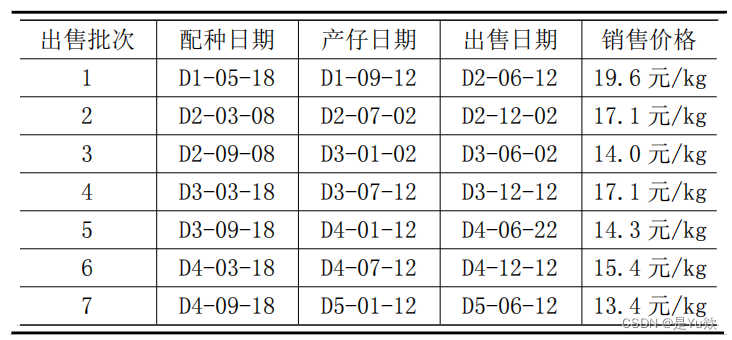
3. Three-year time flow chart of the breeding farm
4. Determine the best business strategy and average annual profit
1. Data preparation
2. Model preparation
1) Target establishment
2) Conditional constraints
3. Model establishment
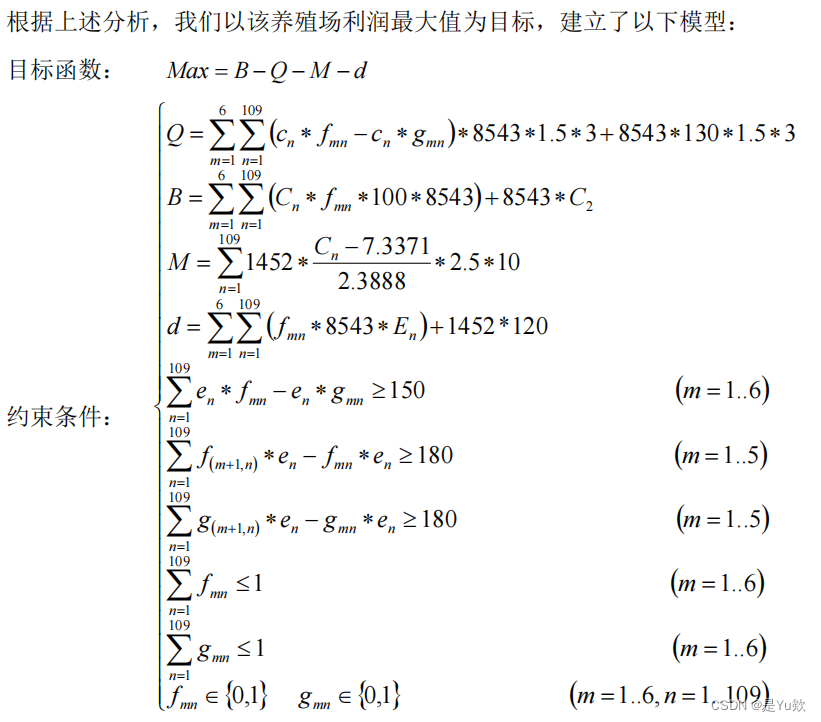
4. Model solution
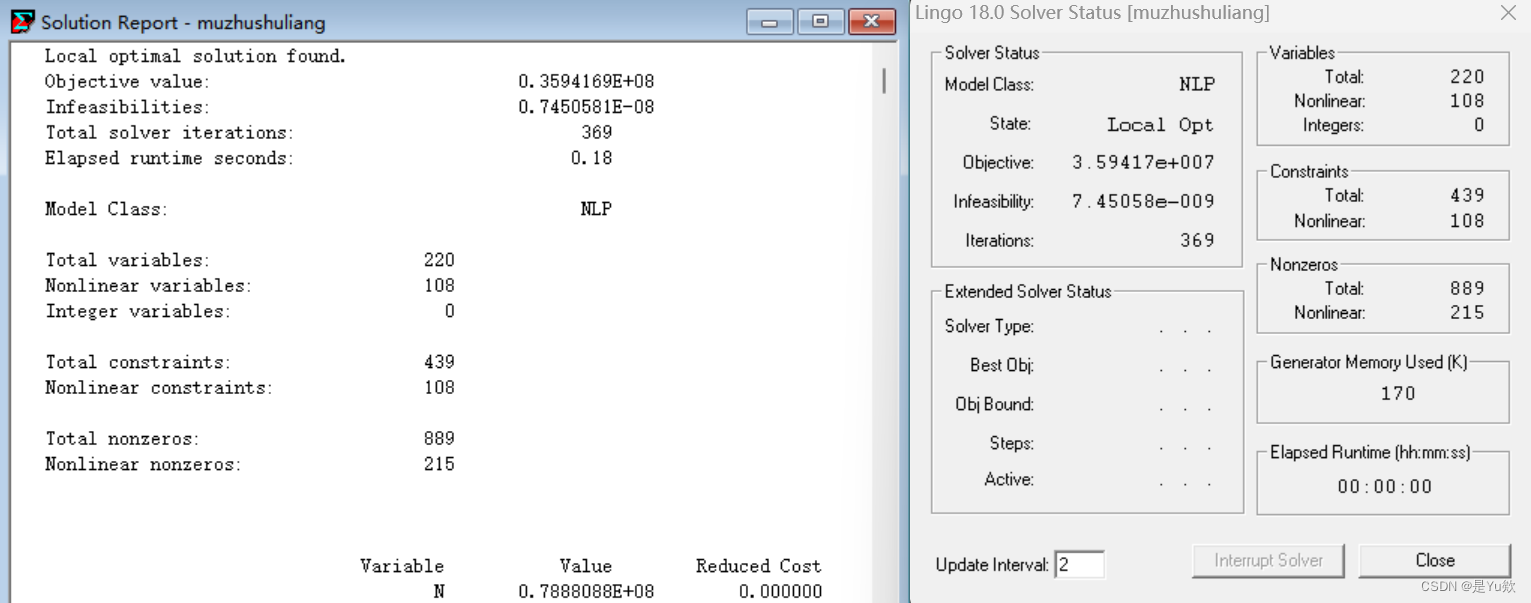
code BQM d
corresponds to nqew in the code
first step
sets:
bb/1..109/:a,b,c;
aa/1..6/:;
cc(aa,bb):f,p;

endsets
data:
a=@text('D:\roujia.txt');
b=@text('D:\biandongfeiyong.txt');
c=@text('D:\tianshujiange.txt');
enddata
max=n-q-e-w;
n=@sum(cc(i,j):a(j)*f(i,j)*100*8543)+8543*a(2);
q=@sum(cc(i,j):(c(j)*f(i,j)-c(j)*p(i,j)))*8543*1.5*3+8543*130*1.5*3;
e=@sum(bb(j):1452*(a(j)-7.3371)/2.3888*2.5*10);
w=@sum(cc(i,j):f(i,j)*8543*b(j))+1452*120;
@for(aa(i):@sum(bb(j):c(j)*f(i,j)-c(j)*p(i,j))>=150);
@for(aa(i)|(i#le#5):@sum(bb(j):f(i+1,j)*c(j)-f(i,j)*c(j))>=150);
!@for(aa(i)|(i#le#5):@sum(bb(j):f(i+1,j)*c(j)-f(i,j)*c(j))<=180);
@for(aa(i)|(i#le#5):@sum(bb(j):p(i+1,j)*c(j)-p(i,j)*c(j))>=180);
@for(aa(i):@sum(bb(j):f(i,j))<=1);
@for(aa(i):@sum(bb(j):p(i,j))<=1);
@for(cc(i,j):@bin(f(i,j)));
@for(cc(i,j):@bin(p(i,j)));
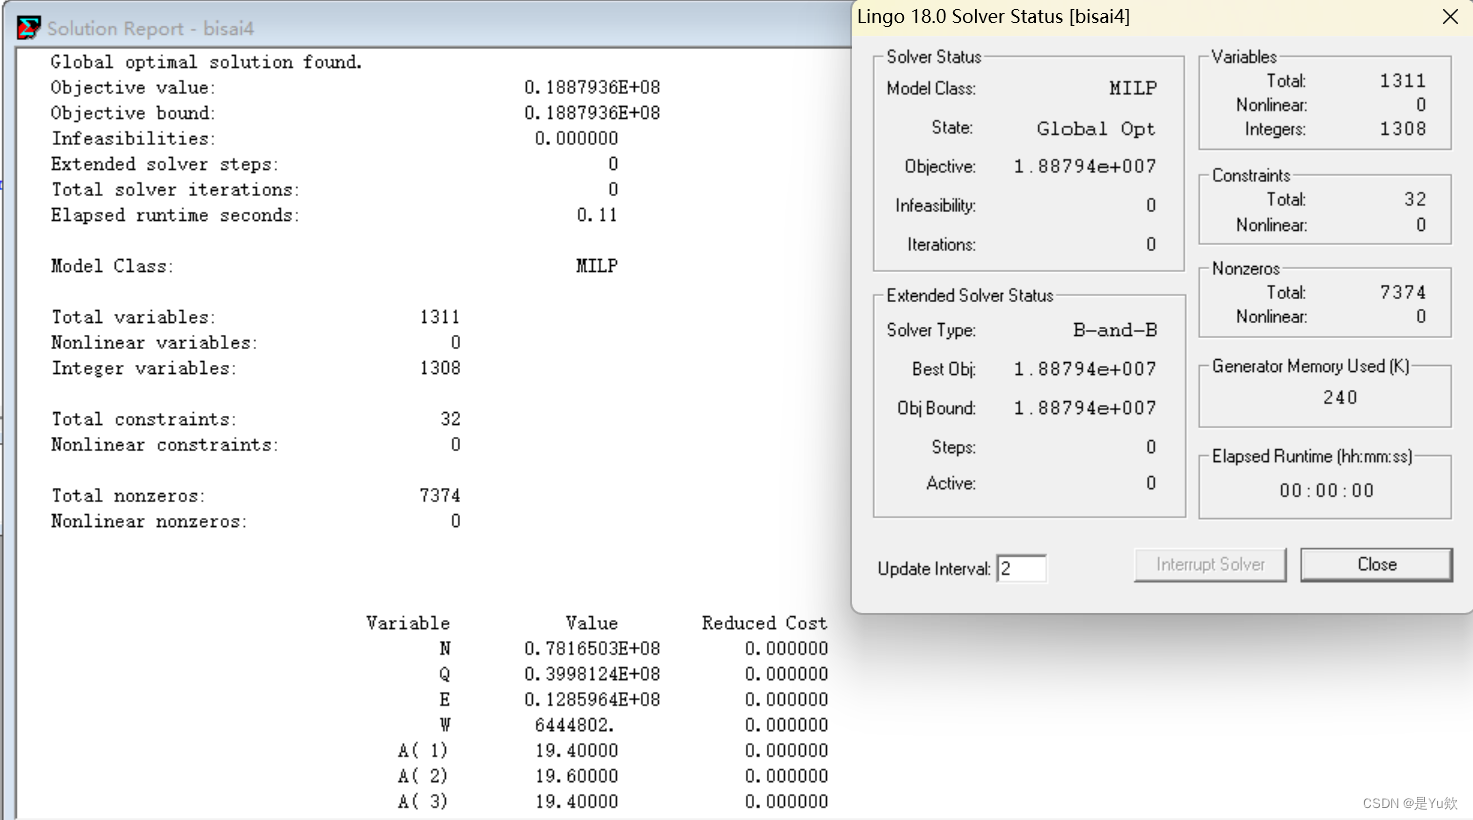
Result table
Schedule (part)
5. Result analysis
Question 4

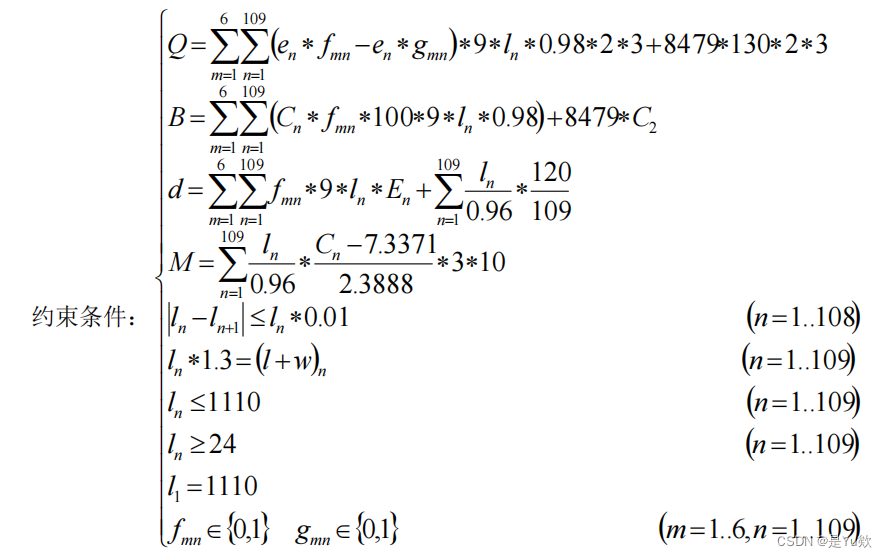
sets:
bb/1..109/:a,b,c,x,y;
aa/1..6/:;
cc(aa,bb):f,p;
endsets
data:
a=@text('D:\roujia.txt');
b=@text('D:\biandongfeiyong.txt');
c=@text('D:\tianshujiange.txt');
f=@text('D:\f.txt');
p=@text('D:\p.txt');
enddata
max=n-q-e-w;
n=@sum(cc(i,j):a(j)*f(i,j)*100*9*x(j)*0.98)+8479*a(2);
q=@sum(cc(i,j):(c(j)*f(i,j)-c(j)*p(i,j))*9*x(j)*0.98*1.5*3)+8479*130*1.5*3;
e=@sum(bb(j):x(j)/0.96*(a(j)-7.3371)/2.3888*2.5*10);
w=@sum(cc(i,j):f(i,j)*9*x(j)*0.98*b(j))+@sum(bb(j):x(j)/0.96)/109*120;
!@for(aa(i):@sum(bb(j):c(j)*f(i,j)-c(j)*p(i,j))>=150);
!@for(aa(i)|(i#le#5):@sum(bb(j):f(i+1,j)*c(j)-f(i,j)*c(j))>=150);
!@for(aa(i)|(i#le#5):@sum(bb(j):p(i+1,j)*c(j)-p(i,j)*c(j))>=180);
x(1)=1110;
@for(bb(j):x(j)<=1110);
@for(bb(j):x(j)>=24);
!@for(bb(j)|(j#le#108):@if(x(j+1)#ge#x(j),x(j+1)*0.1,x(j)*0.1)=@abs(x(j+1)-x(j)));
@for(bb(j)|(j#le#108):@abs(x(j)-x(j+1))<=x(j)*0.01);
!@for(aa(i):@sum(bb(j):f(i,j))<=1);
!@for(aa(i):@sum(bb(j):p(i,j))<=1);
@for(cc(i,j):@bin(f(i,j)));
@for(cc(i,j):@bin(p(i,j)));
@for(bb(j):x(j)*1.3=y(j));
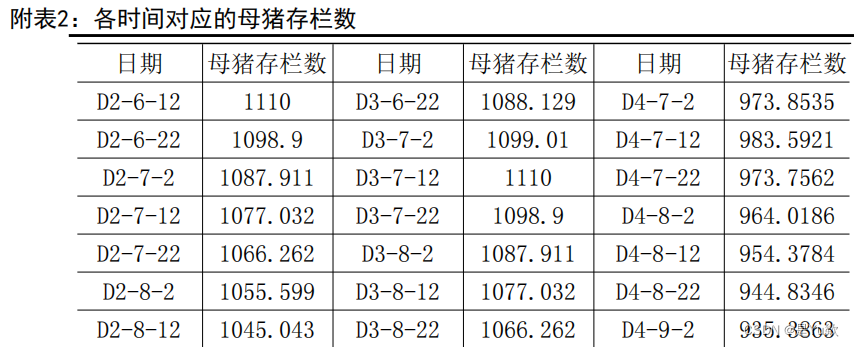
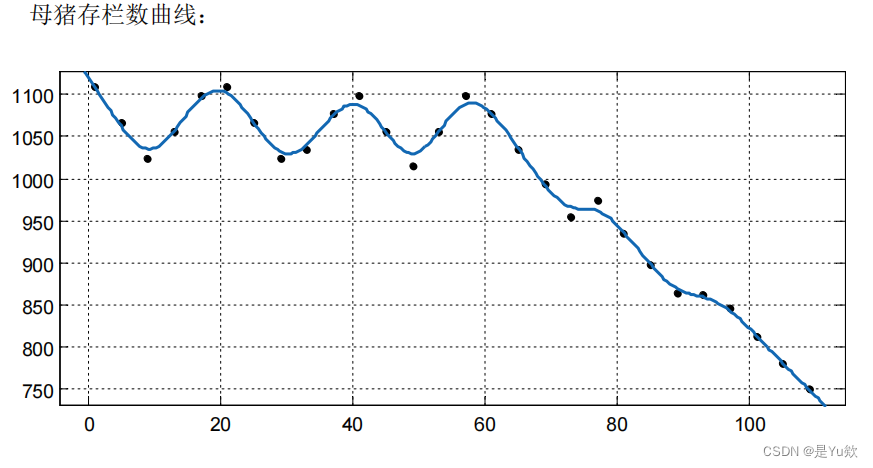
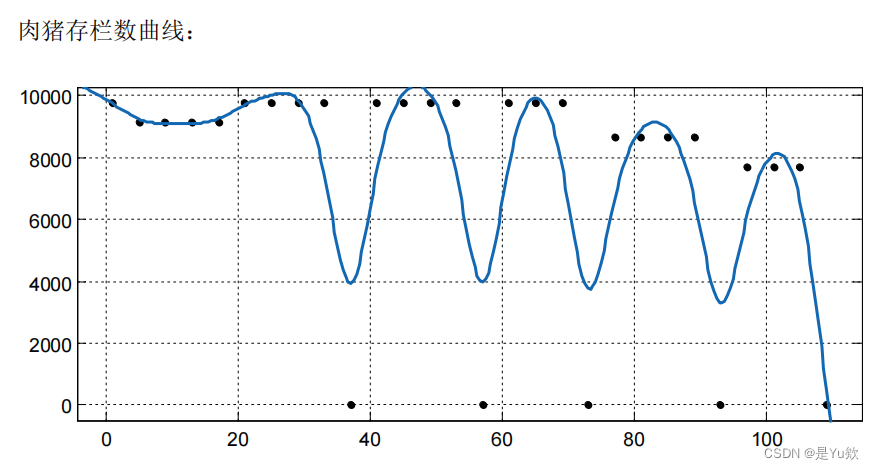
Number of sows
Model promotion and evaluation
1. Good aspects of model evaluation
:
1. Organize and screen the collected data, and use reasonable data in calculations;
2. Use the fitting least squares method to analyze the prediction data, which is more convincing and theoretical;
3. Combine different actual situations to make the established model more scientific and reasonable.
Areas for improvement:
1. The data collected by this model is limited, the calculation accuracy is not high, and the results obtained may be different from the actual situation.
2. Model promotion:
The established model takes into account relatively comprehensive factors and provides detailed business strategies, which can be applied to actual planning.
According to the model established in this article, based on the rising and falling trends of market prices in recent years, we can predict the marketing situation in the next few years, that is, we can make predictions in advance.