Install
npm install --save echarts
main.js introduces echarts:
// 引入 echarts
import * as echarts from "echarts";
const app = createApp(App);
// 全局挂载 echarts
app.config.globalProperties.$echarts = echarts;
Define a dom container in the template tag
<div id="myChart" :style="{ width: '300px', height: '300px' }"></div>
Note: You need to use import * as echarts from 'echarts', but cannot use import echarts from 'echarts', otherwise an error will be reported.
<script>
  import { defineComponent, toRefs, reactive, onMounted } from 'vue'
  import * as echarts from 'echarts'

  export default defineComponent({
    name: 'Histogram',
    setup() {
      const state = reactive({
        option: {
          grid: {
            top: '4%',
            left: '2%',
            right: '4%',
            bottom: '0%',
            containLabel: true,
          },
          xAxis: [
            {
              type: 'category',
              data: ["芳草地国际","实验小学","白家庄小学","外国语小学","师范学校附属","望京东园"],
              axisTick: {
                alignWithLabel: true,
              },
            },
          ],
          yAxis: [
            {
              type: 'value',
            },
          ],
          series: [
            {
              name: '学校',
              type: 'bar',
              barWidth: '40%',
              data: [260,680,360,460,150,320],
            },
          ],
        },
      })
      const initeCharts = () => {
        let myChart = echarts.init(document.getElementById('myChart'))
        // 绘制图表
        myChart.setOption(state.option)
      }

      onMounted(() => {
        initeCharts()
      })

      return {
        ...toRefs(state),
      }
    },
  })
</script>
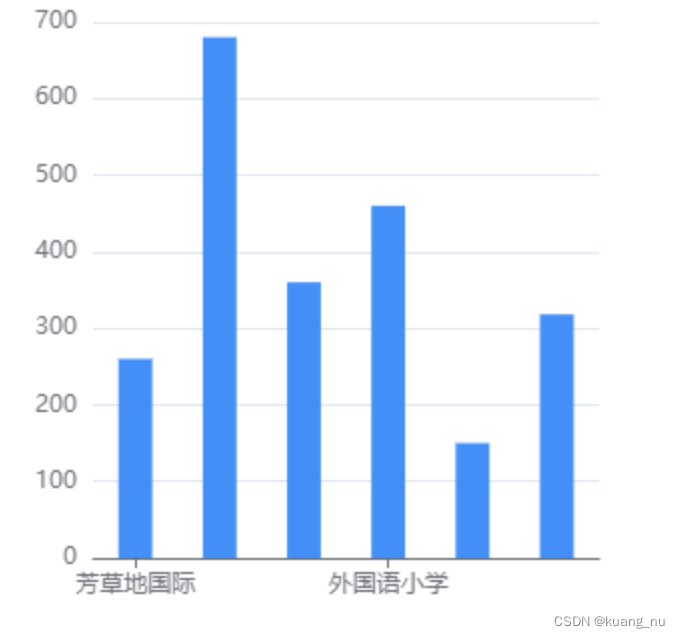
Note: I found that some text content of some column charts was not displayed. I guessed that the reason why it was not displayed was because the text was too long. It happened that the characters on the X axis in the prototype needed to be tilted. There is an axisLabel in the query document xAxis that can be configured.
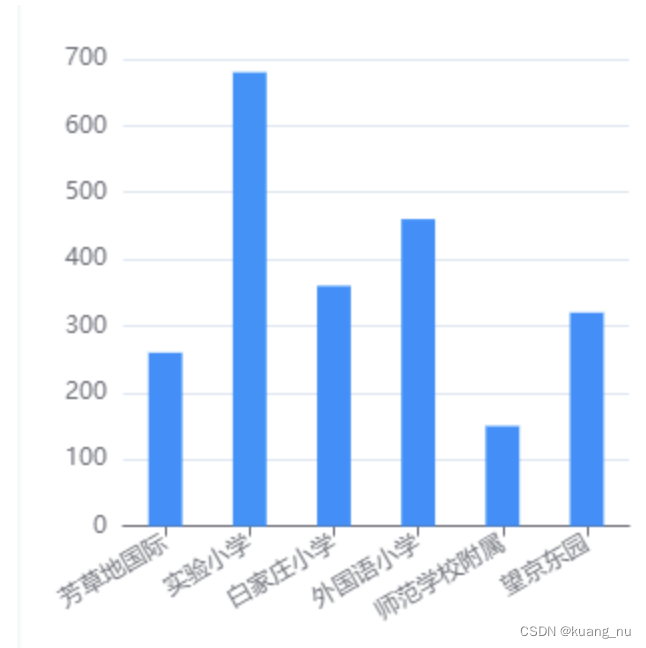
xAxis sets font tilt
xAxis: [
  {
    type: 'category',
    data: [ "芳草地国际", "实验小学", "白家庄小学", "外国语小学", "师范学校附属", "望京东园" ],
    axisTick: { alignWithLabel: true },
    axisLabel: { interval: 0, rotate: 30 },
  },
],
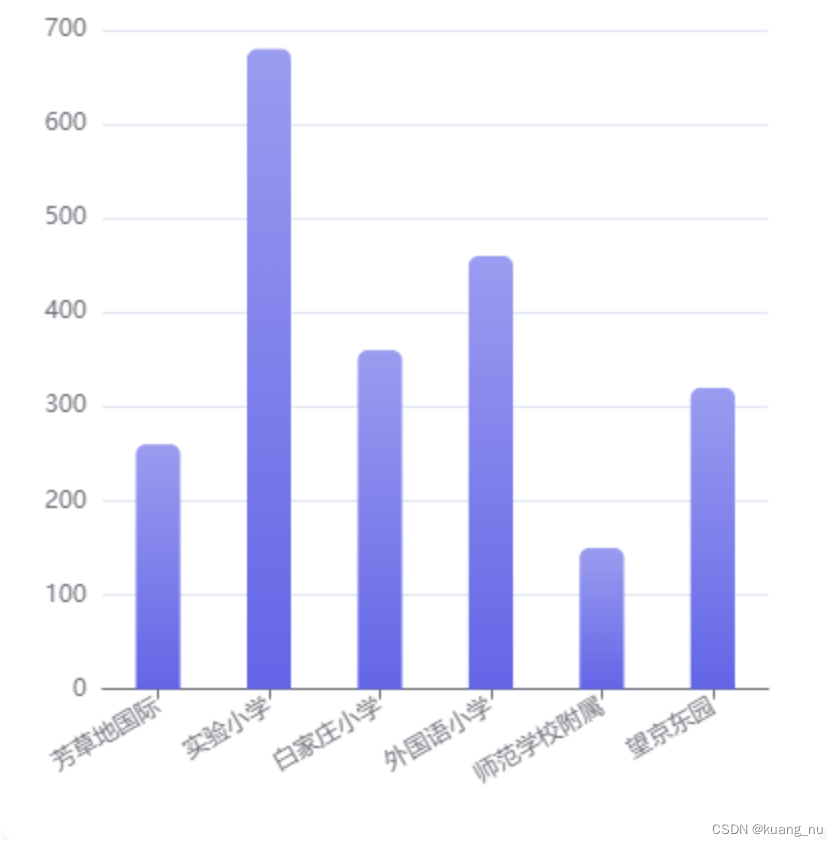
This attribute of itemStyle in series can set the style, set the gradient color through color, and set the rounded corners through barBorderRadius
series: [
{
name: '学校',
type: 'bar',
barWidth: '40%',
itemStyle: {
color: new VabChart.graphic.LinearGradient(0, 0, 0, 1, [
{ offset: 0, color: '#9a9cf6' },
{ offset: 1, color: '#6365ef' },
]),
barBorderRadius: [5, 5, 0, 0],
},
data: [260,680,360,460,150,320],
},
],
Add click event
The document shows that click events can be added through on
constiniteCharts = () => { let myChart = echarts.init(document.getElementById('myChart')) // Draw the chart myChart.setOption(state.option) myChart.on('click', (params) => { console .log(params) // to do }) } After the event is added successfully, clicking on the echarts chart will start many times and print many results.

Use off to close before click event
const initeCharts = () => {
let myChart = echarts.init(document.getElementById('myChart'))
// 绘制图表
myChart.setOption(state.option)
myChart.off('click')
myChart.on('click', (params) => {
console.log(params)
// to do
})
}
After adding it, the data is only printed once, and you can do what you want in the click event.
Create a new js file with a random name, here it is called echarts.js, and place it specifically in the js folder.
Contents that must be present in the echarts.js folder:
//Introduce the echarts core module, which provides the necessary interfaces for echarts use.
import * as echarts from "echarts/core";
/** Introduce bar chart and line chart, the chart suffix is Chart */
import { BarChart, LineChart } from "echarts/charts";
// Introduce prompt box, title, Cartesian coordinate system, data set, built-in data converter component, the component suffix is Component
import { TitleComponent, TooltipComponent, GridComponent, DatasetComponent, TransformComponent, } from "echarts/components"; // Label automatic layout, global transition animation and other features import { LabelLayout, UniversalTransition } from "echarts/features"; // Introduce the Canvas renderer. Note that introducing CanvasRenderer or SVGRenderer is a necessary step. import { CanvasRenderer } from "echarts/renderers"; // Register the necessary components echarts.
TooltipComponent,
GridComponent,
DatasetComponent,
TransformComponent,
BarChart,
LabelLayout,
UniversalTransition,
CanvasRenderer,
LineChart,
]);
// 导出
export default echarts;
Introduce the created echarts.js file into the global main.js:
import App from './App'
//Introduce echarts
import echarts from './common/js/echarts.js'
import {createSSRApp} from 'vue'
let app = createSSRApp(App)
//Mount into the vue instance
/ / Vue.prototype.$echarts = echarts;//vue2 mounting method
app.config.globalProperties.$echarts = echarts;//vue3 mounting method
export function createApp() { return {app} } //Called The time is: this.$echarts.init()