Article directory
reference
Overview
Software Engineering Overview
Definition: Using engineering concepts, principles, techniques and methods to develop and maintain software.
Three elements:
- Methods: Technical methods for completing various tasks of software development, answering "how to do it".
- Tools: An automated or semi-automated software engineering support environment for applying methods.
- Process: A framework of a series of tasks that need to be completed in order to obtain high-quality software, answering "when"
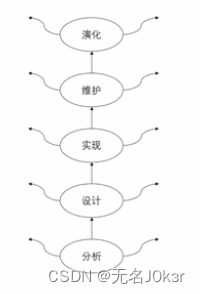
There are three periods and eight stages in the software life cycle.
- Software defined era. The stages included are:
Problem definition stage: What kind of problem does the user need to solve?
Feasibility study stage: whether software development is feasible.
Demand analysis: clarify customer needs and output standardized demand specifications. - The software development period includes the following stages:
overall design: designing the overall structure and determining comprehensive test goals,
detailed design,
coding and unit testing, and
comprehensive testing. - Software maintenance period (longest duration and most expensive)
software operation and maintenance
software process
It mainly includes waterfall model, incremental model, spiral model, fountain model, etc., which is the task framework.
-
Waterfall model
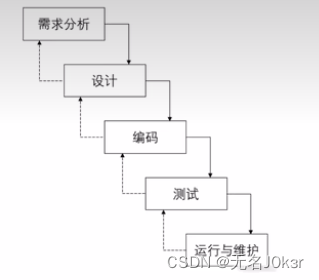
characteristics: It is the most basic software development life cycle model.
Advantages: It facilitates organization and management, and improves the quality and efficiency of large-scale software development.
Disadvantages: The development process is rigid, inconvenient to modify, and difficult to practice -
Advantages of the incremental model
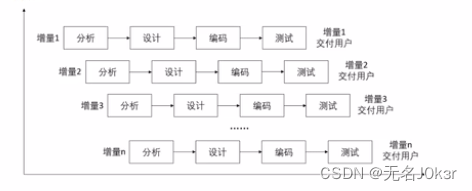
: Flexible personnel allocation and the ability to release some functions to customers first.
Disadvantages: Parallel development runs the risk of being difficult to integrate. -
Features of the spiral model
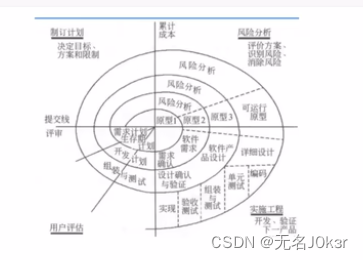 : Risk analysis is introduced, and each spiral cycle is roughly a waterfall model.
Advantages: The design is flexible, easy to change, and requires user evaluation in each cycle.
Disadvantages: Too many iterations lead to high cost. -
Fountain model
features: It is divided into multiple stages, but there are no obvious boundaries, and it can be iteratively crossed.
Feasibility Analysis
Feasibility Analysis Overview
Feasibility analysis: Determine whether the problem can be solved in the shortest time with the least cost.
Feasibility study: Understand customer requirements and demonstrate feasibility from technical, economic, social factors, etc.
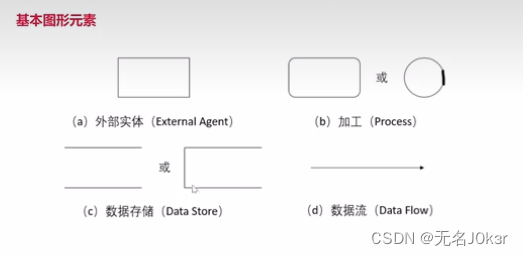
data flow diagram
Data flow diagram, also called data flow diagram DFD, is a graphical tool that facilitates users to understand and analyze system data flow. Its basic elements include:
- External entities: represent the source and destination of data, which are people or organizations outside the software system.
- Processing: The processing of data.
- Data Storage: Static storage of information.
- Data flow: What data is moved.
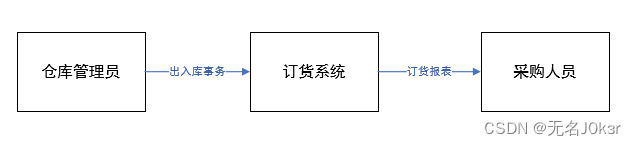
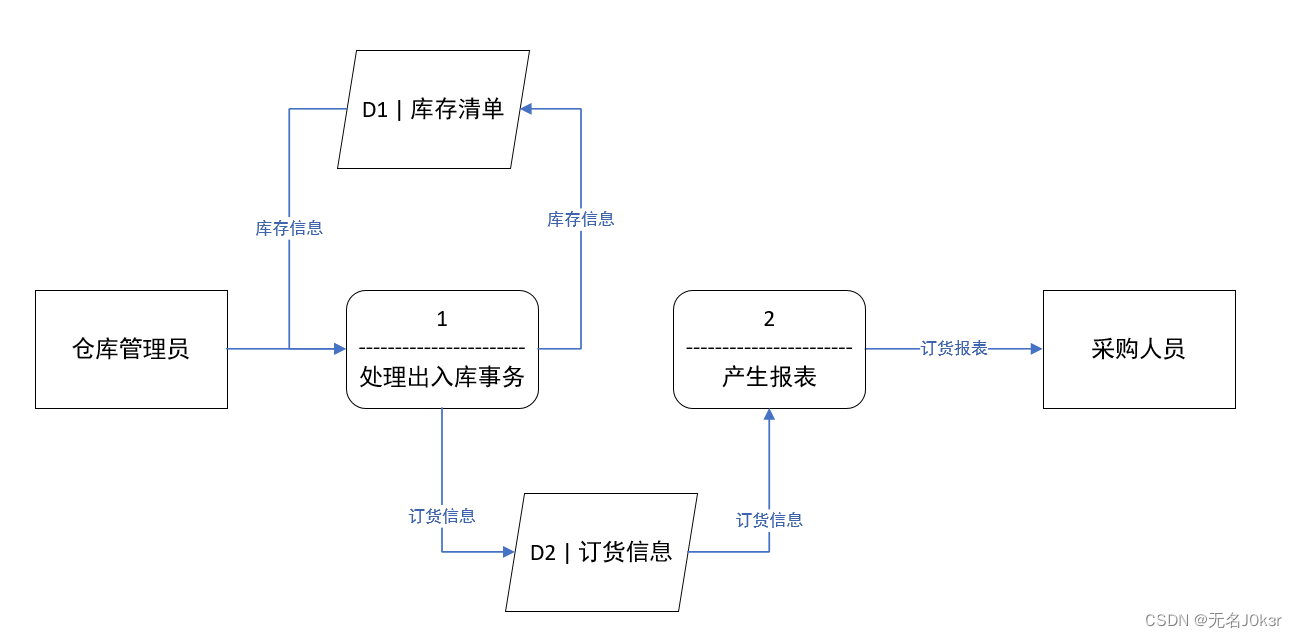
Example: The entry or exit of parts into the warehouse is called a transaction. The entry and exit transactions are reported to the ordering system through the CAT terminal placed in the warehouse. When the inventory quantity of a certain part is less than the threshold, it should be reordered. The purchasing department needs an ordering report every day. The report is sorted by part number. The table lists all parts that need to be reordered. These parts have the following data (part number, part name, order quantity, current price, main supplier, secondary supplier).
Problem solving:
1. Extract the four components of the data flow from the problem description
- Source point and end point: The transaction is reported to the ordering system through the CAT terminal in the warehouse, and then to the purchasing department. The source point is the warehouse administrator and the end point is the purchasing personnel.
- Processing: The purchasing department needs ordering reports, so ordering reports need to be generated. Changing the quantity of parts in and out of the warehouse is also a process.
- Data flow: The first is to report the inbound and outbound transactions from the warehouse to the ordering system, and the second is to send the ordering report to the purchasing department.
- Data storage: information about parts to be ordered and inventory information.
2. Draw a rough model
3. Further refinement
Data Dictionary
The data flow diagram describes the decomposition of the system. The data dictionary is used to describe each data flow, file, processing, data item, etc. in the data flow diagram. There are the following four types of entries:
- Data flow entry: describes the data components (for example: internal number = non-zero number + 3{number}3)
- Data storage entry:
- Data item entry:
- Processing entries:
demand analysis
Requirements Analysis Overview
Definition: Requirements analysis refers to the process in which developers must accurately understand customer requirements, conduct detailed investigations and studies, convert users' informal demand descriptions into complete demand definitions, and then generate software requirements specifications.
ER图
Provides methods for representing entity types, attributes, and relationships.
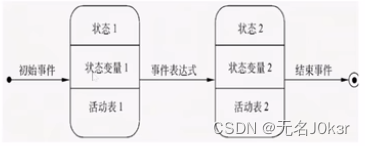
State transition diagram
The behavior of the system is represented by describing the system state and the events that cause the system state transition. Its symbols include:
- Initial state: represented by a solid circle.
- Intermediate state: represented by a rounded rectangle, which can be divided into three parts: upper, middle and lower parts, which respectively represent the name of the state, variable description (optional) and activity table (optional).
- Final state: represented by a pair of concentric circles.
- State transition: represented by arrows. If the transition is triggered by an event, it should be marked on the arrow. If it is not marked, it means that it will be triggered automatically after the internal activities in the original state are executed.