Show results
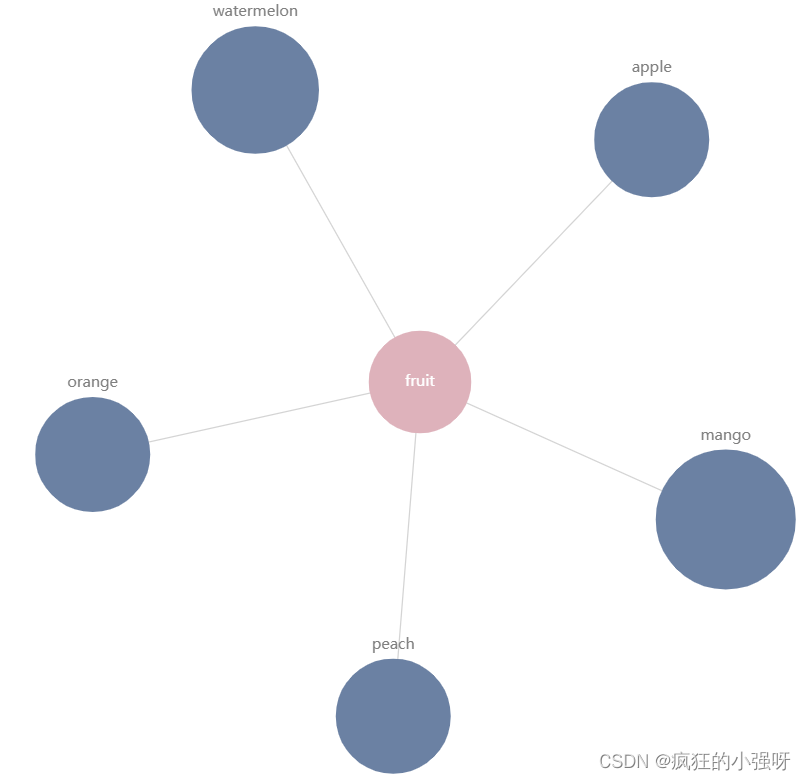
The edge node can be dragged, and its size can change according to the value passed in (for example, I like mangoes more, so I give mangoes a greater weight, and the node where mangoes are displayed displays a larger proportion)
Code download
https://download.csdn.net/download/David_house/88115143