1. Introduction to Jmeter
Apache JMeter is an open source tool software for load function testing and performance testing written in pure java. Compared with Loadrunner, JMeter is small, lightweight and free. It has gradually become a mainstream performance testing tool and is one of the tools that every tester must master.
This article is a complete introduction to JMeter performance testing, from downloading and installing Jmeter to writing a complete performance test script, and finally executing the performance test and analyzing the performance test results.
The running environment is Windows 10 system, the JDK version is 1.8, and the JMeter version is 3.3.
2. Jmeter installation
2.1 JDK installation
Since Jmeter is developed based on Java, you first need to download and install the JDK (currently JMeter only supports Java 8 and does not yet support Java 9)
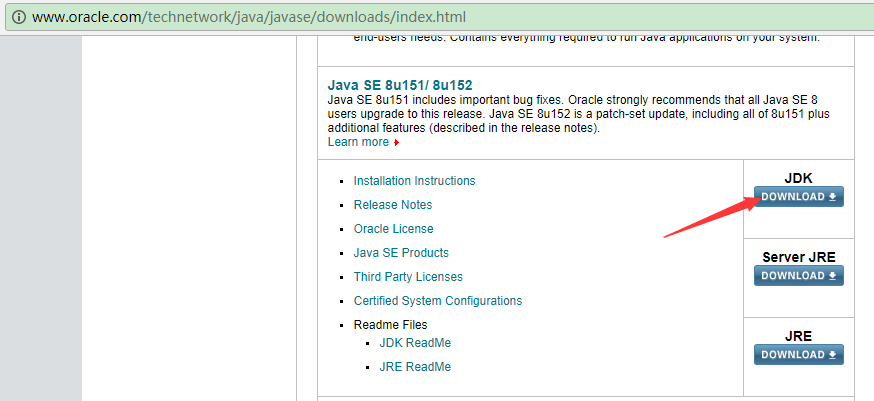
1. Official website download address: Java Downloads | Oracle
2. Select Java SE 8u151/ 8u152 and click JDK download
3. Install the downloaded JDK
4. Configure system environment variables
2.2 JMeter installation
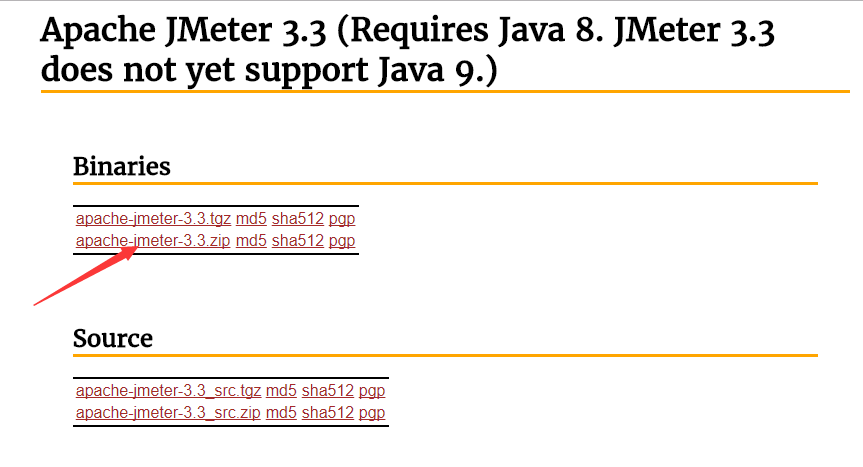
1. Official website download address: Apache JMeter - Download Apache JMeter
2. Download the latest JMeter 3.3 version: apache-jmeter-3.3.zip
3. Unzip the zip package after downloading is complete.
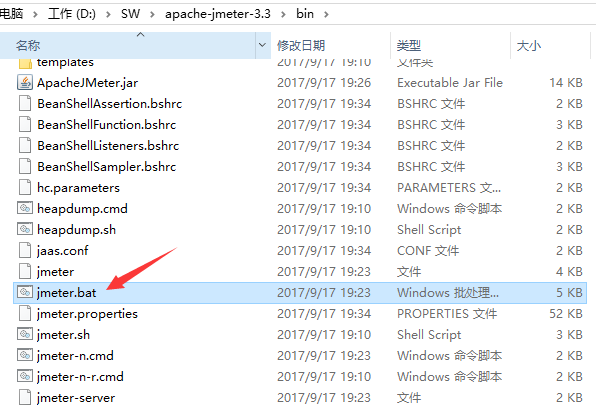
4. Start JMeter
Double-click jmeter.bat under the JMeter decompression path (apache-jmeter-3.3\bin) bin
3. Test examples
We select the most common Baidu search interface:
3.1 Interface address
http://www.baidu.com/s?ie=utf-8&wd=jmeter performance test
3.2 Request parameters
ie: encoding method, the default is utf-8
wd: search term
3.3 Return results
Search results, we can judge the success or failure of this request by checking whether the search result contains the search word wd.
4. JMeter scripting
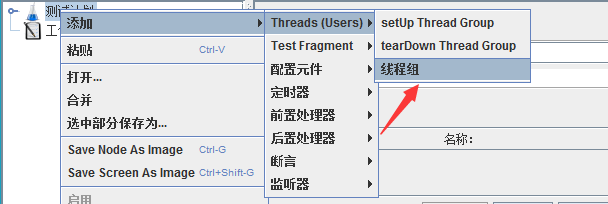
4.1 Add thread group
Right-click "Test Plan" -> "Add" -> "Threads(Users)" -> "Thread Group"
Here you can configure the thread group name, number of threads, preparation time (Ramp-Up Period (in seconds)) number of cycles, scheduler and other parameters:
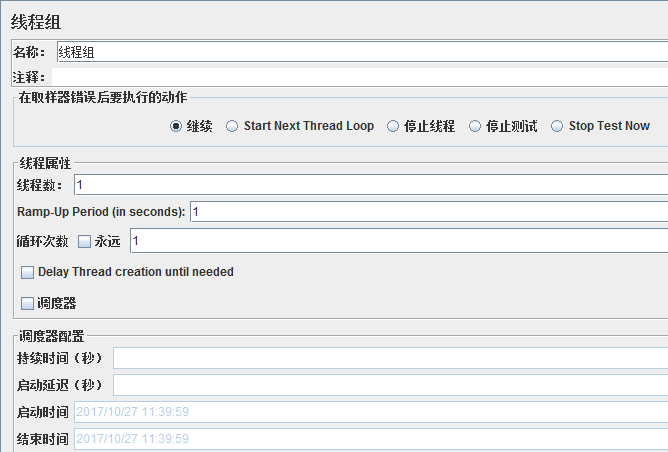
Detailed explanation of thread group parameters:
1. Number of threads: number of virtual users. A virtual user occupies a process or thread. How many virtual users are set here is also how many threads are set.
2. Ramp-Up Period (in seconds) preparation time: How long does it take for the set number of virtual users to start up. If the number of threads is 10 and the preparation time is 2, it takes 2 seconds to start 10 threads, that is, 5 threads per second.
3. Number of cycles: The number of times each thread sends requests. If the number of threads is 10 and the number of loops is 100, then each thread sends 100 requests. The total number of requests is 10*100=1000. If "Always" is checked, all threads will keep sending requests and stop running the script once you choose.
4. Delay Thread creation until needed: Delay thread creation until needed.
5. Scheduler: Set the start time and end time of thread group startup (when configuring the scheduler, you need to check the number of cycles as forever)
Duration (seconds): Test duration, will override end time
Startup delay (seconds): The test delays the startup time, which will override the startup time
Startup time: Test the startup time, the startup delay overrides it. When the startup time has passed, the current time will also override it when manually simply testing.
End Time: The end time of the test, the duration will override it.
Because of the need for interface debugging, we use the default settings for the time being, and come back to configure them later when we actually perform performance tests.
4.2 Add HTTP request
Right click on "Thread Group" -> "Add" -> "Sampler" -> "HTTP Request"
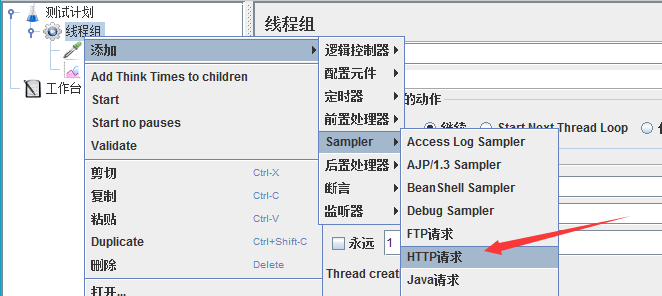
For our interface http://www.baidu.com/s?ie=utf-8&wd=jmeter performance test, you can refer to the following figure to fill in:

Detailed explanation of the main parameters of Http request:
1. Web server
Protocol: send HTTP request protocol to the target server, it can be HTTP or HTTPS, the default is HTTP
Server name or IP: the target server name or IP sent by the HTTP request
Port number: The port number of the target server, the default value is 80
2.Http request
Method: The method of sending the HTTP request, available methods include GET, POST, HEAD, PUT, OPTIONS, TRACE, DELETE, etc.
Path: Target URL path (the remaining part after removing the server address, port and parameters from the URL)
Content encoding: Encoding method, the default is ISO-8859-1 encoding, here is configured as utf-8
3. Send parameters together with the request
For the URL parameters sent in the request, the user can set all the parameters in the URL in this table. Each row in the table is a parameter (corresponding to the name=value in the URL). Note that "encoding" needs to be checked when the parameters are passed into Chinese.
4.3 Add viewing result tree
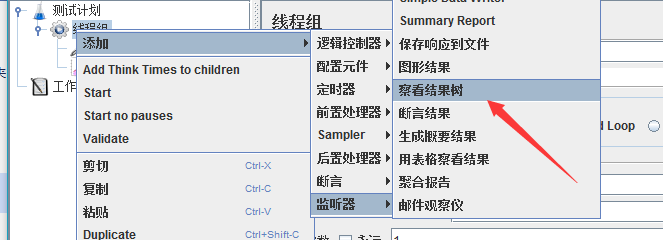
Right click on "Thread Group" -> "Add" -> "Listener" -> "View Result Tree"
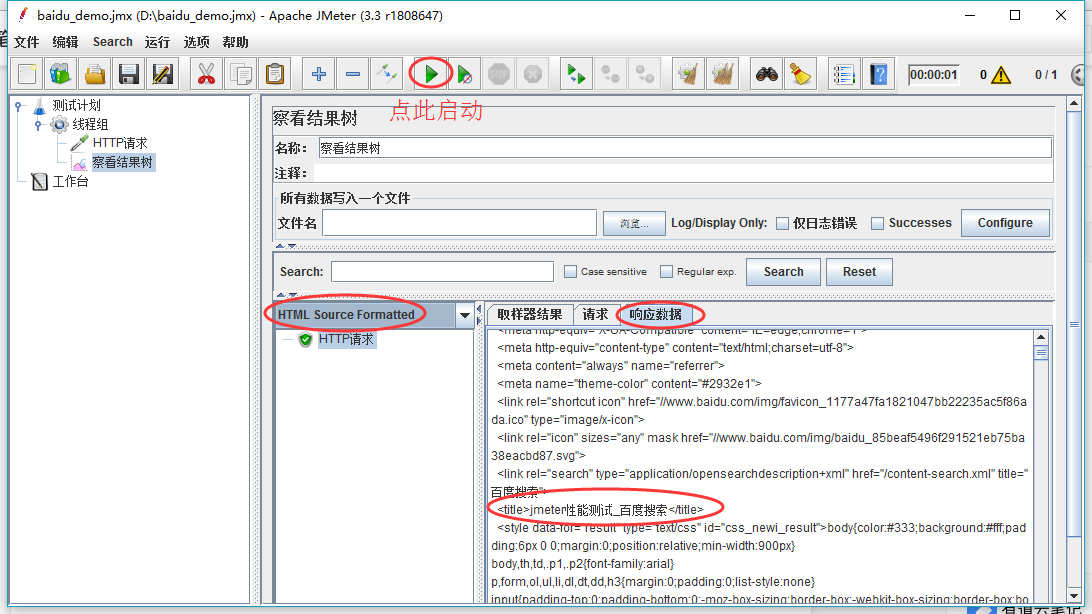
At this time, we run the Http request and modify the response data format to "HTML Source Formatted". You can see that the title of the result page returned by this search is "jmeter performance test_Baidu search".
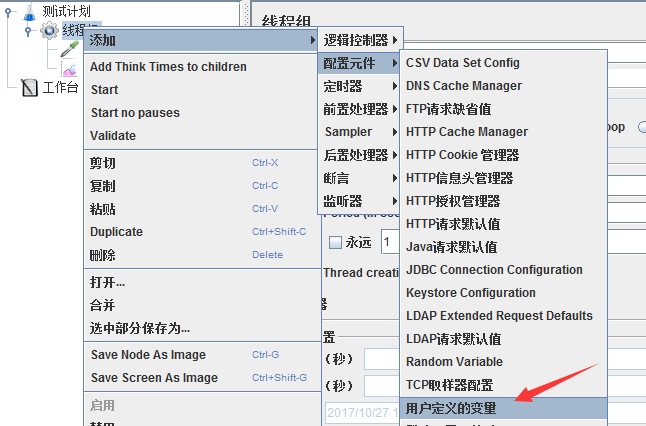
4.4 Add user-defined variables
We can add user-defined variables to parameterize HTTP requests, right-click "Thread Group" -> "Add" -> "Configuration Component" -> "User-Defined Variables":
Add a new parameter wd to store search terms:

And use this parameter in the Http request, the format is: ${wd}

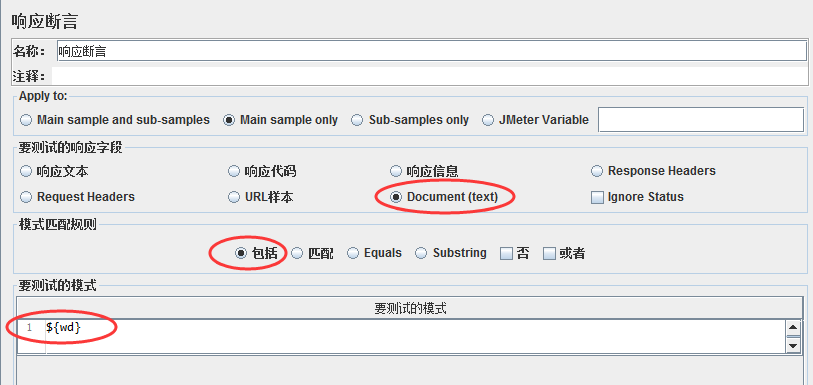
4.5 Add assertions
Right-click "HTTP Request" -> "Add" -> "Assertion" -> "Response Assertion"

We verify whether the returned text contains the search term and add the parameter ${wd} to the pattern to be tested:
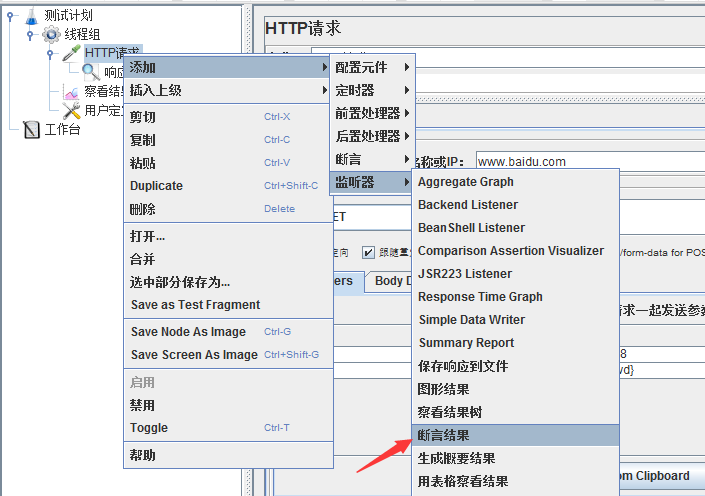
4.6 Add assertion results
Right-click "HTTP Request" -> "Add" -> "Listener" -> "Assertion Result"
At this time, we can see whether the assertion result is successful or failed by running it again.

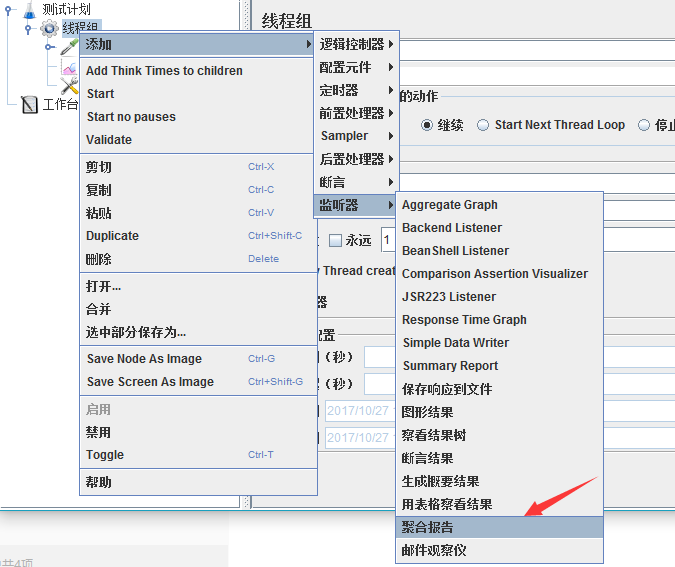
4.7 Add aggregate report
Right-click "Thread Group" -> "Add" -> "Listener" -> "Aggregate Report" to store the performance test report
In this way, we have completed the JMeter performance test script writing of a complete Http interface.
5. Perform performance testing
5.1 Configure thread group
Click on the thread group to configure parameters related to this performance test: number of threads, number of cycles, duration, etc. Here we configure the number of concurrent users to 10 and the duration to 60s

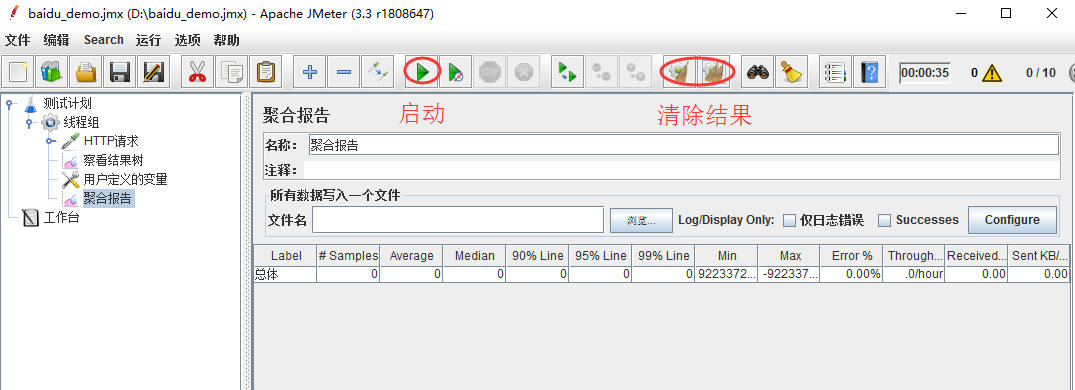
5.2 Executing tests
Click the small green arrow button to start the test. Before testing, you need to click the small broom button to clear the previous debugging results.
6. Analyze test reports
After the performance test is completed, open the aggregate report and you will see:

Detailed explanation of aggregation report parameters:
1. Label: Each JMeter element (such as HTTP Request) has a Name attribute. What is displayed here is the value of the Name attribute.
2. #Samples: Number of requests - indicates how many requests were issued in this test. If 10 users are simulated and each user iterates 10 times, then 100 will be displayed here.
3. Average: average response time - by default it is the average response time of a single Request. When a Transaction Controller is used, the average response time is displayed in Transaction units.
4. Median: Median, which is the response time of 50% of users
5. 90% Line: 90% of users’ response time
6. Min: Minimum response time
7. Max: maximum response time
8. Error%: Error rate - number of incorrect requests/total number of requests
9. Throughput: Throughput - by default, it represents the number of completed requests per second (Request per Second). When a Transaction Controller is used, it can also represent the number of Transaction per Second similar to LoadRunner.
10. KB/Sec: The amount of data received from the server per second, which is equivalent to Throughput/Sec in LoadRunner
Generally speaking, the data we need to focus on during performance testing are: #Samples number of requests, Average response time, Min minimum response time, Max maximum response time, Error% error rate and Throughput throughput .
7. Source code download
So far, we have used JMeter to complete a complete Http interface performance testing process, from script writing, execution to final result analysis.
[Performance Testing] Finally, there is a comprehensive set of performance testing tutorials! Real enterprise performance testing full process project practice!