Part1: The introduction of data is basically the same as the previous linear regression

Part2: Data analysis - that is, the "standardization" of data
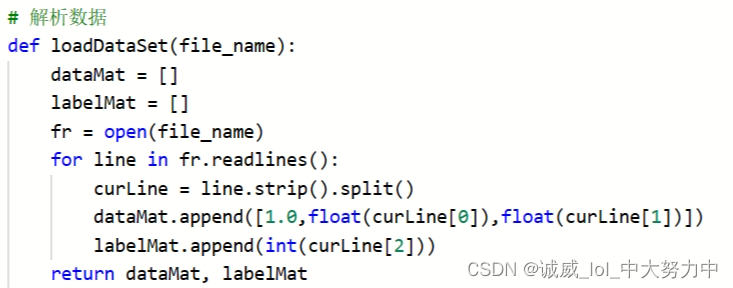 First, we plan to use dataMat[] and labelMat[] data to store feature and label, and the file variable fr
Then, there is this for line in fr.readlines() loop, which reads the string line by line into line.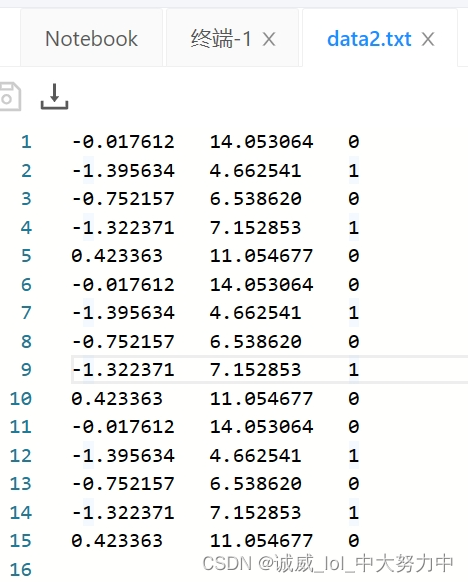
For example, in the data in data.txt above, there are 3 data in one line separated by "\t" tab characters. The result is that these 3 data are used as 3 data in the one-dimensional array curLine[].
dataMat stores [1.0,curline[0],curline[1]] as an array of elements, a total of 15 groups
labelMat, stores an array of curve[2] as elements, a total of 15 groups
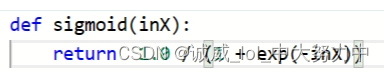
part3: define that sigmoid function
part4: By inputting dataMat and labelMat as the training set, calculate the slope of the dividing line through linear gradient descent.
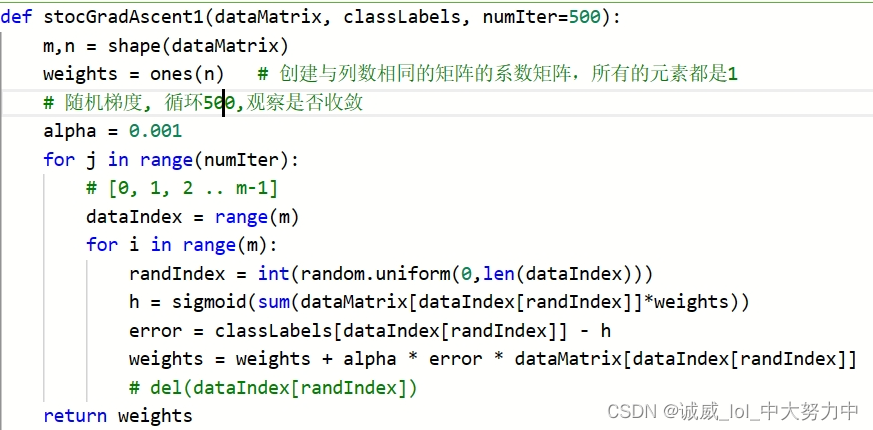 (1) The specific process should be how to calculate the corresponding dividing line of logistic regression through the data in the training set. For details, please refer to the logistic regression related code of teacher Li Hongyi.
(2) The alpha inside is the learning rate. You can observe the results by setting different learning rates and cycle times.
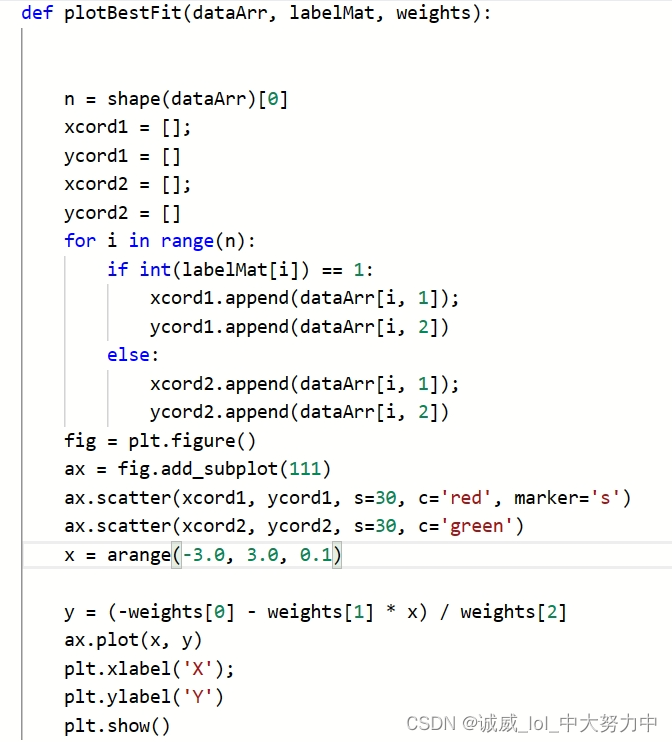
Part 5: Draw the data of the points that need to be tested and mark the labels with colors. Finally, draw the dividing line obtained from the training set.
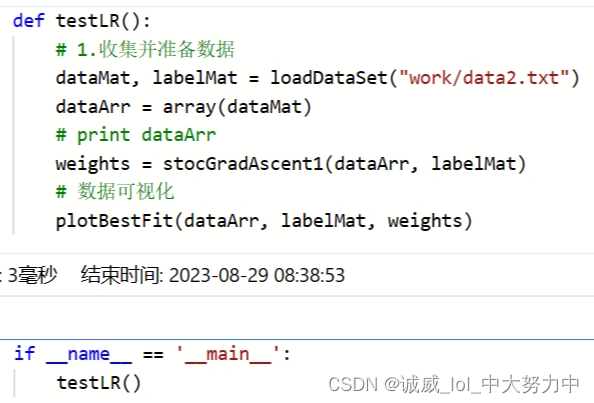
part6: Call the function defined above and get the final result:

In fact, this code and data.txt are not good at all.
(1) It only has a training set, and the final results are only tests done on the training set.
(2) data.txt looks like there are 15 sets of data, but in fact there are only 5 sets, all of which are repeated, so the final graph only has 5 points.