Regardless of whether it is Loadrunner or jmeter for performance testing, the test process is basically the same. Limit the analysis of the test process to Jmeter as an example:
1. Performance testing requirements analysis
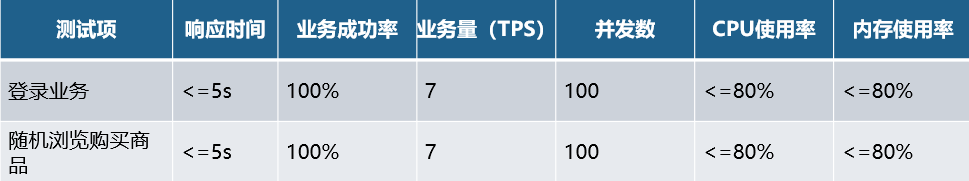
Generally speaking, the performance requirements of the object under test will be given in the user requirements specification, such as the number of visits per unit time, the business response time should not exceed, the business success rate should not be lower, and the hardware resource consumption It should be within a reasonable range, and the performance indicators should be given in quantitative data. For a standardized product, the product team will give the following performance requirements:

If the product team does not specify the performance testing requirements, or only gives literal requirements, such as: the TPS of the system needs to be more than 300, and the single transaction time does not exceed 3 seconds, how can the test engineer quantify the indicators in advance?
It is necessary to further decompose and extract explicit and implicit requirements in combination with business requirements and system characteristics, which can be determined from the following two user methods:
1. Business users
- Frequently used by users, and there are business processes frequently used by a large number of users
- Business processes with a high proportion of transactions, with a daily proportion of more than 80% or even higher
- Business processes with special trading days or peak transactions accounting for more than 80% or even higher
- Poorly performing and tuned business processes
- special business scenarios
- The core business sends a business process with major process adjustments
The above are the performance requirements that may be required at the business user level, and research may be conducted on end users in actual projects.
2. Project team (business system)
- The business that has adjusted the architecture design after testing the performance
- Logically complex and critical business
- Potentially resource-intensive business
- There is an interface call with an external system and a business with a large amount of data interaction
- Call third-party business components, logic complex business
The above are the performance requirements that may be required from the perspective of project development. Performance test engineers need to work closely with the development team to gain an in-depth understanding of the tested objects.
3. Case analysis
Through analysis, we take the online shopping mall performance demand index as an example and get the following data:
2. Test case design and test data preparation
1. Test case design
In order to truly reflect the possible performance problems of the object under test, it is necessary to simulate the business scenario where the object under test may have bottlenecks as much as possible. The business type has been determined during the test requirement analysis process. Here, the following performance test scenarios need to be designed:

2. Test data preparation
Taking this test as an example, 50,000 users log in within 2 hours, which means that there are 50,000 available accounts (prepare as many as possible, it can be 60,000), which can be added directly to the database, but requires relative familiarity with the database structure; You can use Jmeter to record the registration script, use 3 threads, and loop 2000 times.
After the test data is constructed, the database needs to be backed up for later regression testing, and NaviCat can be used for data backup.

3. Performance test script development
- According to the login business model, use BadBoy to record the user login process and generate Jmeter scripts
- Login username for parameterization
- Set the timer: refer to the test case to input information for 5s, wait for the return after successful login for 3s, and wait for the return after successful exit
- Set an assertion for the login success page, if it fails, it will prompt information, if it succeeds, it will not prompt
- Add view result tree, aggregate report, etc., to view script running status in real time

4. Scene design and resource monitoring
1. Scene Design
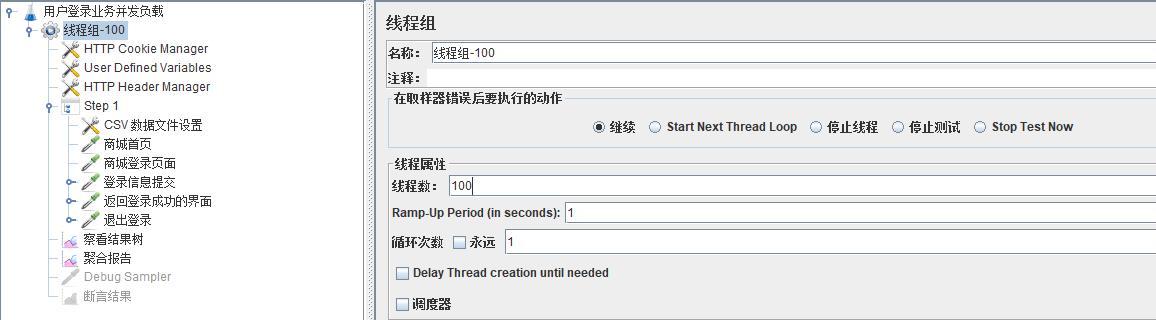
Taking the login business as an example, the purpose of this test is to verify whether the platform can support concurrent logins of 100 users without considering the duration. According to the corresponding scenario test case, set the thread group data, and the script can be used universally (if necessary, it can be removed) think time, add rendezvous points, etc.).
The corresponding thread group can be renamed to the scene name: user login business concurrent load.
2. Jmeter uses its own plug-in for resource monitoring
- Unzip JMeterPlugins-Extras-1.4.0.zip and JMeterPlugins-Standard-1.4.0.zip to Jmeter installation directory /lib/ext
- Restart Jmeter, add listener: jp@gc - PerfMon Metrics Collector
- Download ServerAgent-2.2.3.zip, and upload it to the specified directory of the server (Linux) through the rz command, and execute unzip -o ServerAgent-2.2.3.zip to decompress the file to the current directory
- Turn off the server firewall: systemctl stop firewalld.service
- Set execution permissions for the startup file: chmod u+x startService.sh
- Execute the sh file: ./startService.sh
- Jmeter listener jp@gc - Under PerfMon Metrics Collector, add monitored resources, such as CPU, memory, etc.
- Run the scene to monitor the corresponding resources of the server
According to the requirements of the scenario use case, the number of threads needs to be set to 78 for the business volume test, and the execution time period needs to be set at the same time (refer to the business volume index: 50,000 transactions or TPS are completed in 2 hours), and the settings are as follows:

5. Scenario execution and result analysis
1. Scenario execution
Before the scenario is executed, it is necessary to confirm the test environment to ensure that all environments and system services can be used normally:
- Database recovery (avoiding the impact on the amount of data in the database during the script design process), recording relevant data such as commodities and transactions
- Randomly purchase goods, in order to avoid the situation of zero goods inventory, set the inventory uniformly to 1000
- Try to deploy the server separately on the Linux system to avoid the impact of Jmeter on server performance
- Before execution, start the corresponding monitoring agent and apache and mysql services
Non-GUI mode execution scenario under CMD:
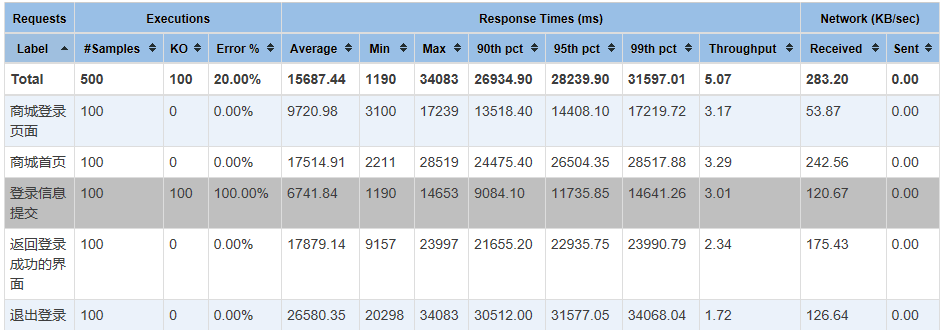
Jmeter -n -t 测试脚本Jmx文件 -l 日志文件名 -e -o HTML测试结果文件路径2. Scenario result analysis
Combined with the aggregation report, analyze the average response time of each request of the login business: 15s, which is less than 5s, so this indicator test fails; when the maximum and minimum response times differ greatly, we can use 90% transaction response time as standard.
Apdex (Application Performance Index) indicator is an international standard. It is the quantitative value of users' satisfaction with application performance. It provides a unified measurement and user experience method, so that the end user's experience and application performance can be measured uniformly. In the figure below, 0 means no satisfaction, and 1 means all users are satisfied. , is the goal pursued by the development team.

6. Performance tuning and regression testing
After the test result analysis is completed, the performance problem can be determined and optimized. Usually, the performance problem is manifested in the following aspects:
1. Response time problem:
- The response time is stable but long, and the response time is long during the test, even if the number of threads (load) is reduced, it will not decrease
- The response time gradually becomes longer. During the test, the load remains the same. The longer the running time, the longer the response time until many errors occur.
- The response time changes with the change of the load, and the response time becomes longer; the load decreases, the response time becomes shorter, and the resource utilization rate also decreases
- Data accumulation leads to lock, and it runs normally at first, but when the amount of data accumulates to a certain value, an error occurs immediately, which cannot be eliminated, and the system can only be restarted
2. Stability issues:
In a specific scenario or after running for a long time, problems suddenly appear and the system runs slowly. The main reasons are as follows:
- Insufficient physical memory resources
- memory leak
- resource contention
- External system interaction
- Frequent retries when business fails, no termination status
- Middleware configuration is unreasonable
- The database link setting is not reasonable (number of connections or cache)
- Process/thread design error
Finally: The complete software testing video tutorial below has been sorted out and uploaded, and friends who need it can get it by themselves [Guaranteed 100% free]

Software Testing Interview Documentation
We must study to find a high-paying job. The following interview questions are the latest interview materials from first-tier Internet companies such as Ali, Tencent, and Byte, and some Byte bosses have given authoritative answers. Finish this set The interview materials believe that everyone can find a satisfactory job.