The difference between java jvm memory overflow and memory leak
1. Conceptual distinction
1.1、 内存泄露 memory leak
After the program finishes running, the occupied memory space is not released.
One memory leak might not seem like a big deal, but memory leaks keep accumulating, and eventually the available memory becomes less and less.
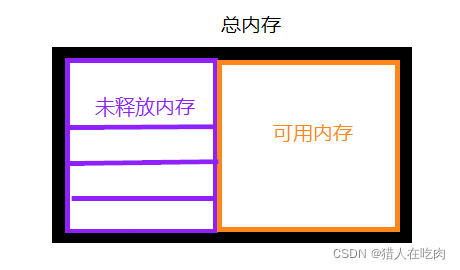
For example, if the total memory size is 100 MB, and 40MB of memory cannot be reclaimed, only 60MB is available. This 40MB is the memory leak.
A memory leak is the memory that is not released after the program runs.
1.2、 内存溢出 out of memory
When the program is running, when applying for memory space, there is not enough memory space for its normal use, the program stops running, and a throw is thrown out of memory .
For example, a 10MB space is applied for when the program is running, but the current available memory is only 5MB, and the program cannot be executed normally, which is memory overflow.
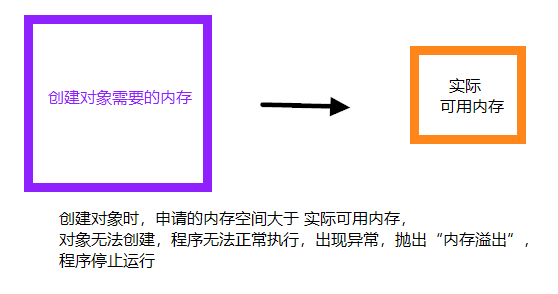
Memory overflow can be understood as the memory required by the program to run is greater than the currently available memory.
1.3 Example
1) In the singleton mode, the life cycle of the singleton is as long as the application program, so if the singleton program holds a reference to the external object, then the external object cannot be recycled, which will lead to memory leaks generation.
2) Some resources that provide close are not closed, resulting in memory leaks . Database connection (dataSource.getConnection()), network connection (socket) and IO stream connections must be closed in finally, otherwise they cannot be recycled.
3) When reading large files, the file read at one time is larger than the available memory, which will cause memory overflow . The available memory is 1G, how to read 2G files? Create a 100MB byte array and read it 10 times.
2. The difference and connection between the two:
2.1. Differences
Memory leak: After the program finishes running, all the memory occupied is not released.
Memory overflow: When the program is running, the required memory is greater than the currently available memory. If the memory is insufficient, the program cannot continue to execute, and "memory overflow" is thrown, and the program is interrupted and terminated.
2.2. Contact
One memory leak may have no obvious impact on program operation, and multiple memory leaks will eventually lead to memory overflow .
For example, the total memory size is 100MB. After a program runs, 10MB has not been released, and the current available memory is 90MB, and the program can still run. However, after multiple runs, the available memory is finally 0. When there is no available memory or insufficient memory, the next time the program runs, memory overflow will occur due to insufficient memory .
3. Causes and solutions of memory overflow
3.1. Reasons for memory overflow
There are many reasons for memory overflow, the editor lists the following common ones:
- The amount of data loaded in the memory is too large, such as taking too much data from the database at one time;
- There are references to objects in the collection class, which are not cleared after use, so that the JVM cannot be recycled;
- There is an infinite loop in the code or the loop generates too many repeated object entities;
- Bugs in the third-party software used;
- The startup parameter memory value is set too small.
3.2. Solutions for memory overflow:
The first step is to modify the JVM startup parameters and directly increase the memory. ( -Xms , -Xmx parameters must not forget to add)
The second step is to check the error log to see if there are other abnormalities or errors before the "OutOfMemory" error.
The third step is to walk through and analyze the code to find out where memory overflow may occur.
Focus on the following points:
1.检查对数据库查询中,是否有一次获得全部数据的查询。
	一般来说,如果一次取十万条记录到内存,就可能引起内存溢出。
	这个问题比较隐蔽,在上线前,数据库中数据较少,不容易出问题,上线后,
	数据库中数据多了,一次查询就有可能引起内存溢出。因此对于数据库查询尽量采用分页的方式查询。

2.检查代码中是否有死循环或递归调用。

3.检查是否有大循环重复产生新对象实体。

4.检查对数据库查询中,是否有一次获得全部数据的查询。
	一般来说,如果一次取十万条记录到内存,就可能引起内存溢出。
	这个问题比较隐蔽,在上线前,数据库中数据较少,不容易出问题,
	上线后,数据库中数据多了,一次查询就有可能引起内存溢出。因此对于数据库查询尽量采用分页的方式查询。

5.检查List、MAP等集合对象是否有使用完后,未清除的问题。
	List、MAP等集合对象会始终存有对对象的引用,使得这些对象不能被GC回收。
The fourth step is to use the memory viewing tool to dynamically view the memory usage.
4. Reprint
https://www.cnblogs.com/Sharley/p/5285045.html