
I am Liyuan Breeze. As a veteran in the IT industry for 25 years, today I will talk about the PDM diagrams commonly used when critical path issues are involved in software engineering practice under the Windows platform.
PDM diagram
We use engineering examples to fully explain the node representation of the PDM diagram, ES (earliest start time), LS (latest start time), EF (earliest completion time), LF (latest completion time) derivation, and the derivation of the critical path.
project description
The builder of a system integration project required that the system must be delivered within the time limit stipulated in the contract. The project manager of the contractor decided to strictly implement project progress management to ensure that the project was completed on schedule. The manager decides to use the critical path method to compile the project schedule PDM diagram. After a careful analysis of the work breakdown structure, the manager gets a work list that includes the sequence of activities and a preliminary estimate of the duration of each activity, see below.
Activity relationship and duration list
Activity code Pre-order activity Activity duration/day
A - 5
B A 3
C A 6
D A 4
E B、C 8
F C、D 5
G D 6
H E、F、G 9
(1) Draw the PDM diagram of the system integration project.
(2) Label ES, LS, EF, LF of each node.
(3) Find the key path of the PDM graph.
The method of finding ES, LS, EF, LF of each node in the PDM diagram and finding the critical path is generally divided into the following 6 steps:
Step 1: Convert the worksheet to a PDM diagram.
We use rectangles to represent activities, and use arrows to connect activities to indicate the logical relationship between activities. There are 4 dependencies in the PDM diagram. The best diagram I have seen in various forums is the one below.
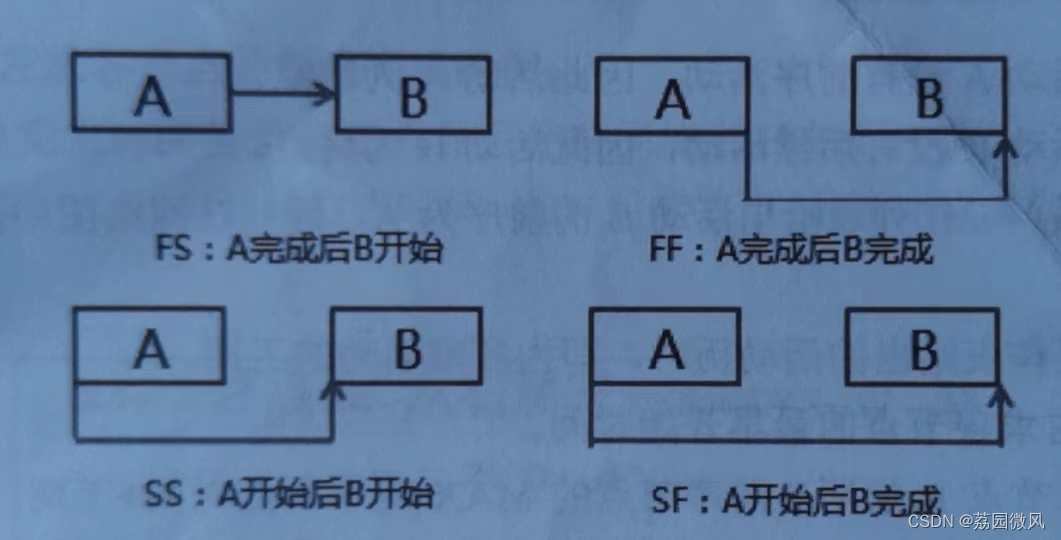
(1) FS (end-beginning). Indicates that the follow-up activity can only start after the predecessor activity ends.
(2) FF (end-end). Indicates that the follow-up activity can be ended only after the preceding activity ends.
(3) SS (start one start). Indicates that the successor activity can only start after the predecessor activity starts.
(4) SF (start-end). Indicates that the successor activity can only end after the predecessor activity starts.
In the PDM diagram, the activity (that is, node) representation diagram, the best diagram I have seen in various forums is the one below.

Among them, the relationship between each time in the node is as follows:
(1) ES (earliest start time) + duration = EF (earliest finish time).
(2) LS (latest start time) + duration = LF (latest finish time).
(3) LS (latest start time) - ES (earliest start time) = TF (total time difference) = LF (latest finish time) - EF (earliest finish time).
Convert the work list to a PDM diagram. The best diagram I have seen in various forums is the one below. .
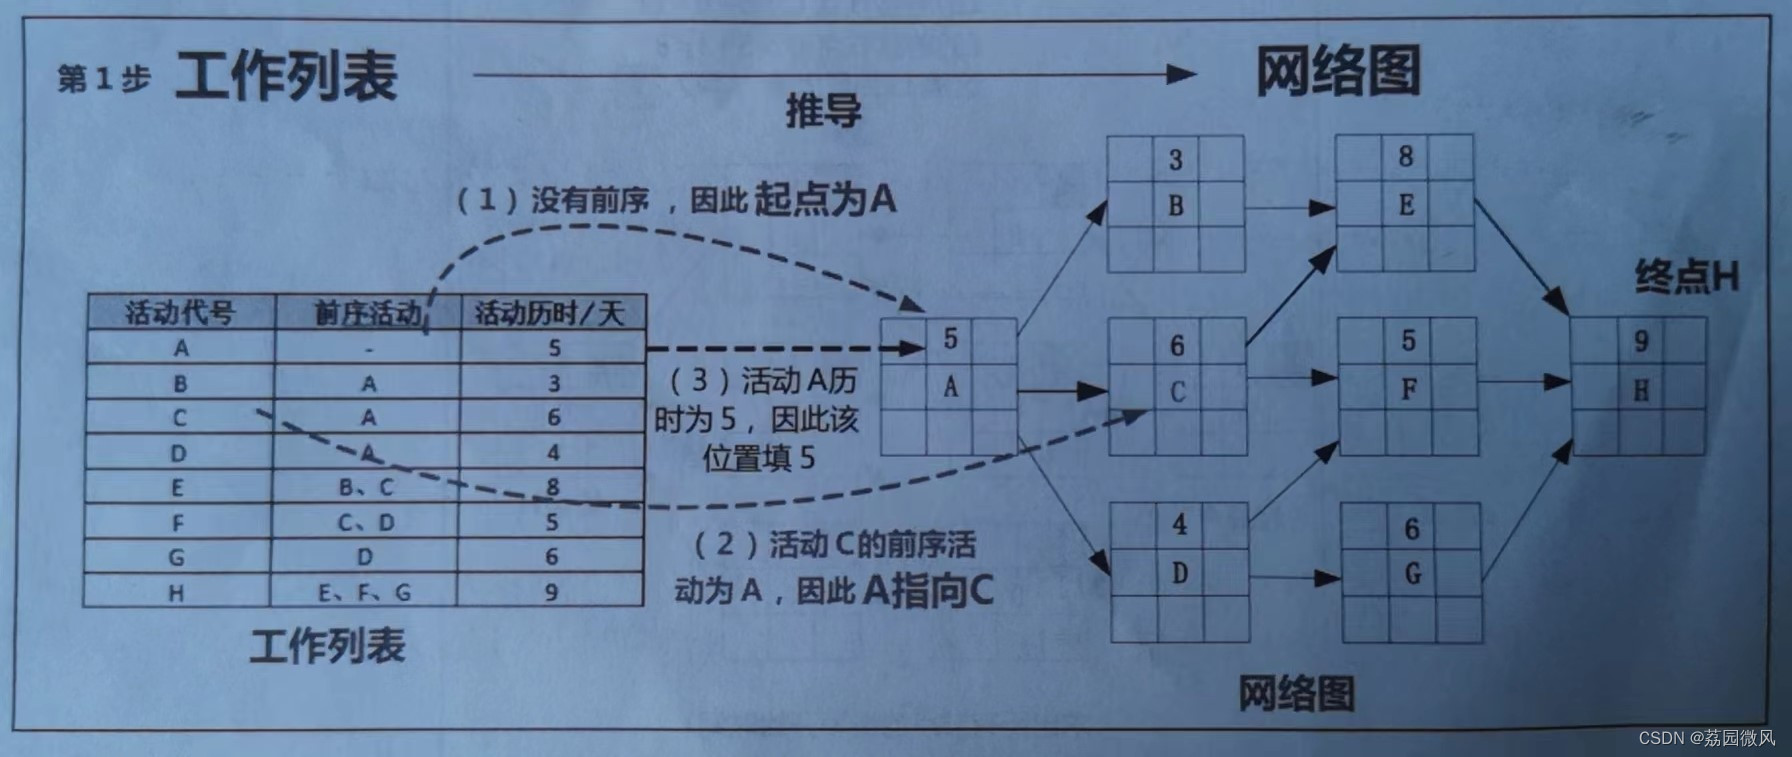
Determine the starting point: Activity A has no predecessor activities, so Activity A is the starting point.
Determine the end point: Activity H has no follow-up activities, so activity H is the end point.
Determine dependencies: The work list gives the preorder of activity B as A, so in the PDM diagram, there is a ray from A to B.
Determine the duration: The activity duration given in the worksheet is the duration of each activity.
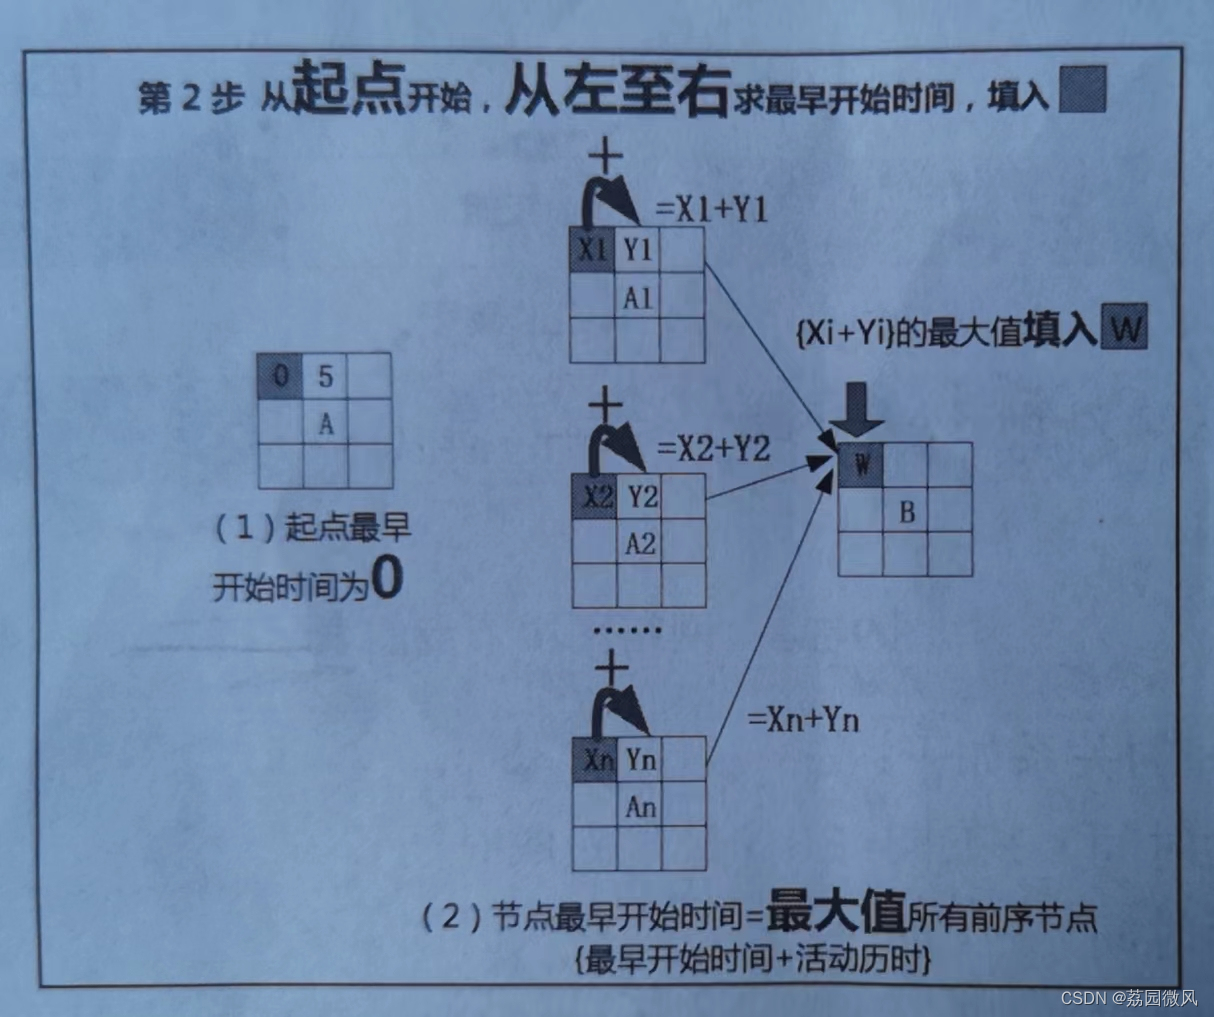
Step 2: Find the earliest start time of each node from left to right.
At present, the best picture I have seen in various forums is the one below. The MAX{earliest start time + construction period} of all the preceding nodes of node B is the earliest start time (ES) of node B.
According to the above ideas, the earliest start time of all nodes corresponding to the PDM graph is obtained. The best graph I have seen in various forums is the following one:

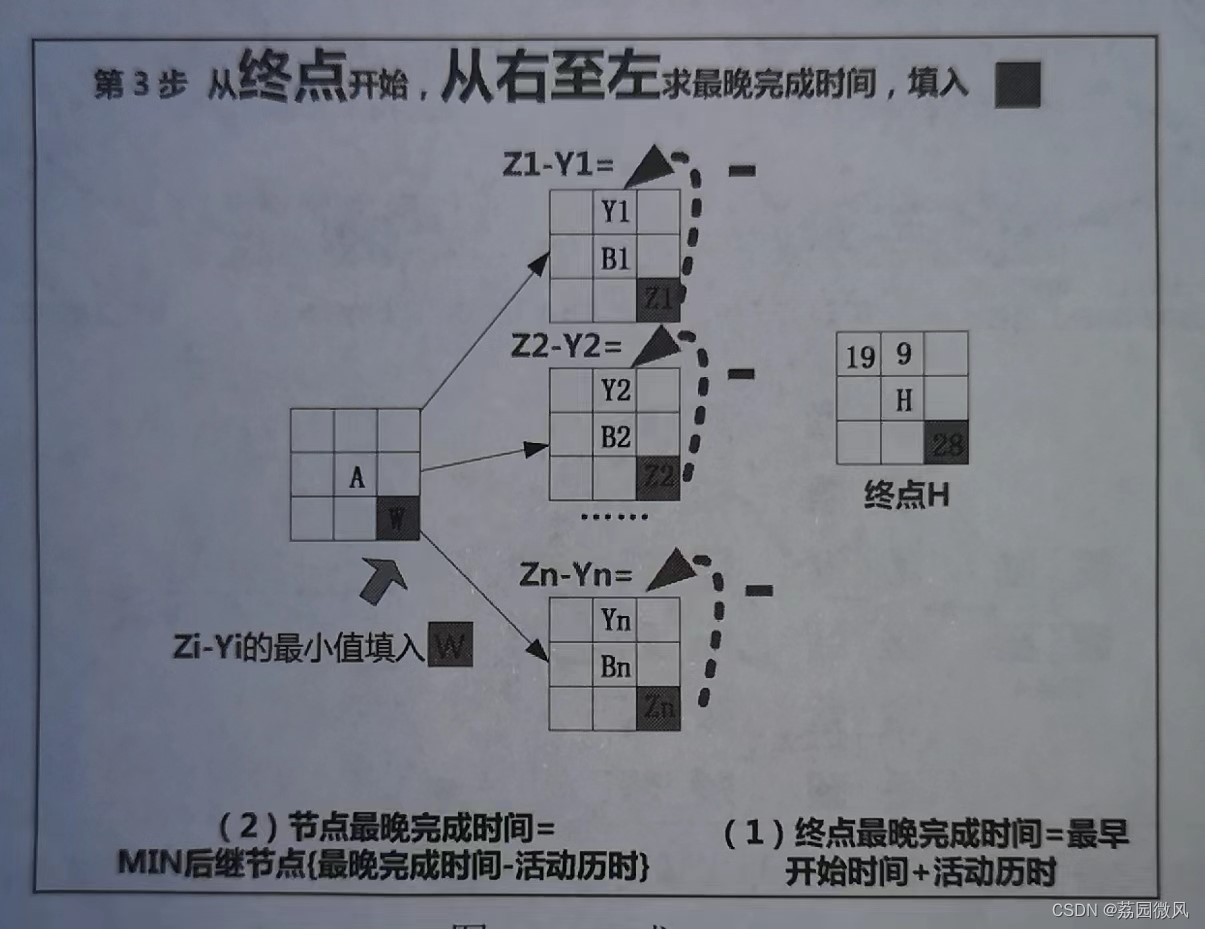
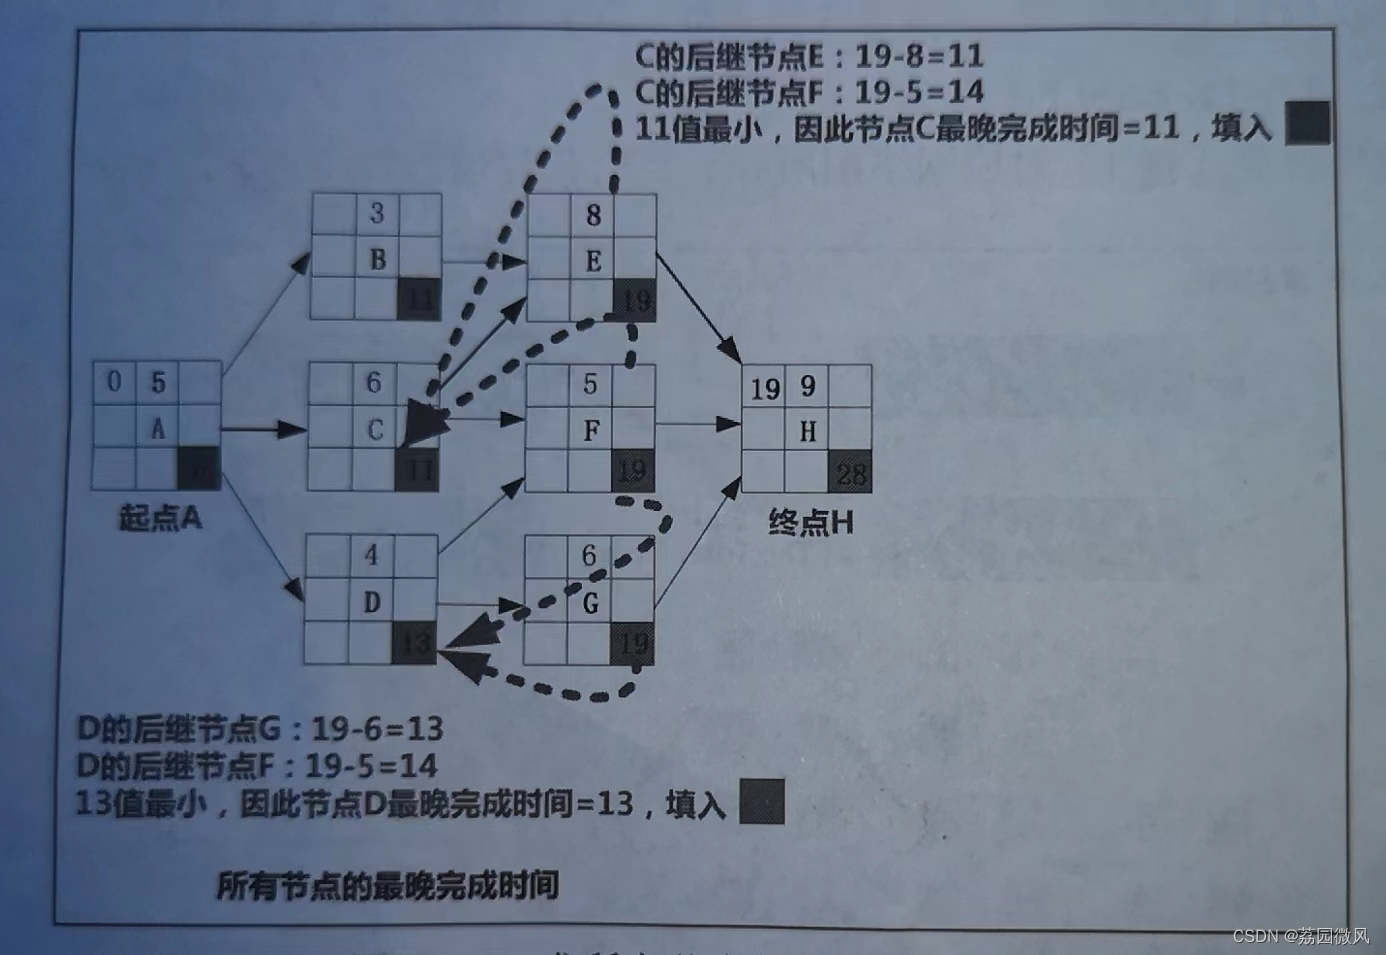
Step 3: Calculate the latest completion time of each node from right to left.
a. The latest finish time of terminal H is equal to the earliest start time of H plus the duration of H.
b. For nodes other than H, the latest completion time = MIN subsequent nodes {latest completion time - activity duration}, the best picture I have seen in various forums is the one below.
According to the above logic, the latest completion time of all nodes in the PDM graph can be obtained. The best graph I have seen in various forums is the one below.
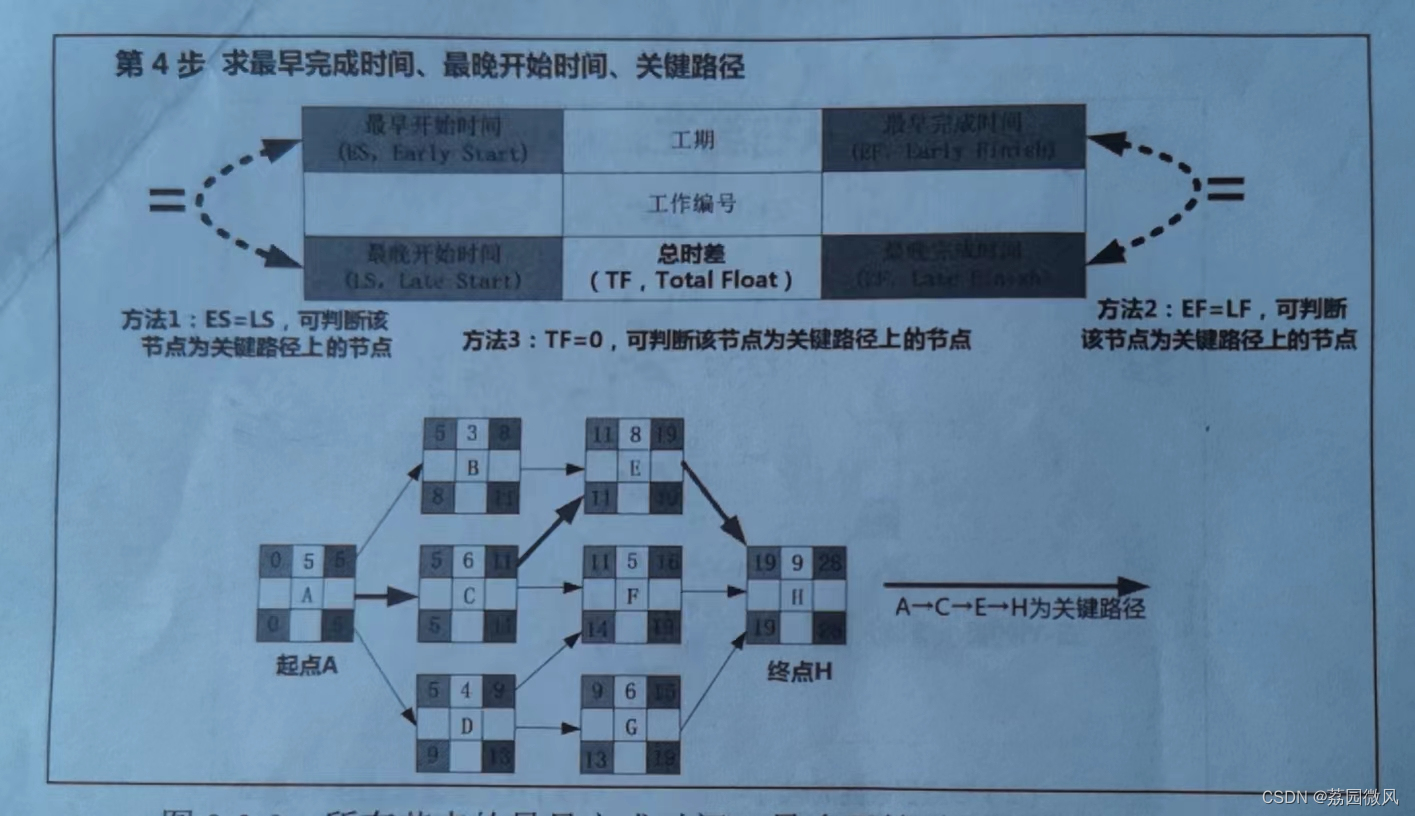
Step 4: Find the earliest completion time, latest start time, and critical path.
According to the time relationship of the nodes, find the earliest completion time, latest start time, and time difference. Among them, nodes with ES=LS or EF=LF can be regarded as critical path nodes. Try to connect these nodes, and the one that can connect from the start to the end is the critical path.
According to the above logic, the earliest completion time, latest start time, and critical path of all nodes in the PDM diagram corresponding to the topic can be obtained. The best diagram I have seen in various forums is the one below.
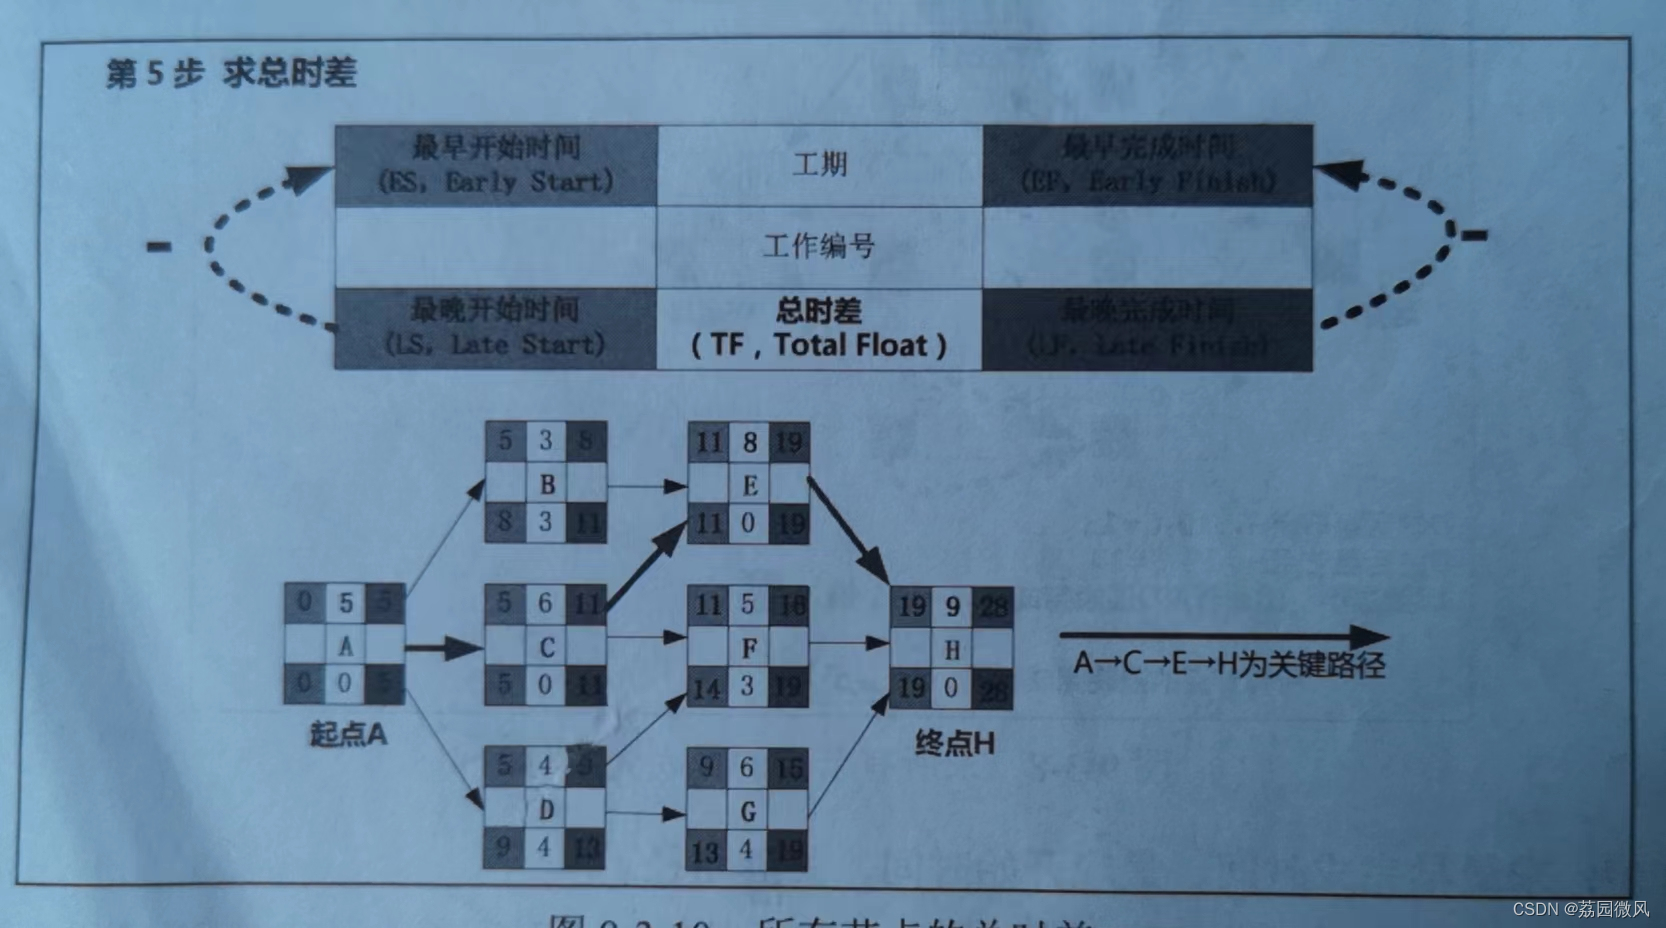
Step 5: Find the total time difference.
The total time difference of a node refers to the maneuvering time it has without affecting the total duration. After the total time difference (maneuvering time) of each activity is used up, it must start immediately, otherwise the construction period will be delayed. The total time difference of nodes on the critical path is 0.
Total time difference formula: TF=LS-ES=LF-EF.
According to the above logic, the total time difference of all nodes corresponding to the PDM graph is obtained. The best graph I have seen in various forums is the one below.
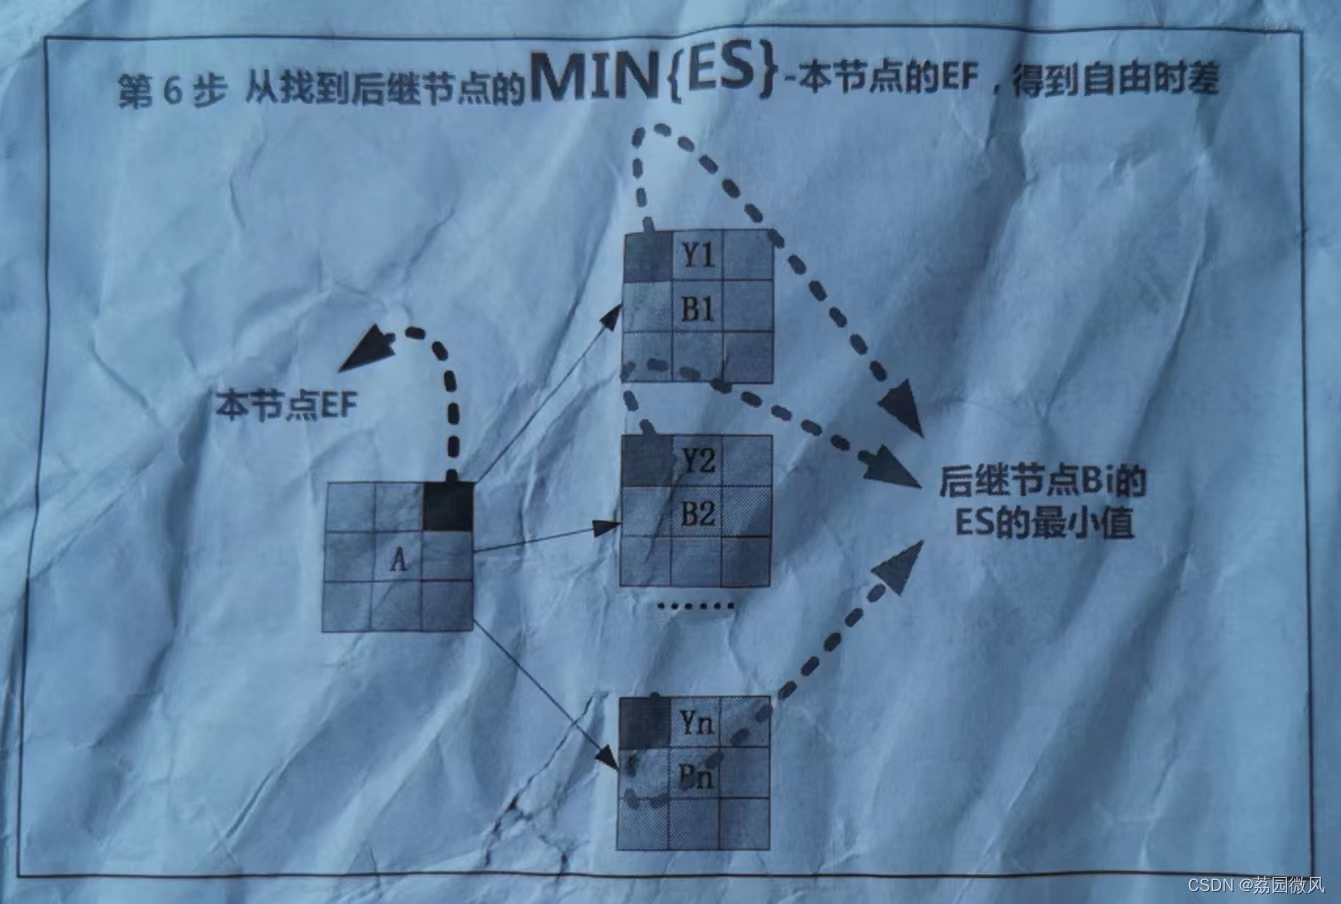
Step 6: Find the free time difference.
The free time difference refers to the maneuvering time of the node under the premise of not affecting the earliest start time of the successor node. As shown in the figure, MIN{ES} of all successor nodes of node A - EF of this node is the free time difference of node A.
Everyone should be proficient in this method as soon as possible, otherwise it is easy to fail to use it in practice.
About the author: Li Yuan Weifeng, born in 1981, senior engineer, master of engineering from Zhejiang University, software engineering project supervisor, has worked as a programmer, software designer, system architect, early Windows programmer, loyal Visual Studio user, C/C++ user The author is a veteran who has studied, worked hard, and struggled in the computer industry for 25 years. He has experienced the UNIX era, the desktop WIN32 era, the Web application era, the cloud computing era, the mobile phone Android era, the big data era, the ICT era, and AI deep learning Era, the age of intelligent machines, I don't know what era there will be in the future, I just remember that this journey is full of hardships and gains, and I am willing to go on with you, full of hope.