overview
Storage has always played an important role in the enterprise, and ensuring data security is the top priority. Is the storage functioning properly? Is our data safe? Are storage managers operating in a standardized manner? These are issues that companies need to pay attention to. So how to ensure that these problems can be effectively resolved? Our choice is Honghu Data Platform. Through Honghu's centralized storage of security logs, operation logs, and alarm logs, using its search function, problems can be quickly located and displayed through its rich report functions.
monitoring target
Monitor security events, such as user logins
Monitor operational events, such as user behavior
Monitor alarm events, such as alarms that store running status
Realize the above monitoring chart display
install vector
As a data collector, Vector can receive the syslog logs of the device and forward them to the Honghu platform. Vector configuration method refer to the following:
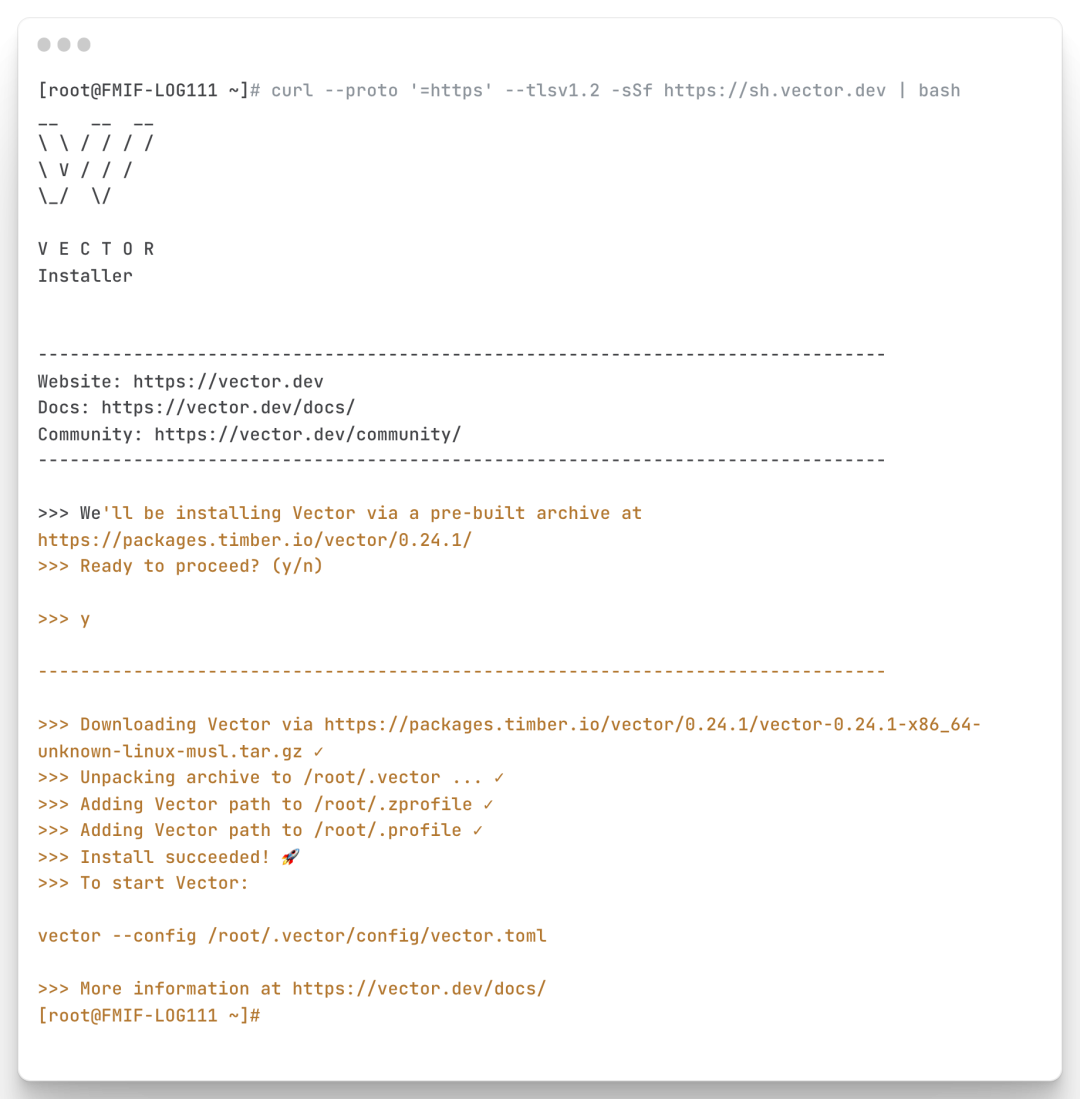
Install Vector
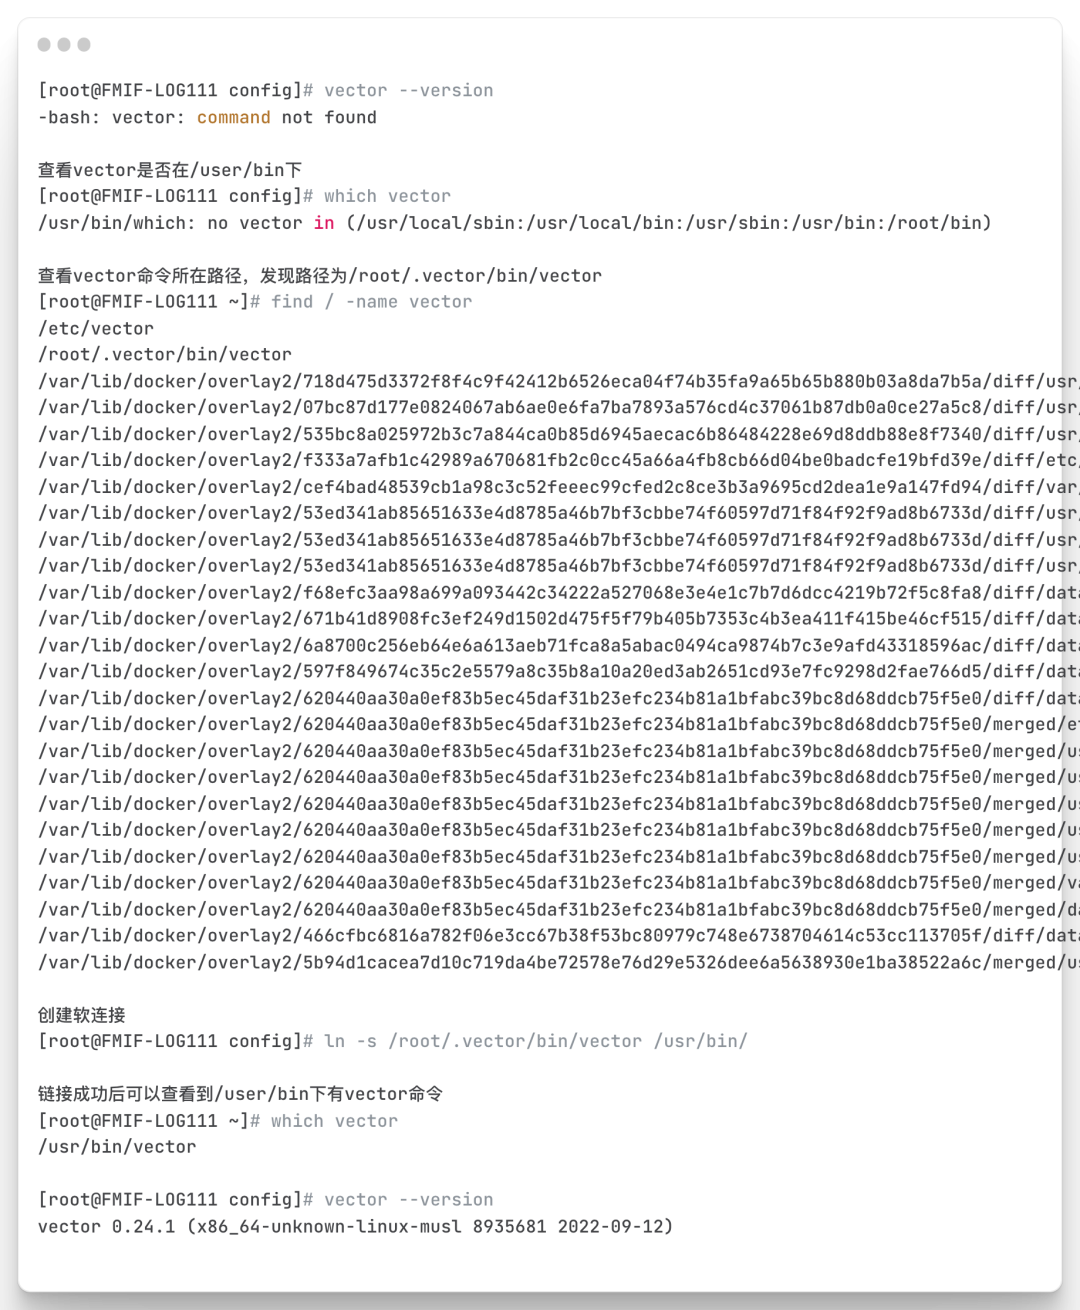
Check the vector version after installation to confirm that the installation is successful
After vector is installed, when executing vector directly, the system will first search for the command under /usr/bin, if it is not in this directory, it will not find it. At this time, we need to create a link file for these commands that cannot be found, and link it to /usr/bin
(For the detailed code, please scan the code at the end of the article to join the Honghu exchange group and obtain the Honghu knowledge base)
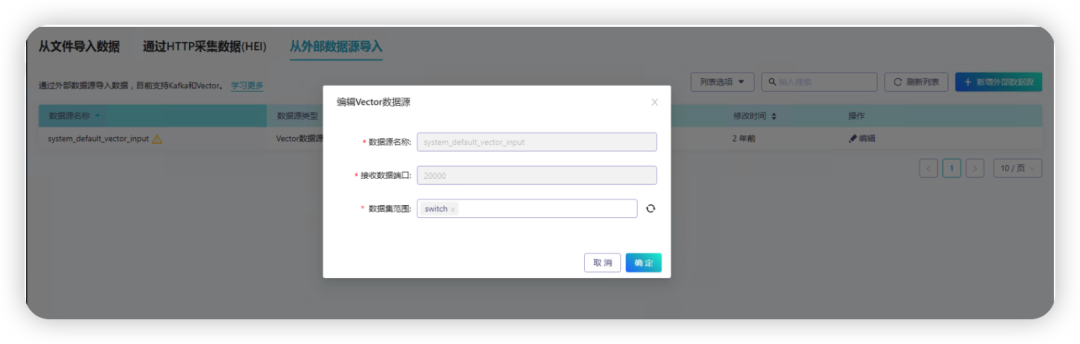
Log in to the Honghu platform, go to Data Management > New Dataset
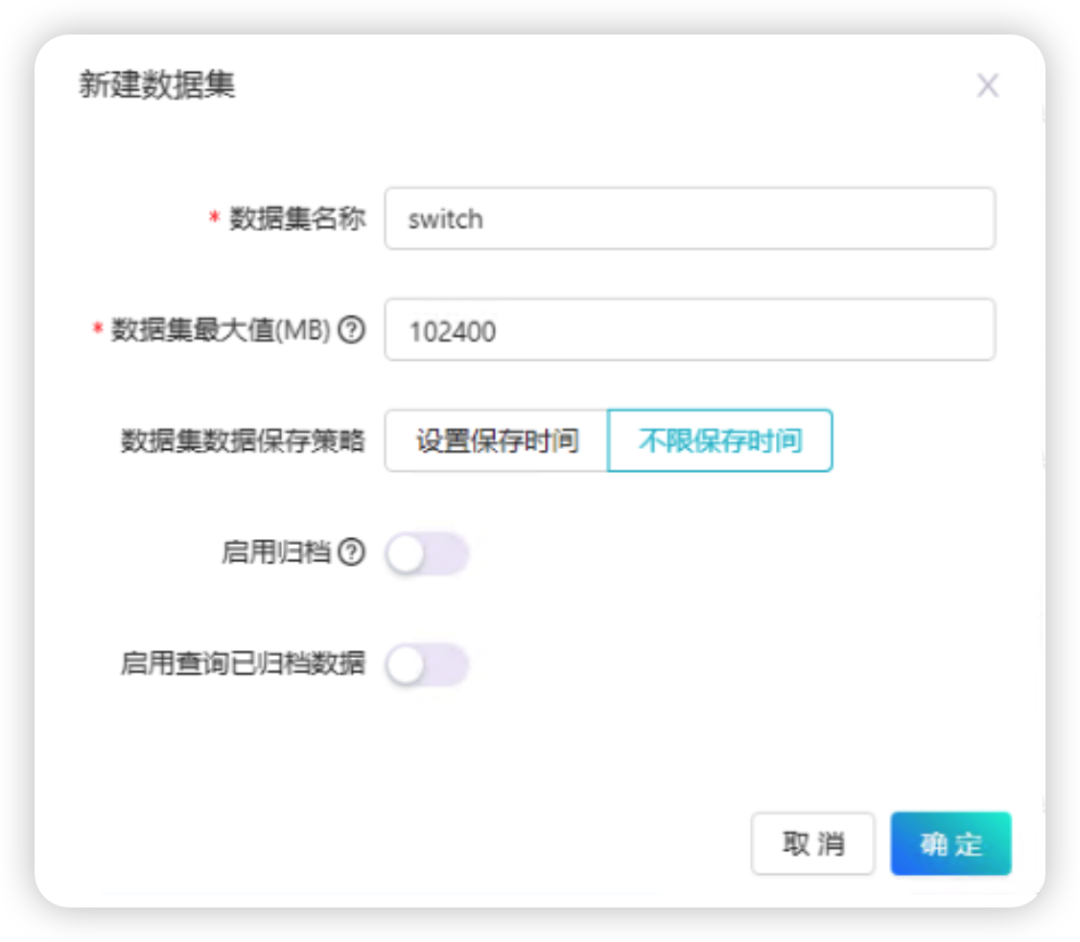
Edit the data source name, select the data set range as the "switch" created above, and it will be enabled
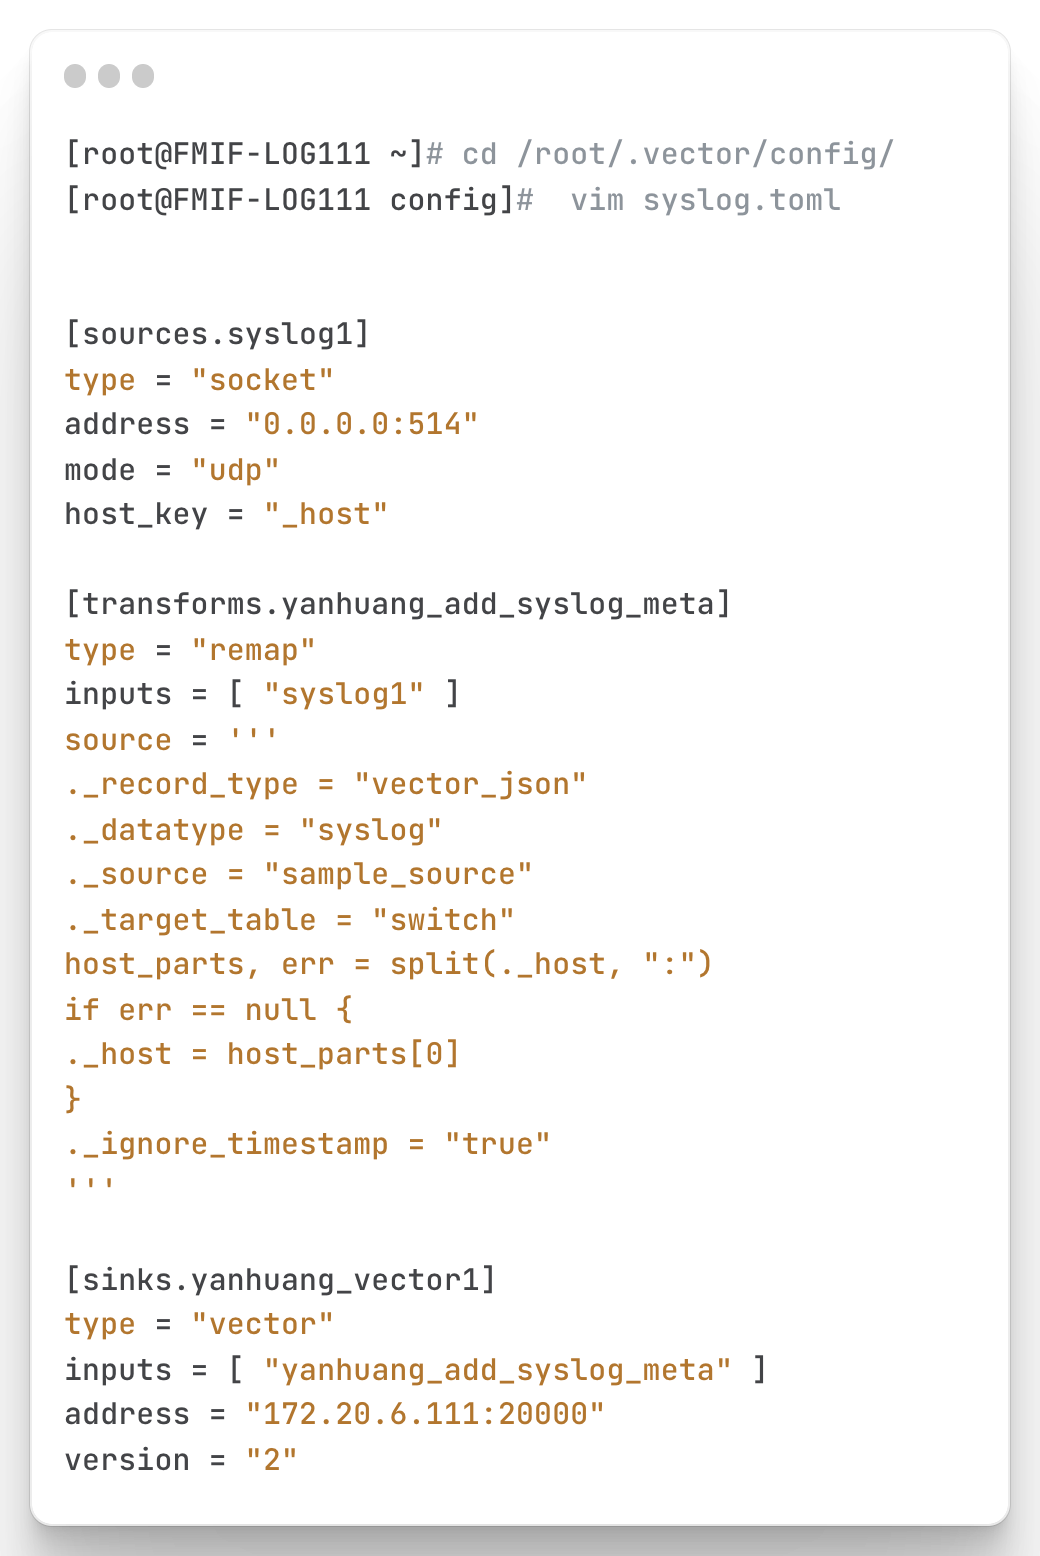
To create a syslog.toml script, you need to adjust the fields
address = "0.0.0.0:514": 0.0.0.0 means to receive syslogs sent by all hosts, and 514 means the receiving port (syslog defaults to 514)
mode = "udp": Indicates the protocol for receiving syslog syslog defaults to udp)
._target_table = "switch" : Indicates the name of the dataset you created above
address = "172.20.6.111:9092": Honghu's IP and corresponding port
Run the modified syslog script, keeping it running.
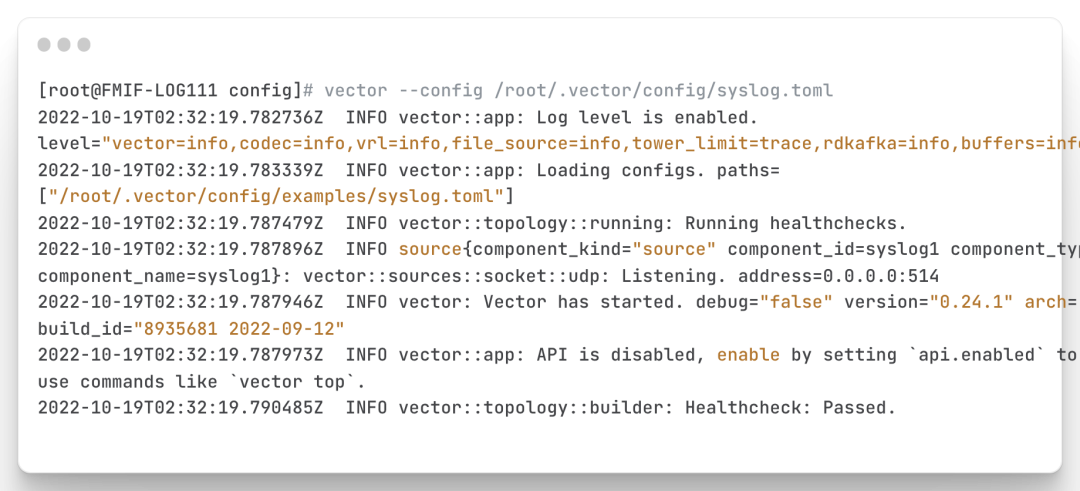
(For the detailed code, please scan the code at the end of the article to join the Honghu exchange group and obtain the Honghu knowledge base)
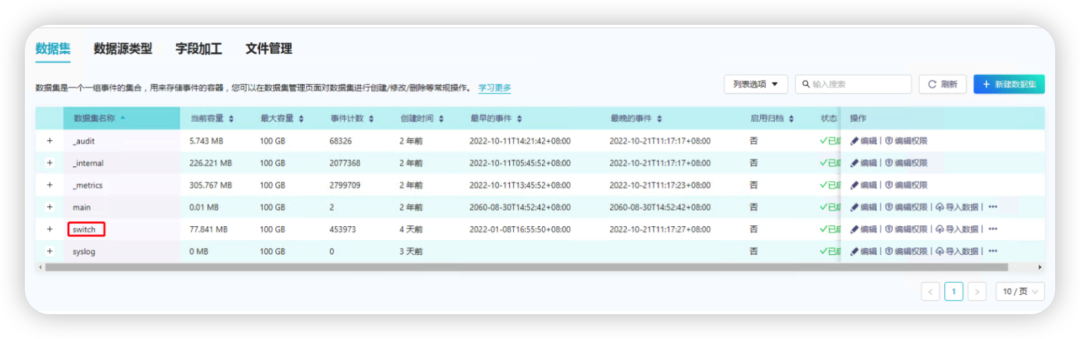
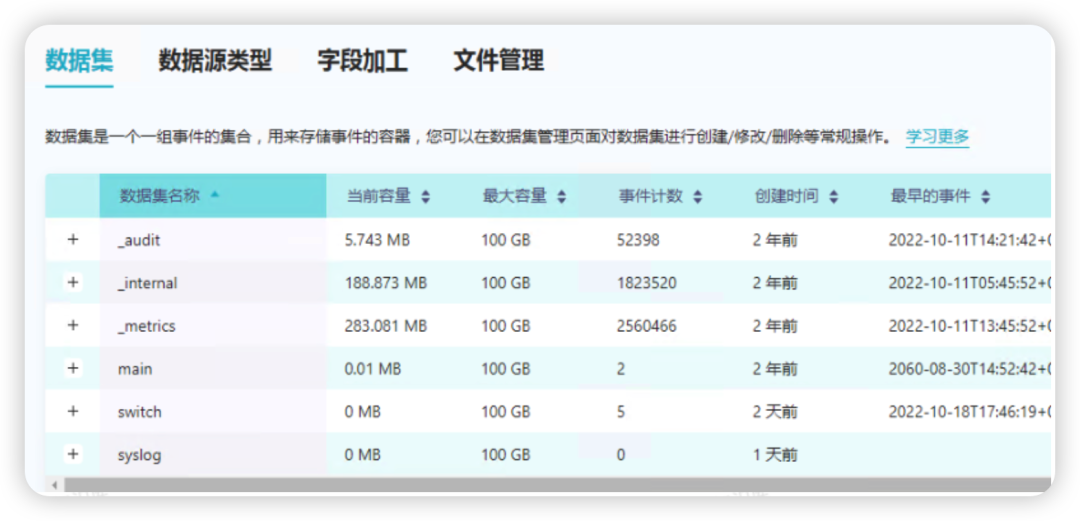
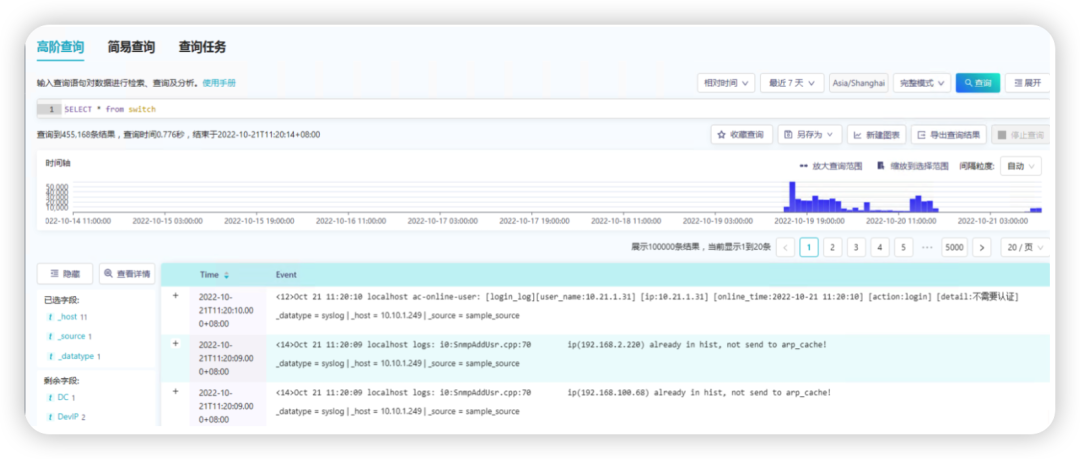
Logging in to the device triggers syslog (Note: logging in to the device will automatically trigger syslog). Log in to the Honghu platform to check whether the data is imported into the switch dataset. As shown in the figure below, the event count has shown that the data import is successful
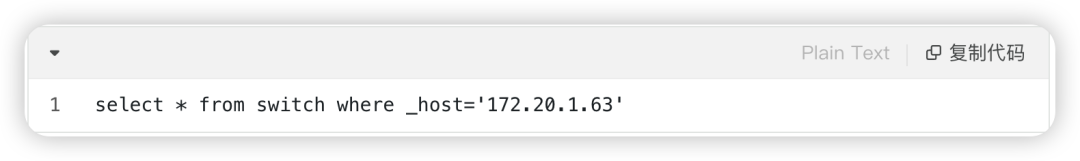
Query the data imported into the switch dataset through vector, for example, here I check the stored logs
Deploy PowerStore syslog
Log in to PowerStore, Settings>Remote Logging>ADD
Host/IP Address Fill in Honghu's address
Protocol: The default is udp (consistent with the syslog.toml above)
Port number: default 514 (consistent with syslog.toml above)
Audit Type: Select all
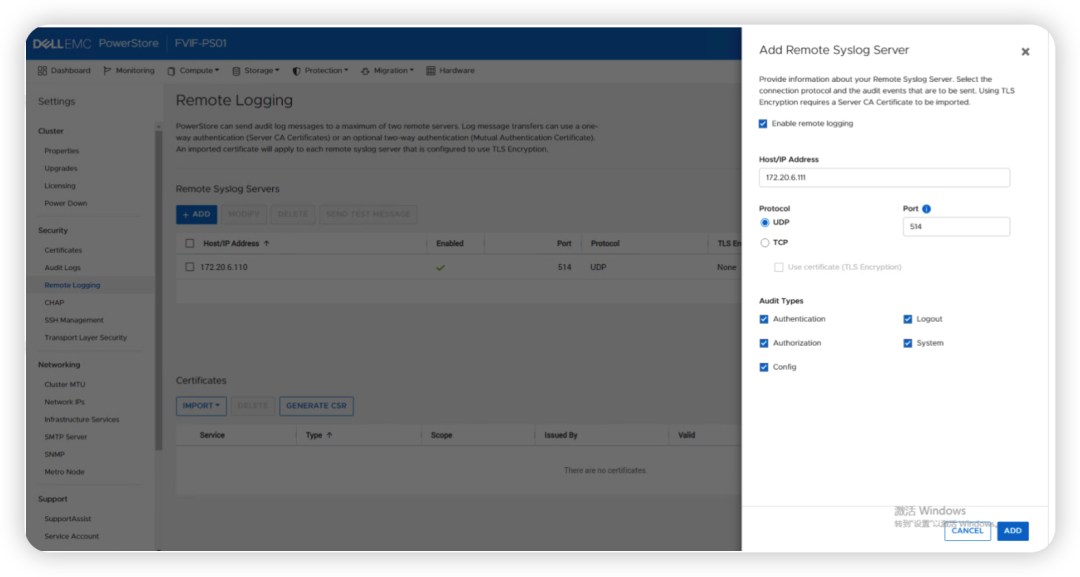
SEND TEST MASSEGE, send a test log message to test whether Honghu received it

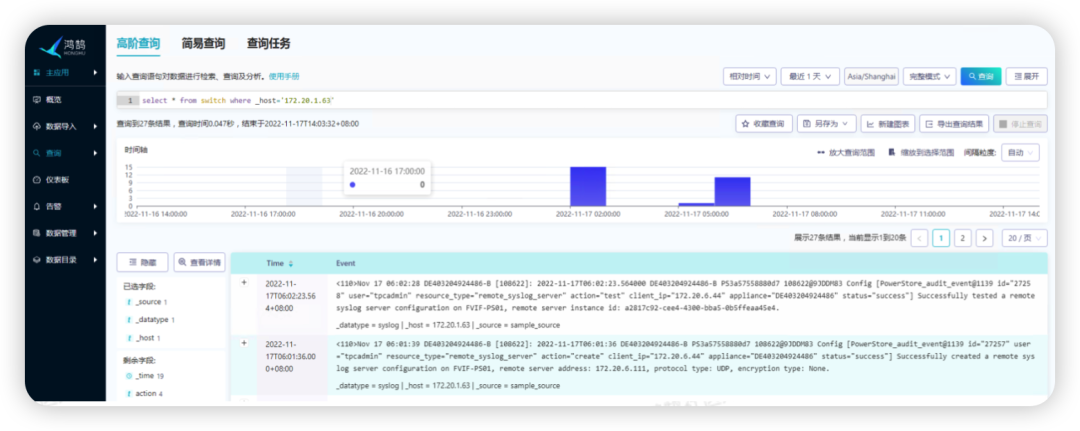
Query the log on Honghu, and found that the test log sent by the storage has been received, and the configuration of syslog is completed.
field extraction
Usually, the logs sent by storage are of various types, such as login-related logs and configuration-related logs. The format of these logs will be extracted once in Honghu. We can see the fields extracted by default. If These fields already contain what you need, so you can use them directly. If some fields are not extracted, you need to extract them yourself. Honghu supports regular expressions to extract fields.
Taking the following log as an example, we write regular expressions
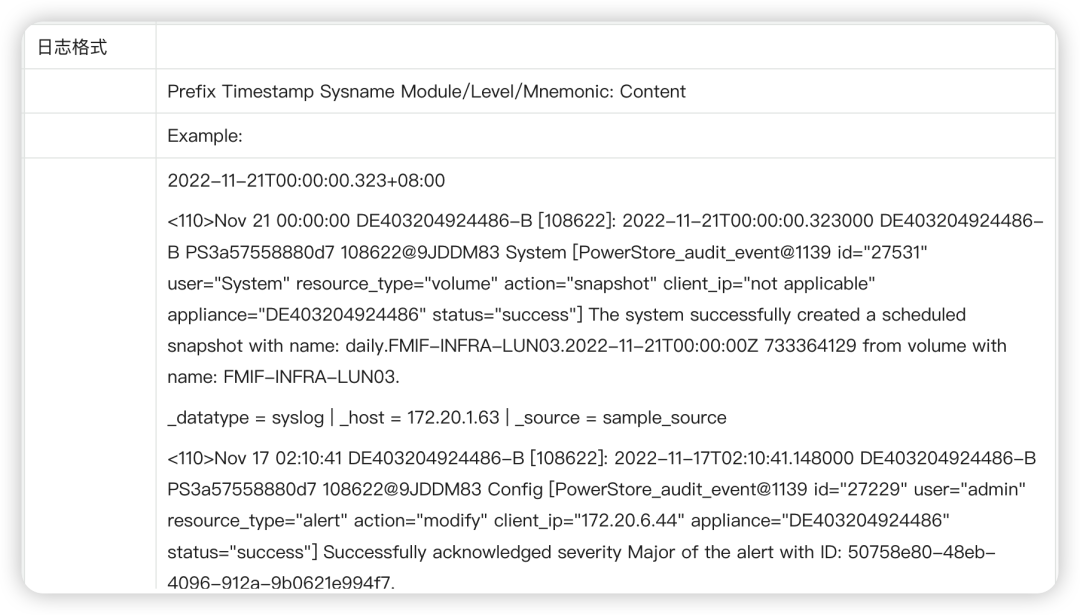
We can copy the log to the regular expression testing website to write, so that we can know where we made mistakes at any time. The following is the test site I used https://regex101.com/
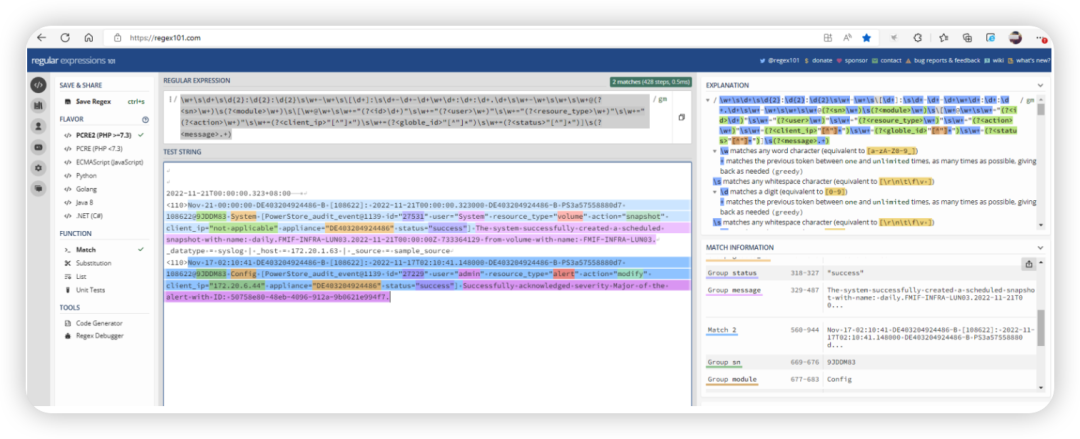
The regular expression is as follows
\w+\s\d+\s\d{2}:\d{2}:\d{2}\s\w+-\w+\s\[\d+]:\s\d+-\d+-\d+\w+\d+:\d+:\d+.\d+\s\w+-\w+\s\w+\s\w+@(?\w+)\s(?\w+)\s\[\w+@\w+\s\w+="(?\d+)"\s\w+="(?\w+)"\s\w+="(?\w+)"\s\w+="(?\w+)"\s\w+=(?"[^"]*")\s\w+=(?"[^"]*")\s\w+=(?"[^"]*")]\s(?.+)
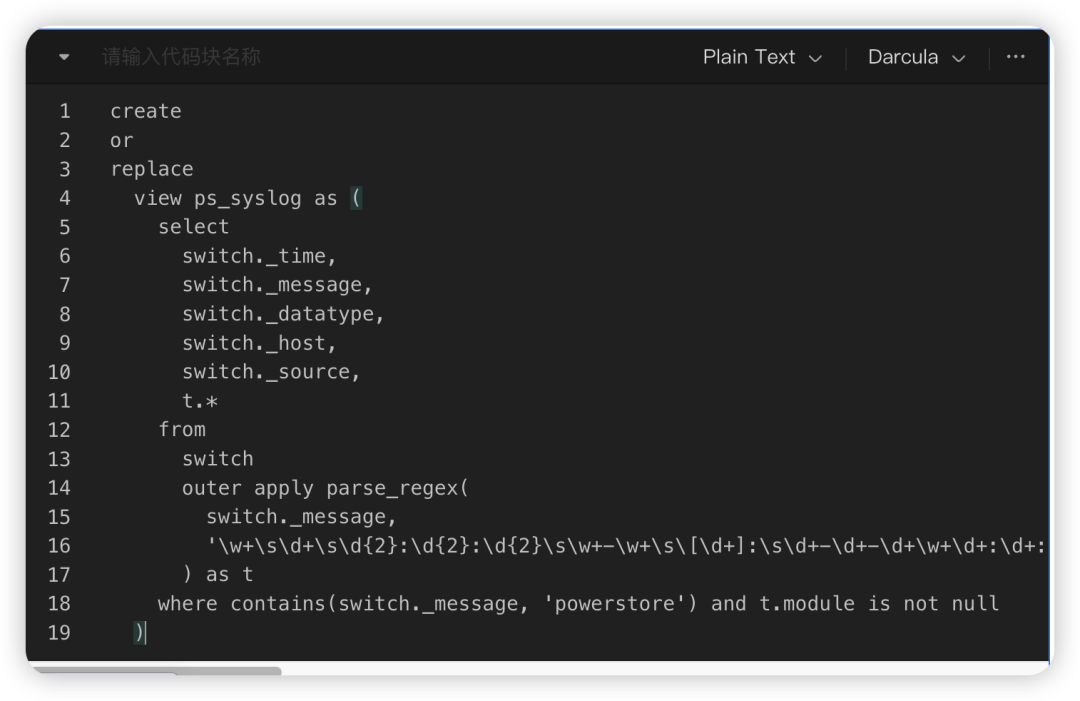
ps_syslog, here is the name of the view that needs to be created
In the switch._time script, starting from the sixth line, switch refers to the original data set that needs to extract data. Here you need to replace it according to your data set name.
where contains( switch._message, 'powerstore') 'powerstore' refers to the specific field you want to search for this write log, through powerstore you can limit all logs containing powerstore in the log
(For the complete code, please scan the code at the end of the article to join the Honghu exchange group and obtain the Honghu knowledge base)
Run in higher order query, success
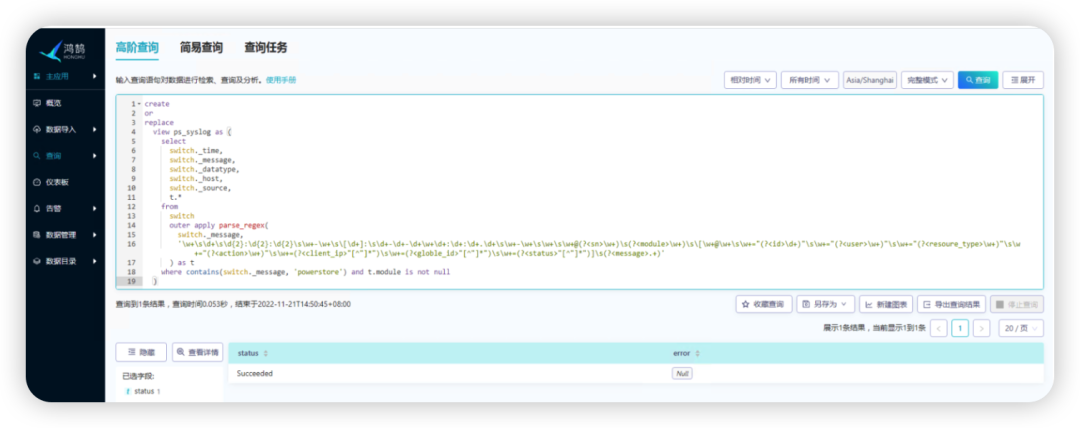
Let's run the search statement test, and we can see the fields we extracted
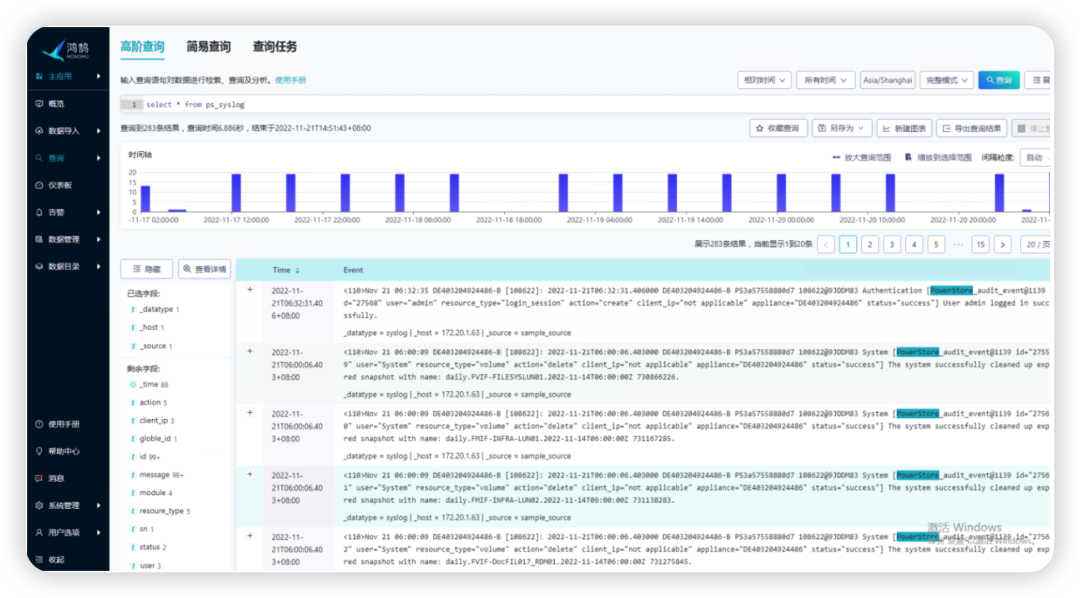
chart creation
There is an important point to be mentioned before the chart display. Generally, when the log is not triggered, the log will not be generated. We need chart display, so we need as much log data as possible. We can perform some operations on storage, such as logging in, creating test volumes, deleting test volumes, etc., to enrich log data.
Dashboards > New Dashboard
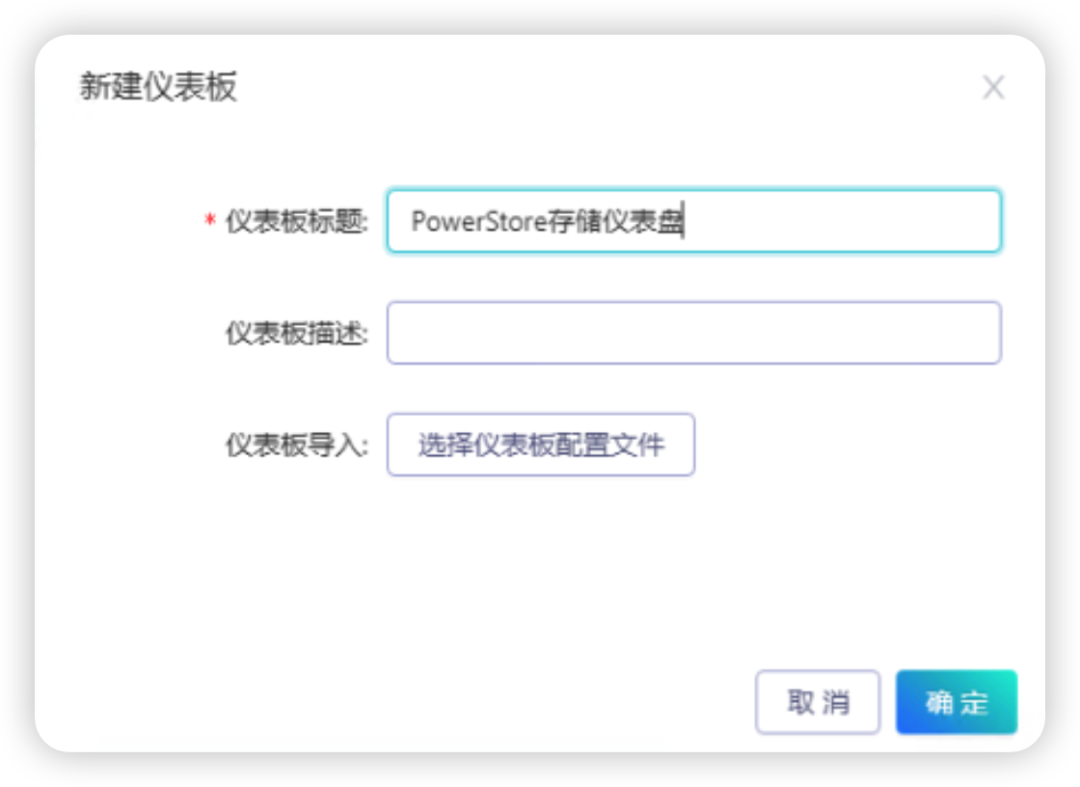
Created
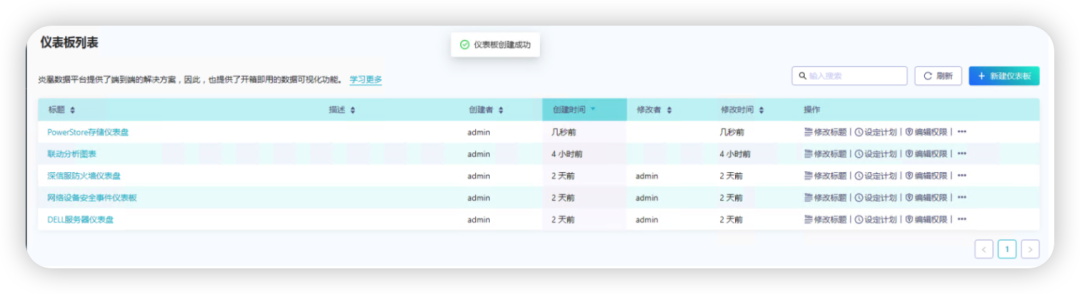
Chart Creation Method 1
Here I will introduce two ways to create charts, and the second way is generally recommended. Honghu supports a variety of chart styles. As long as the search statement can generate result data normally, you can choose the corresponding chart. This article does not describe the styles of all charts, only how to create them. The first is to create charts within the dashboard, as follows:
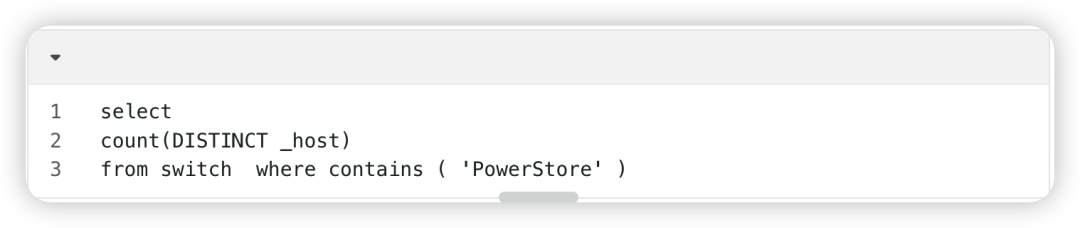
New Chart > Equipment Quantity
Select the chart type: single-value trend chart
Query statement: This statement can be verified in the query first to confirm that the result of the search is the desired
time range: select 30 days, you can adjust it according to your own situation
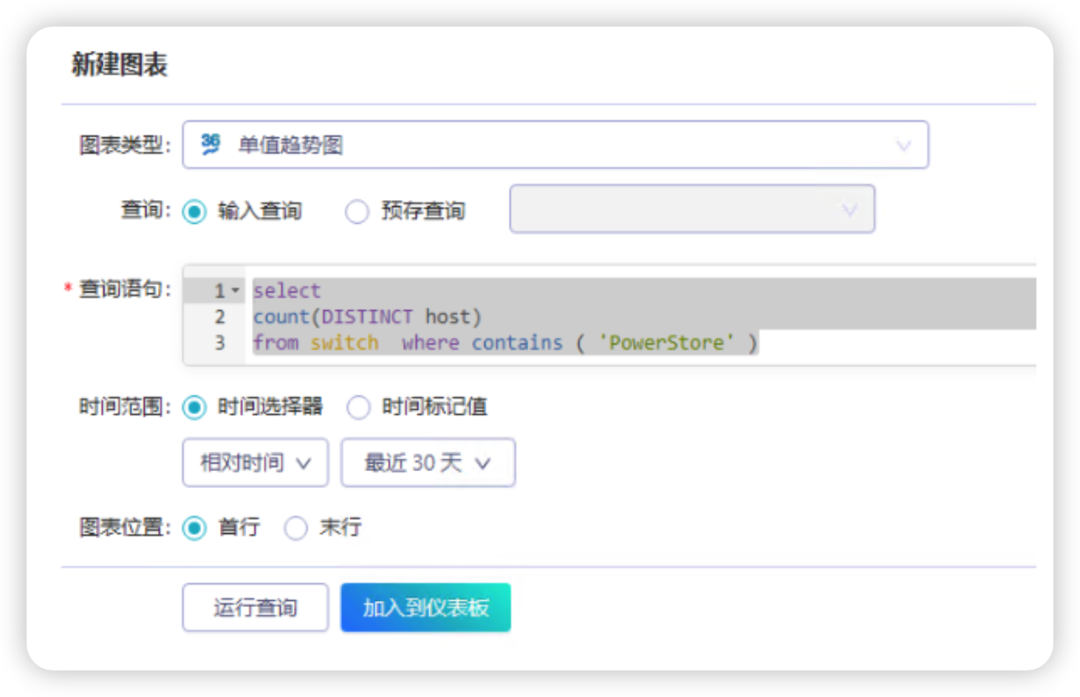
generate chart
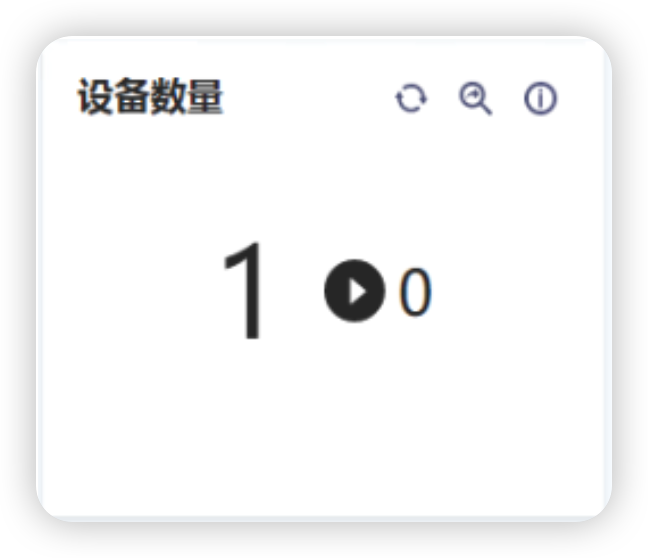
Chart Creation Method 2
The second method of chart creation is to search first, and then use the searched data to generate a chart and add it to the corresponding dashboard. The method is as follows:
Enter search terms in query
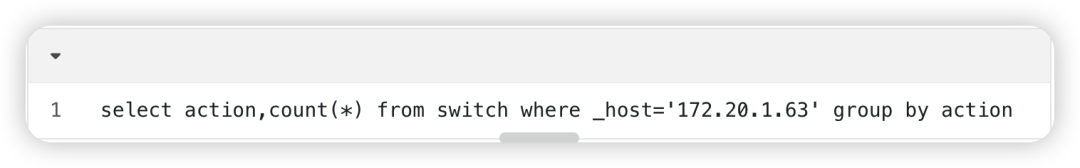

After the query statement runs, click New Chart
Chart type: You can choose from various chart types according to your needs
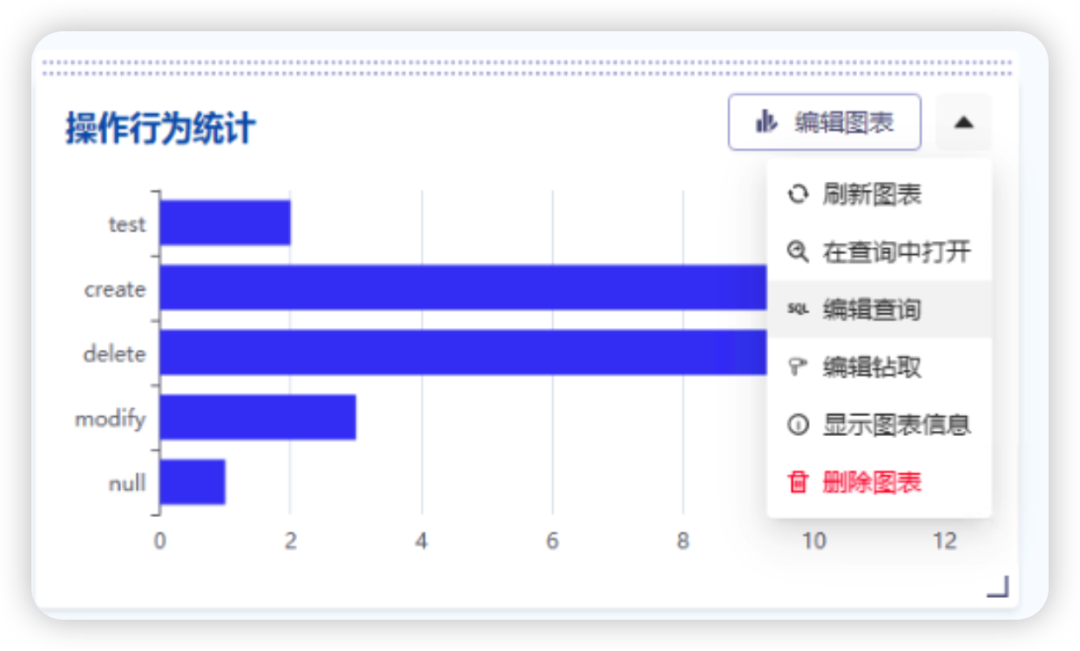
Title: Operational Behavior Statistics
Select Dashboard: Means which dashboard to save the chart to
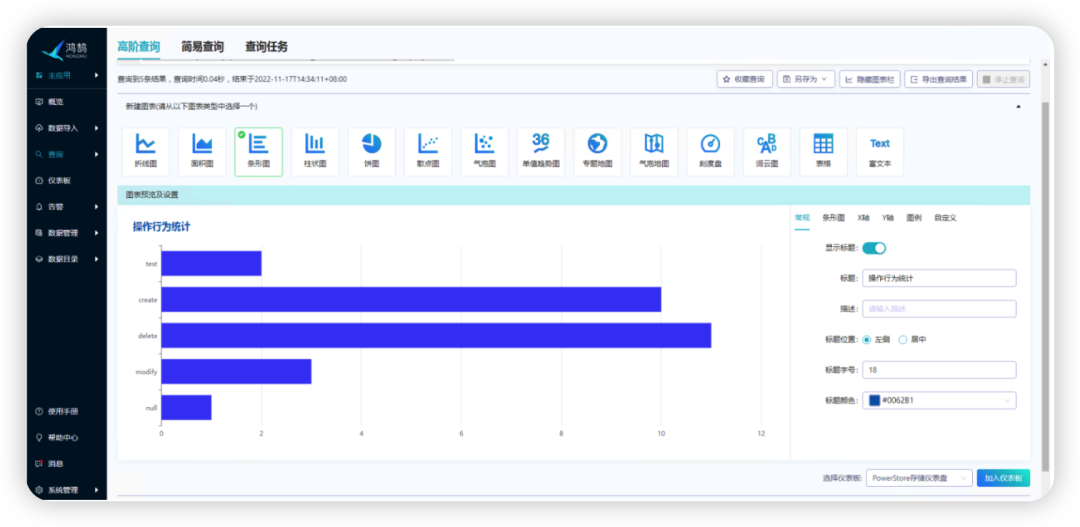
After adding, you can see the added chart in the dashboard

You can choose the above two methods according to the situation, and the second method is more intuitive and simple. I will not show the display of the chart in detail here, but list the search statements for your reference.
search phrase
All search terms in this article are listed below for reference
Tip: The command part of the search statement will call the extracted character field. If the character field is not extracted, an error will appear
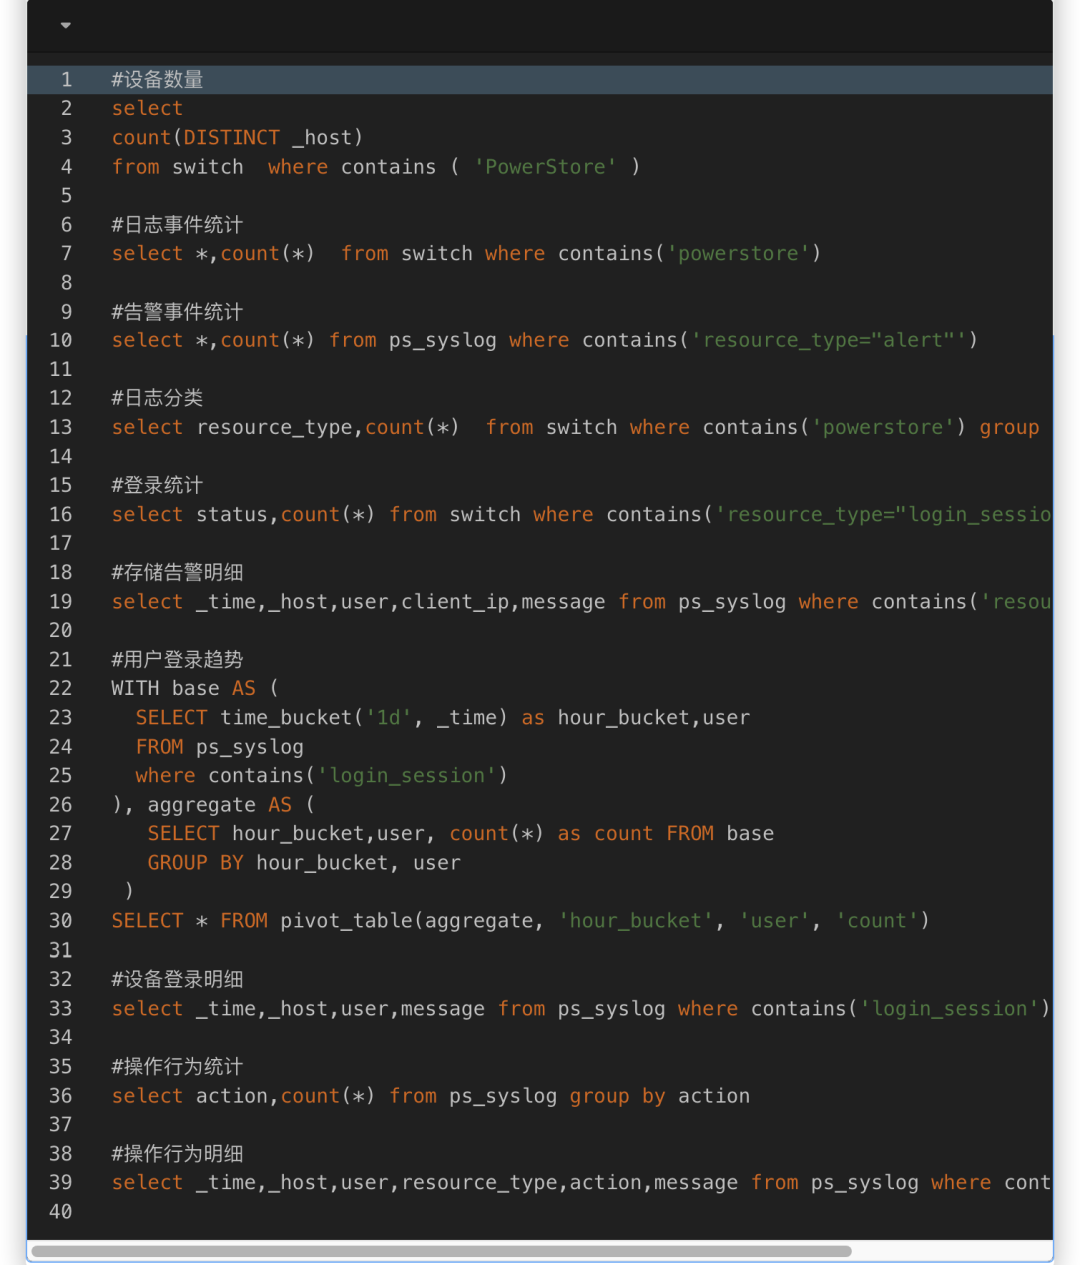
(For the complete code, please scan the code at the end of the article to join the Honghu exchange group and obtain the Honghu knowledge base)
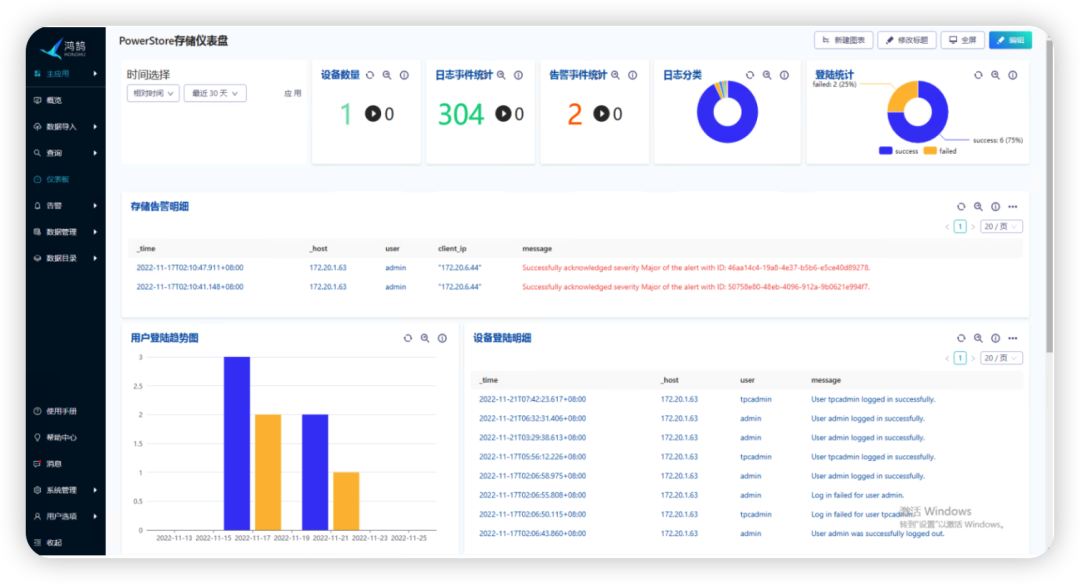
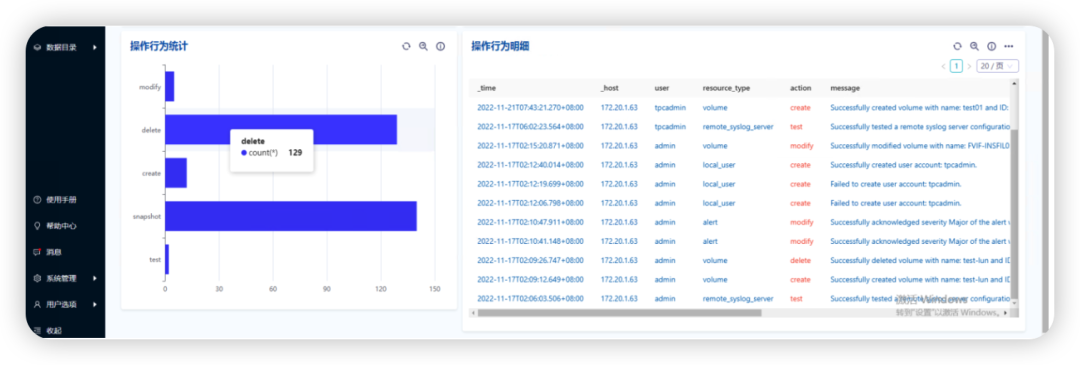
Show results
extension
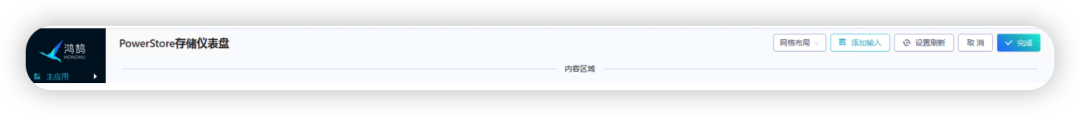
According to the chart creation above, the time of the chart is selected when the chart is generated, such as 30 days, or 1 day of data display. In actual scenarios, if we look at the chart, we want all the charts to be flexible according to the selection. How to do the display, for example, I want to see 1 day, want to see 7 days, then we can make a "time item" at this time, the method is as follows:
Creation time selection
edit
add input
Input Type: Select Time
Tag name: time_range (this is used to call the chart)
Display label: the name displayed by this time item
Default tag value: choose here according to your own situation, I usually choose relative time and set it to 30 days
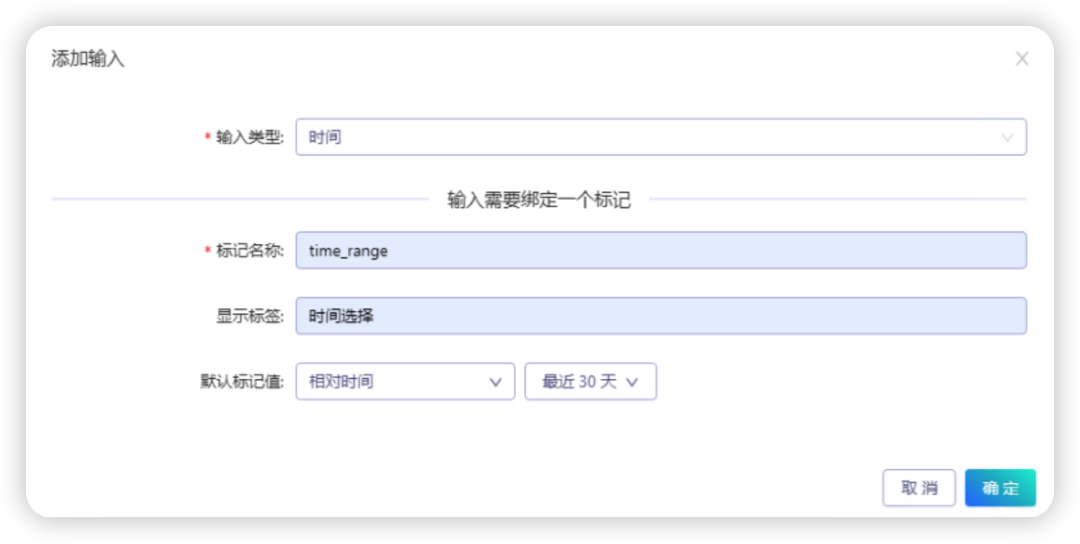
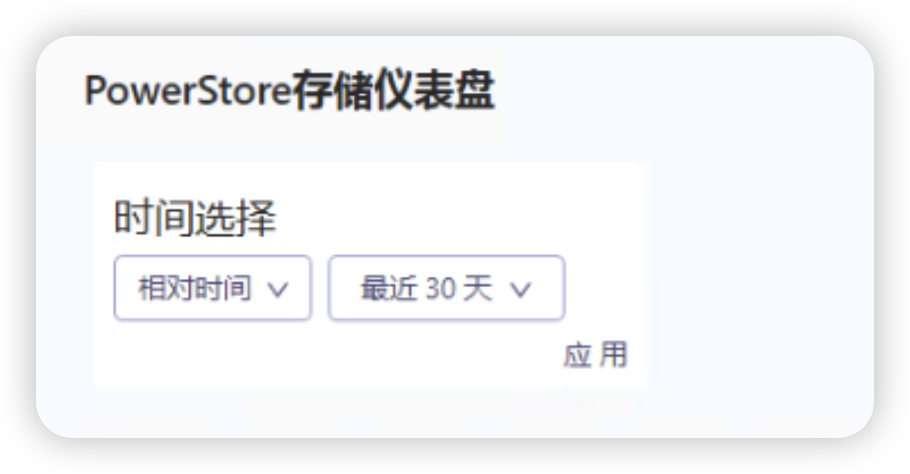
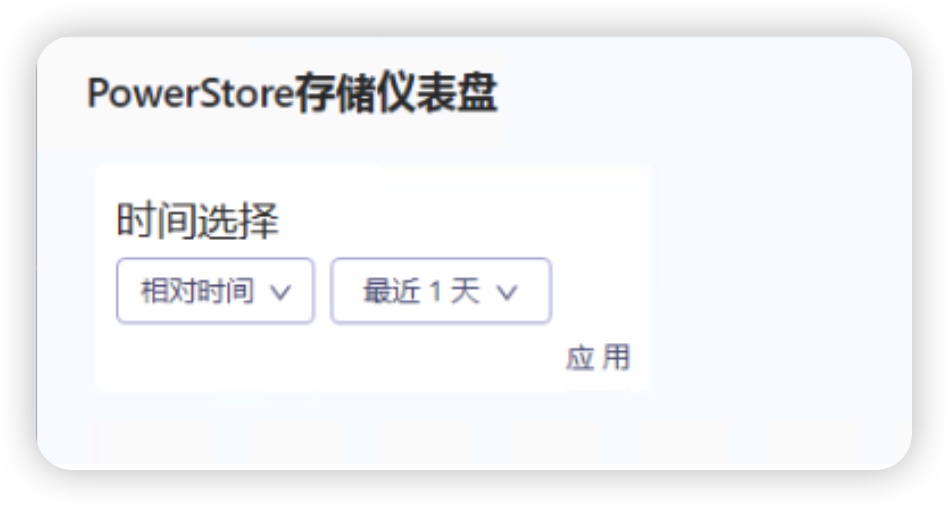
After confirmation, a time selection item will be generated
call time selection
Select the chart you want to invoke, select Edit Query
Change the query time range to a time tag value, and the tag name time_range (the tag name filled in when selecting the time created above)
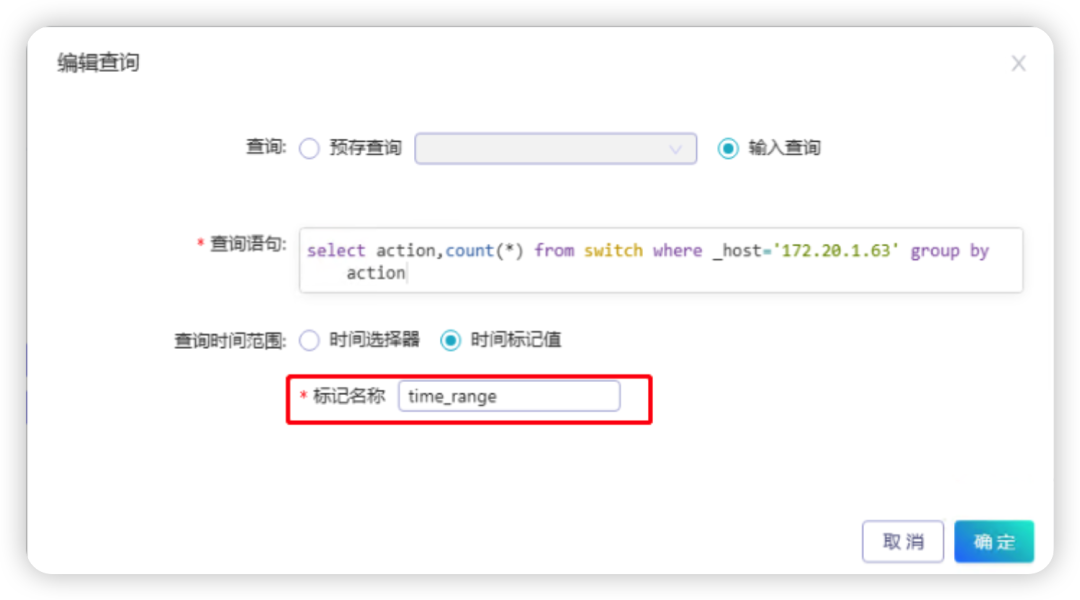
After saving, you can choose the time you want to view in "Time Selection", click Apply, and the chart will change according to the time
Summarize
Generally speaking, the storage device itself will provide its own log audit function, and it can also support viewing and simple search. But let’s take a deeper look at this matter. If we have a set of storage, the function of the storage itself can support it, but What if we have 10 or even more storage? Using Honghu, we can store the stored data in a unified way through syslog, and use its search statements to perform fast searches and generate corresponding charts, which can greatly save our operation and maintenance work.
Follow-up
This time, the storage is only a preliminary display based on the existing log data. With the enrichment of logs, we will need to further optimize it. The general direction includes
-
Multiple sets of storage device monitoring, for example, if we have 10 sets of storage, we should be able to flexibly choose to view the specific situation of each set of storage, and the chart will change according to the storage we choose
-
Hardware failure monitoring, such as hard disk failure, controller failure, link failure
-
Monitored alarms, when certain error events occur, actively trigger email alarms