Eclipse remote debugging
Java itself supports the debugging function and provides a simple debugging tool - JDB, which is similar to the powerful GDB. JDB is also a character interface debugging environment, and supports setting breakpoints and thread-level debugging.
Due to the differences in the deployment environment, I believe that many friends have encountered the situation that the functions that have been normally tested in the development environment have bugs in the test environment or even the production environment. In general, the production environment can adopt a relatively simple method, that is, obtain the running environment context through the log, analyze the log file and try to reproduce the bug. This will bring many problems. First, log analysis is a time-consuming task. Second, the existing log records may not reflect the problem. You may need to repeat this process many times (analyzing the log -> Guess the problem -> Add log -> Deployment -> Get log) to slowly approach the problem. If it is a test environment, we have an additional option—remote debugging—start the program in debug mode in the test environment, and use Eclipse to set breakpoints in the project for debugging.
- Modify server startup parameters
Add to the process startup parameters on the Linux server:
"-Xdebug -Xrunjdwp:transport=dt_socket,suspend=n,server=y,address=5000"
Connect to the debug service provided by myhost:5000.
-Xdebug informs the JVM to work in DEBUG mode,
-Xrunjdwp informs the JVM to use (Java debug wire protocol) to run the debugging environment. This parameter also contains a series of debugging options:
transport specifies the transmission method of debugging data;
dt_socket refers to using SOCKET mode;
server=y/n Whether the VM needs to be executed as a debug server;
suspend=y/n Whether to start the VM after the debug client establishes a connection.
After the setup is complete, start the Linux server.
Check whether the port is started successfully netstat -apn|grep 5000

Indicates that the listening port has been successfully started
2. Configure eclipse remote debug
In eclipse, select the project, right click -> Debug As, go in and select the last Ddebug Configurations...


Right mouse button to create a new remote application

The next step is to put a breakpoint where you want the breakpoint,,,,,, and then run. . . .
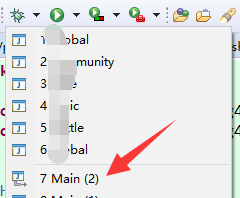
Note that you must choose Main2 when running. This is the name when we just set up the remote. Here I did the test and did not change it.
Then you will be surprised to find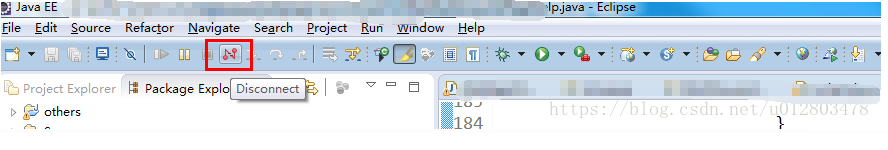
The N button in this place actually turns red, indicating that the remote debugging link is successful,,,,, just click this button to stop debugging. . . . Of course, this only stops the local breakpoint, and does not close the regular